Ghostrider, The Pattern Is Full
While I was pounding the table at the recent lows and pointing to how oversold the market was on all time frames, I was expecting the next rally would be strong. But, at this time, we are certainly quite stretched to the upside.
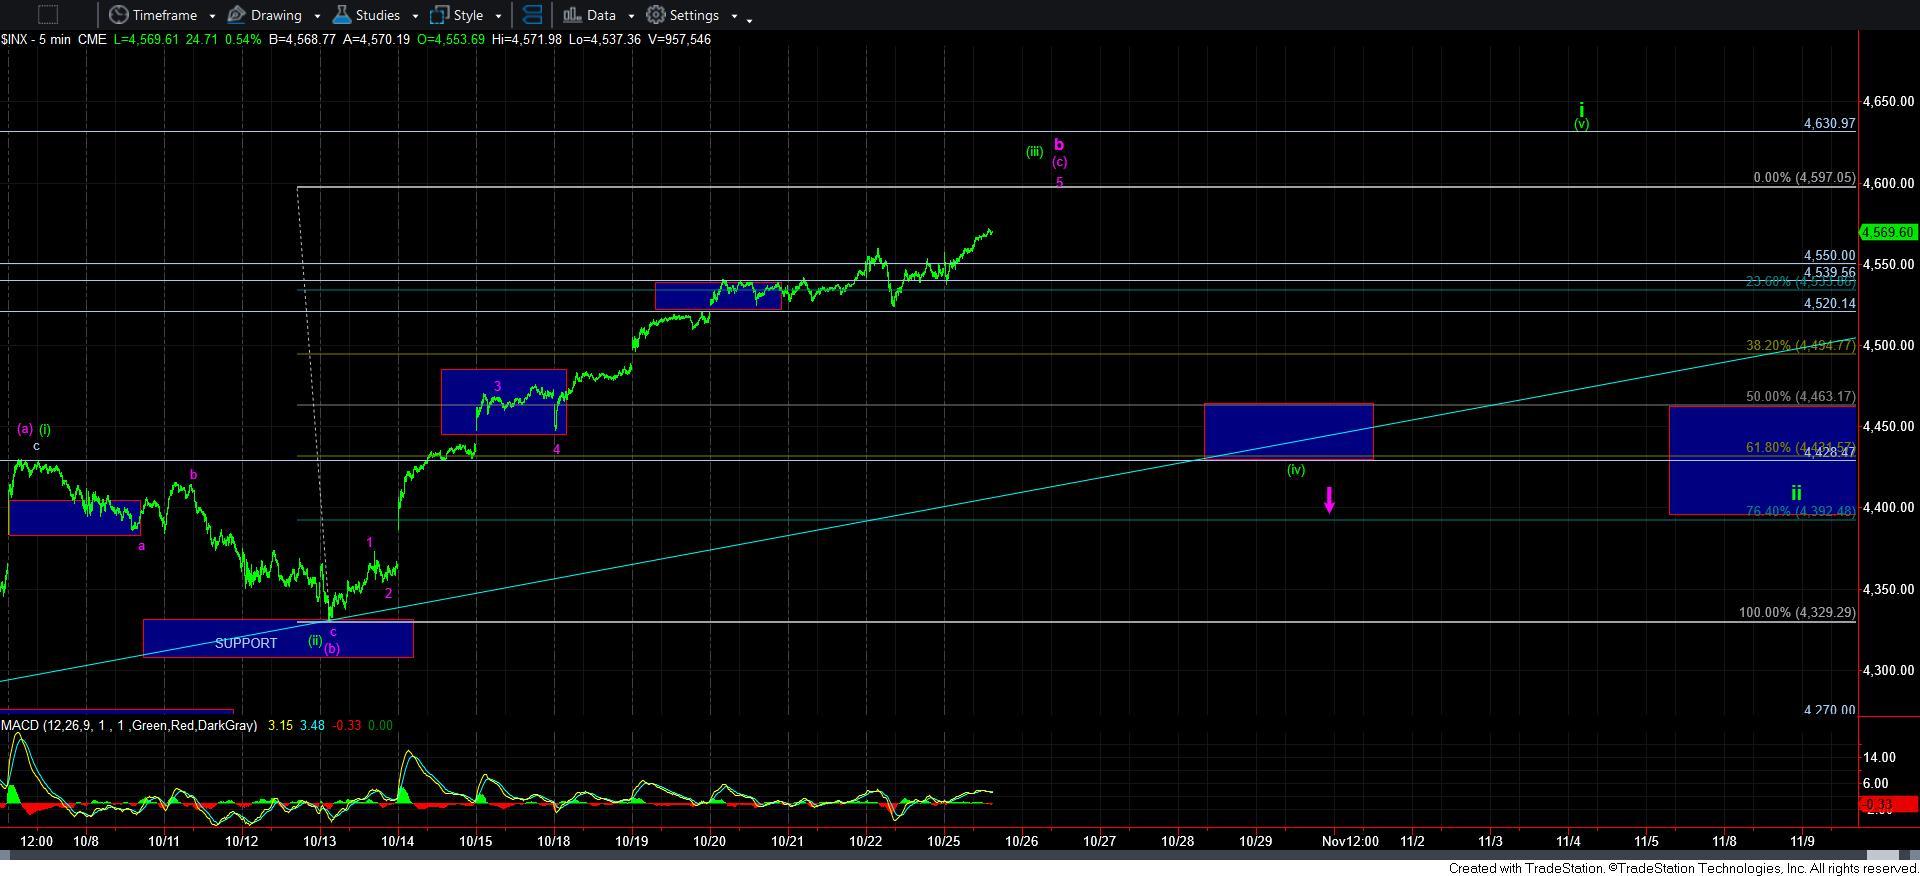
When I count this 5-wave rally off the lows within the c-wave, it is clear that we are rather full when it comes to the wave count. I really do not have more subdivisions that I can confidently suggest can push us much higher at this time. This 5-wave sequence off Friday’s low should complete this structure off the mid-October low, and provide a near term top for us. So, as the title suggests, the pattern for the wave [iii] or b-wave is now quite full. (I think Zac would be proud of me for using that title).
I think it is absolutely reasonable to expect to see a pullback once this last micro 5-wave structure completes over the coming day or so. And, as I have been saying, the nature of the next decline should determine whether we will see a c-wave down, or if the next decline is a corrective wave [iv]. As I said in the weekend update, the higher this goes, and the closer we get to 4608SPX, the more confluence is being presented for the b-wave potential. But, the nature of the decline is still going to be controlling the manner in which I view the probabilities between the purple or green paths.
In fact, Luke Miller, our Bayesian analyst, who has been having an outstanding year in 2021, has calculated the probabilities between the two potentials as just about even percentage-wise. So, based upon both our analysis, I cannot say that one has a huge probabilistic advantage over the other. Again, the structure of the decline will likely be the deciding factor.
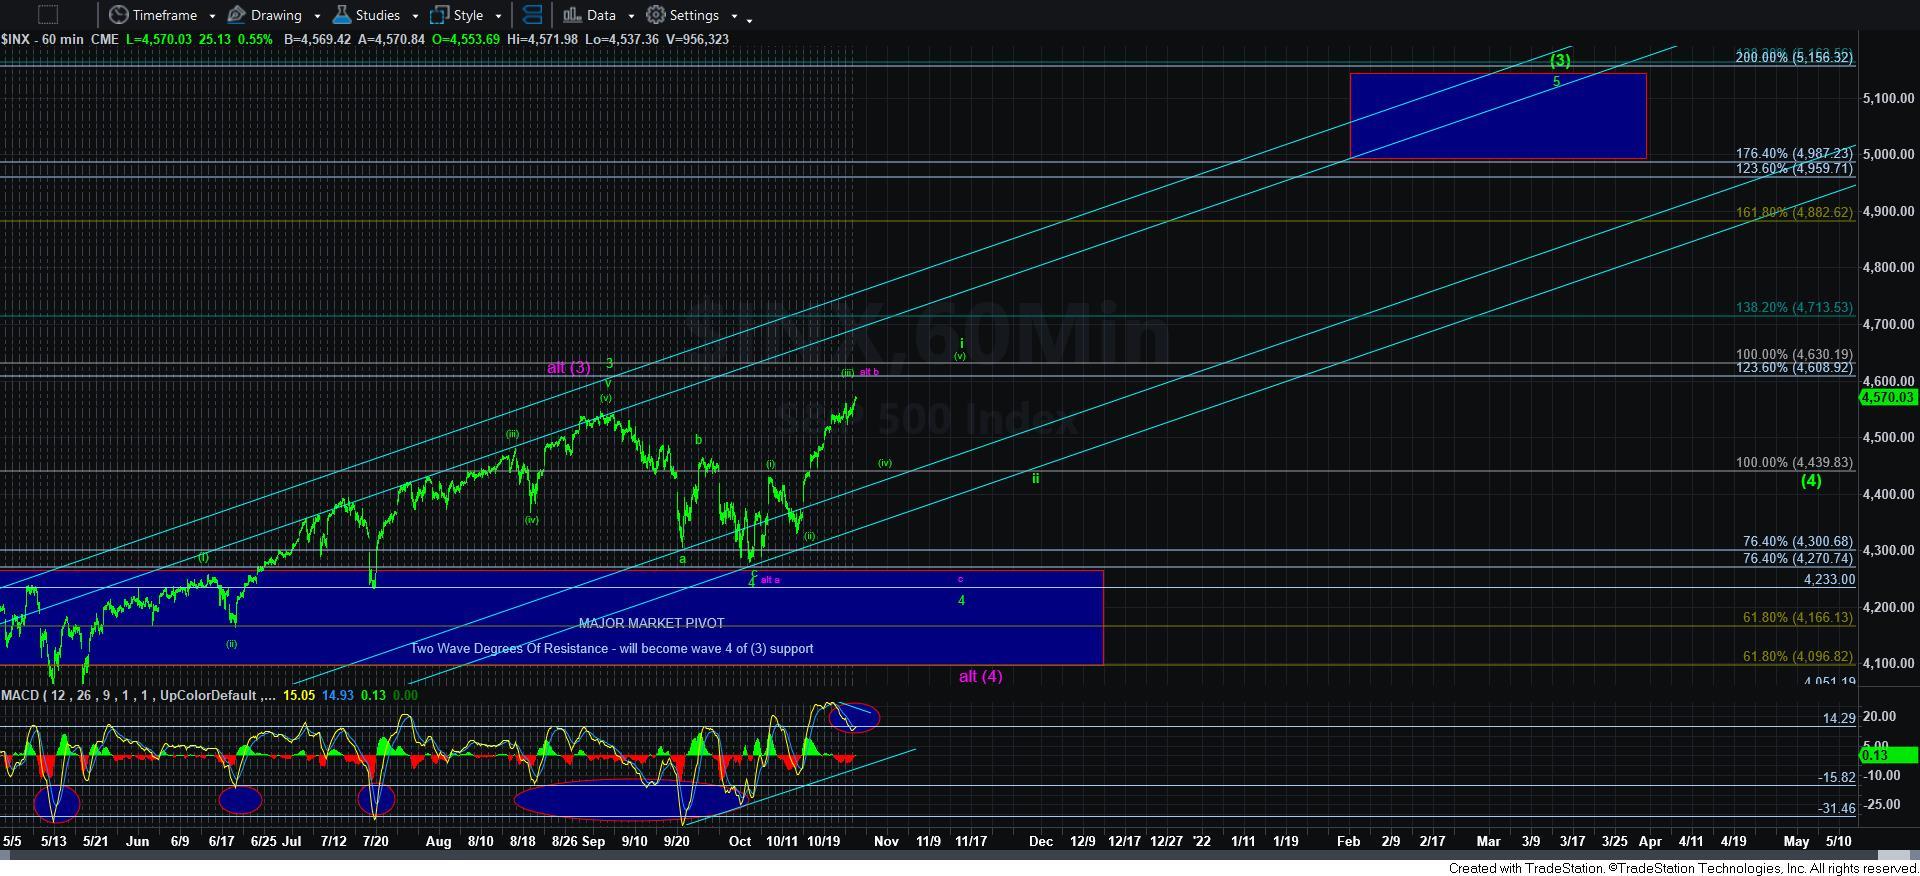
I do want to point out that if the market does complete all 5 waves up in green, it has opened the upside targets in the next rally. You see, wave [3] within wave [iii] off the March 2020 low has an ideal target in the 1.236 region, but sometimes can extend as high as the 1.382 extension. The 4900SPX region was the 1.236 extension region that I have been targeting for some time. However, if we are to see a i-ii structure as outlined on the 60-minute SPX chart, then it projects a 2.00 extension which can attack the 1.382 extension of waves [i] and [ii], which is the 5165SPX region. So, if the market does provide us with a 5-wave structure in the coming weeks, then the wave ii retrace will likely be a wonderful last buying opportunity for a rally which can project us as high as 5165SPX from the 4400-4500SPX region as we look towards 2022.
For now, I am going to still attempt to maintain a modicum of patience before I decide where I want to deploy my remaining cash for the next major rally phase into 2022. And, based upon the general structure, it would seem to indicate that this buying opportunity may be seen into the Thanksgiving holiday time frame. And, I think that patience will likely be rewarded with a nice opportunity in either the purple c-wave of 4, or the wave ii pullback.