Getting Really Close - Market Analysis for Mar 6th, 2025
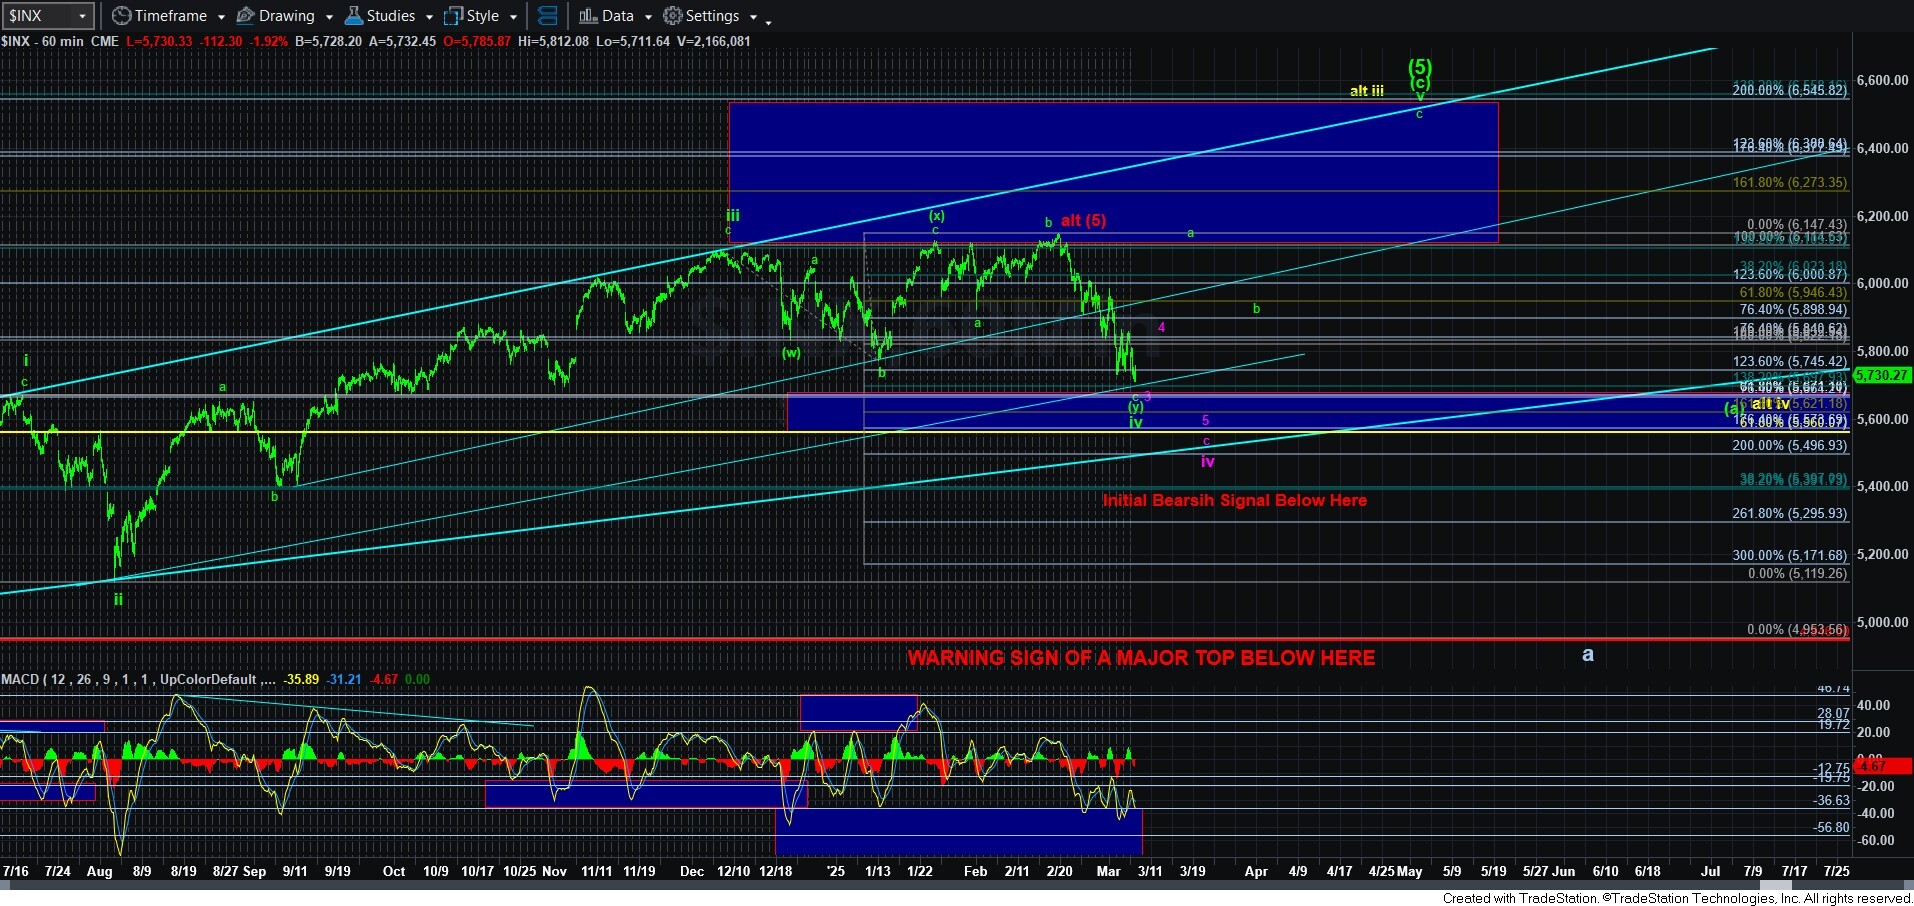
For the last 4 months, we have had our support in the market clearly delineated by the box on the 60-minute chart. For many months, I have been outlining how the 5560-5670SPX region was going to be important support for a potential wave iv pullback. And, as I write this update, we have now come within 40 points of that box.
Since I was out of the office yesterday, I recorded a live video for our full-time membership this morning, and I discussed this pullback in great detail. So, I strongly suggest you review that video for a bit more detail.
One of the reasons I was looking for a return to that region is that waves i and iv often overlap within an ending diagonal. And, since I am viewing this pullback as a wave iv within an ending diagonal, and wave i topped at just below 5670SPX, I thought it would be a reasonable expectation for the market to take us back down to that region.
Moreover, at this point in time, the divergences on the 60-minute MACD are trying to hold as well, which tells us to be on our toes for a potential bottom in this decline, especially as we get closer to that support region.
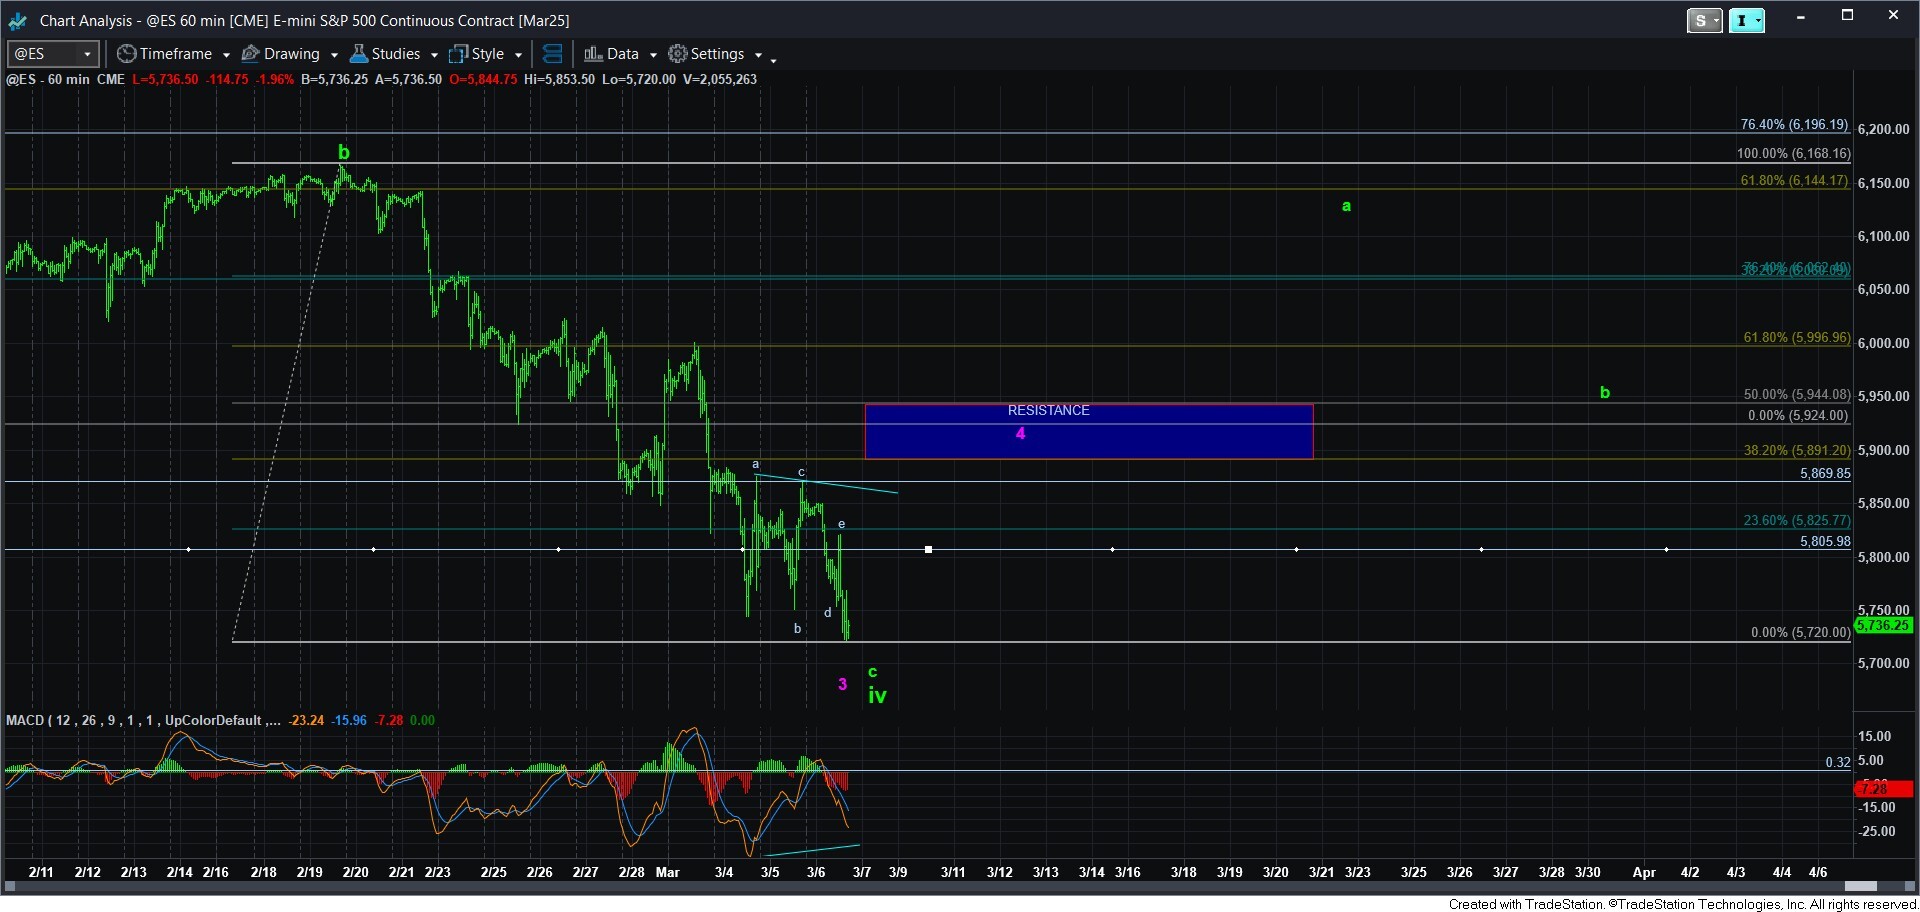
The one problem that I am having with this decline is that it has begun to overlap so considerably over the last week that it has clouded the wave count that we had been tracking into these lows. At this point in time, I can consider us completing all of wave iv, but I am still going to maintain the purple count on the chart for the potential that we can see one more 4-5 before this c-wave completes.
To this end, I have included a very liberal resistance region on the 60-minute ES chart for wave 4. Now, to be honest, I would likely view a move into the box (beyond the .382 retracement at the bottom of the box) as an initial signal that wave iv has potentially completed. But, I am going to be a bit more cautious about it, which is why the resistance box is quite liberal.
Moving beyond that resistance box will have me viewing us as being in the a-wave of wave v, with an expectation that we can rally back towards the 6100SPX region.
Now, as I have outlined many times before, we are likely coming to the conclusion of a VERY long term bull market. So, there is significantly greater risk in maintaining an expectation for that final rally to the 6300-6500SPX region for wave v. But, due to the fact that I do not have evidence that this large diagonal has completed, and for a number of the other reasons I have outlined many times before and in the live video today, I am still going to maintain the higher high as my primary expectation. But, I also outlined in the video what would change that expectation, so again, please review that video.
I will be tracking the market very closely over the coming month or two just to make sure that it indeed has an intention on taking us to those higher highs. And, should I see anything inconsistent with the expectation of higher highs, I will be sure to alert you.
Currently, I am expecting a bottoming in the market as long as support holds, and I will be seeking confirmation that the a-wave of wave v has begun once we move through the resistance box on the 60-minute SPX chart. Unfortunately, as I also explained in prior updates, since the next rally would be an a-wave in the bullish scenario, it will likely take shape as a 3-wave event. That makes it much harder to distinguish between the start of the a-wave and the next rally being a wave 4 in purple. So, that is why I will need to see us move through the resistance box to make the a-wave scenario much more likely.