Getting More Complex Than I Wanted
I want to start by noting that I do not think it to be reasonable to assume that the market can rally appreciably higher being as stretched as we are right now. So, even though the market “feels” like it will not come back down, we have to remember that trees do not grow to the sky.
However, as we broke down below the pivot yesterday, and today we have come back up towards the highs, it has now made our job much more complex. Let me explain.
I have been tracking two potential counts. And, I said that if we see an impulsive break of support, then I will move into the purple count as my primary. But, if the pullback is corrective, then the green count takes the lead.
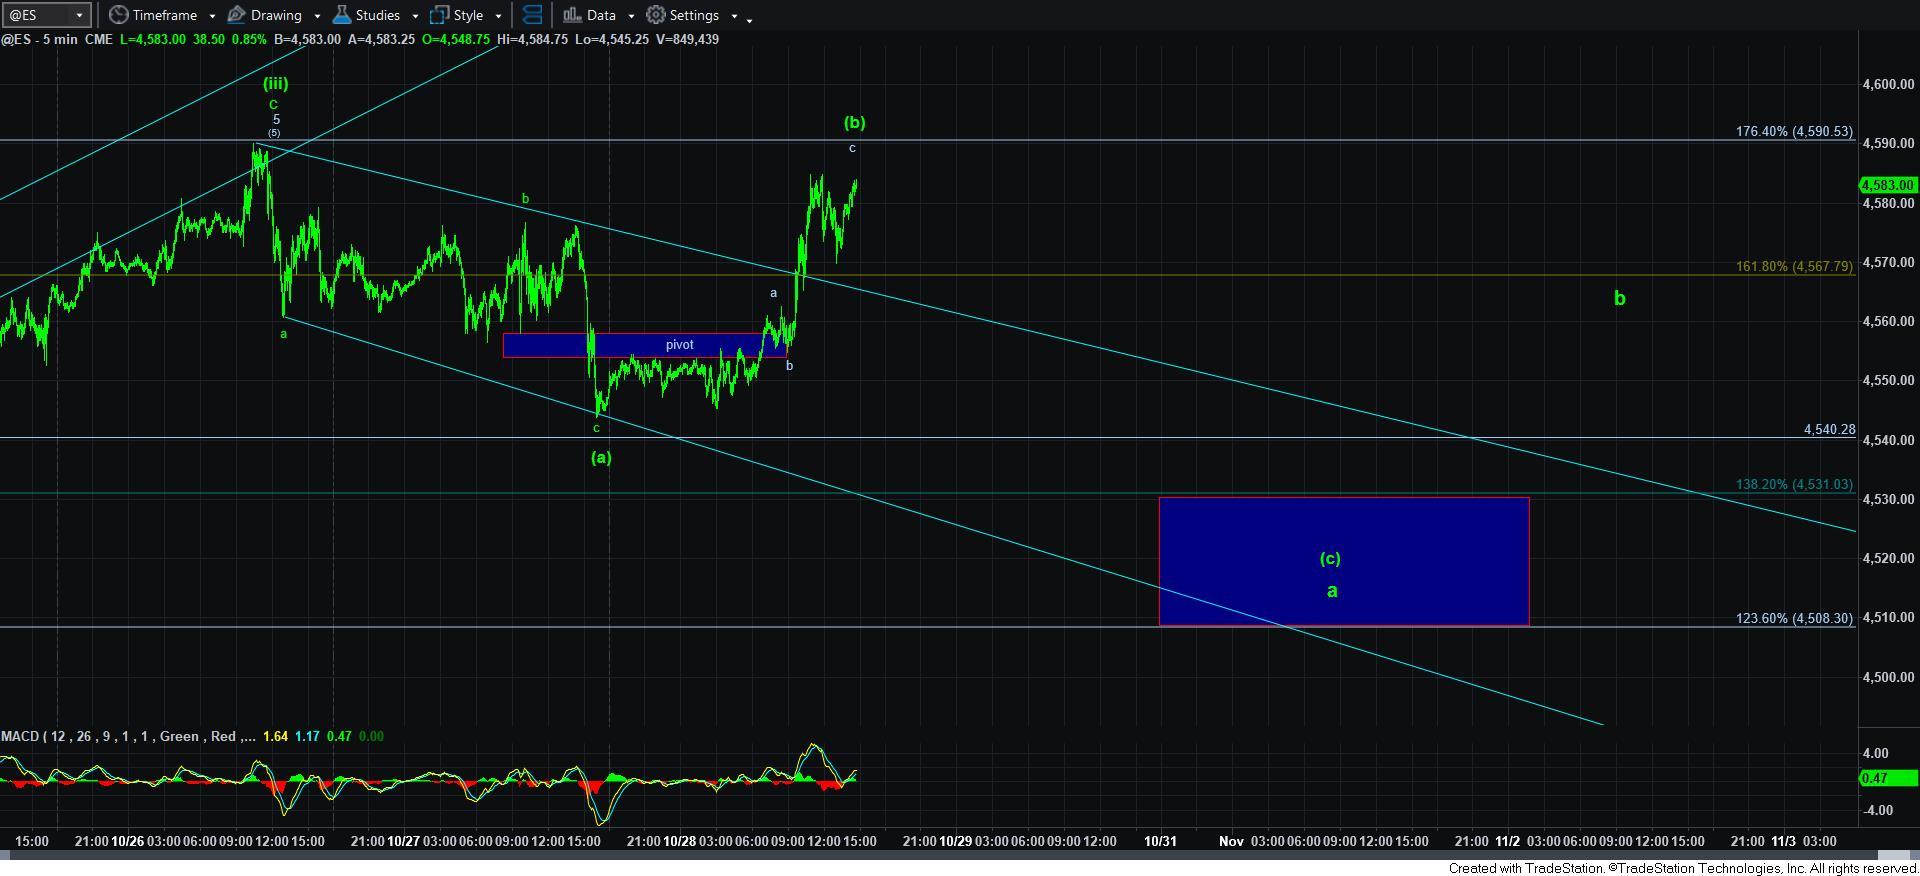
The decline we experienced yesterday was a clear corrective decline. So, if the green wave [iii] has topped, then the decline was an [a] wave of the start of wave [iv]. That means that today’s rally is a [b] wave, even though we have come back up towards the high. Clearly, we are well beyond the standard retracement for a [b] wave, and that is why this becomes more complex.
When we look at the ES chart, I can still call this a 3-wave rally completing an a-b-c structure for the green [b] wave, which I have outlined on the 5-minute ES chart.
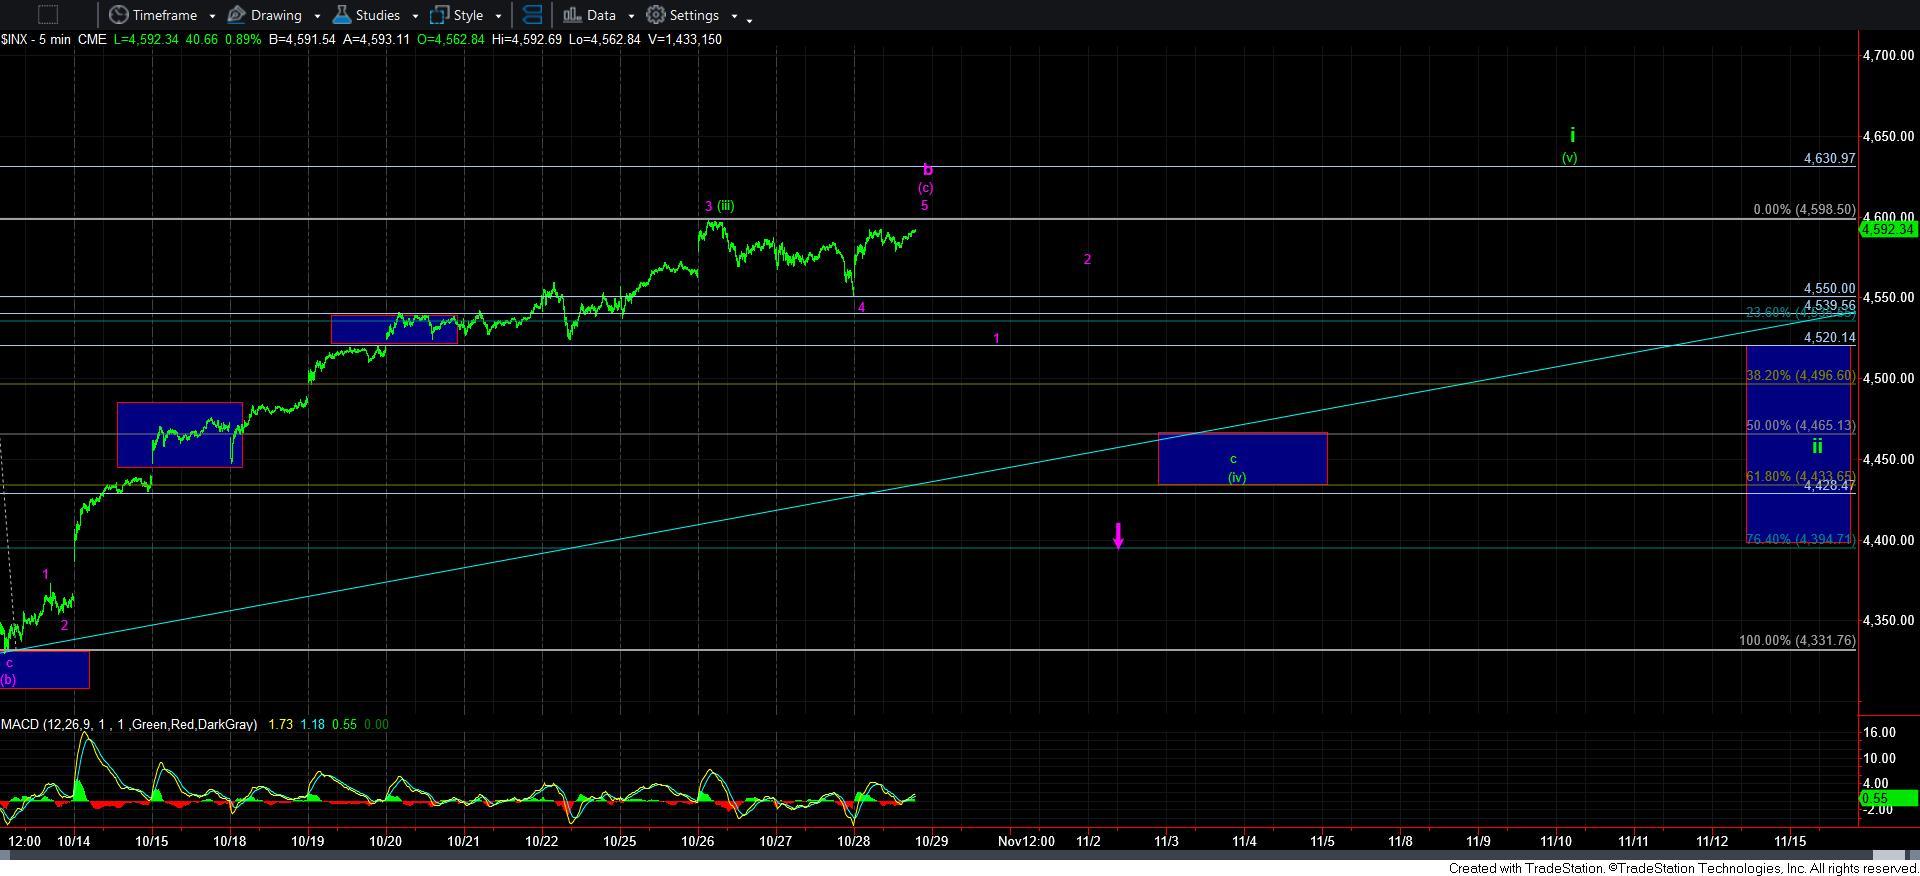
However, when we look over at the SPX 5-minute chart, we can view this rally as a 5-wave structure, suggesting that we can still be topping in the purple b-wave count.
Here is the kicker. If we top this afternoon and see no higher highs, then the next decline can be a 5-wave decline as either a c-wave in the green count, or it can be wave 1 down in the purple c-wave. And, both will likely then see a corrective bounce when that decline completes, and then see a further decline thereafter. But, the extent of that decline is going to clue us in on the difference between the two counts.
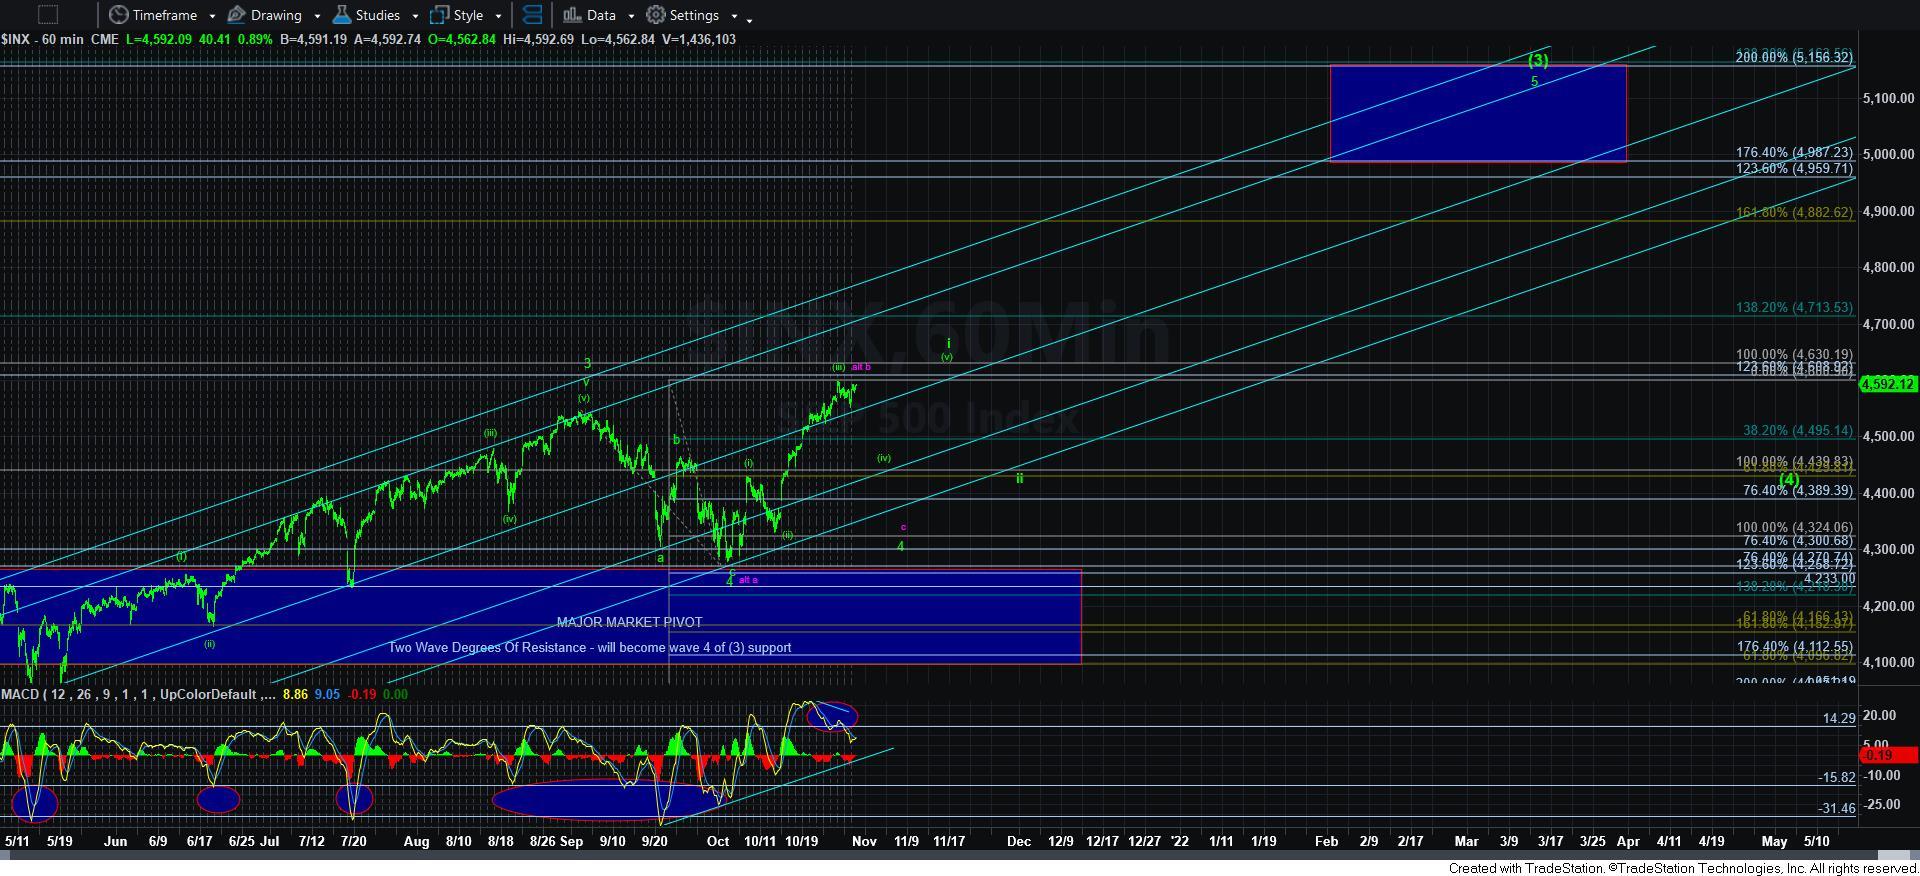
I warned you that this can get more complex, and it certainly has potential to do so. For now, I am still looking for a reasonable pullback. But, if we top this afternoon, both patterns I am tracking suggest that the pullback can be impulsive under both scenarios I am forced to track again. But, the more important point is that is simply do not see a path to 4900+ unless we see a bigger pullback back into the 4400-4500SPX region.