Getting More Complex - Market Analysis for Feb 8th, 2022
I am putting out this update a little earlier than normal so you can track the potentials I am watching as the market moves through these progressions.
Unfortunately, during corrective structures, we take many different twists and turns, a lot of which is not able to be prognosticated, simply because of the nature of corrective structures. And, this is why I have continually been warning of a whipsaw environment. Yet, it is tremendously helpful to know you are in this type of environment, so that you can avoid being cut many times trying to trade something that you believe will react otherwise.
Moreover, Frost & Prechter have warned us about times like these that do happen every now and then, and most often within corrective structures:
“Of course, there are often times when, despite a rigorous analysis, there is no clearly preferred interpretation. At such times, you must wait until the count resolves itself. When after a while the apparent jumble gets into a clearer picture, the probability that a turning point is at hand can suddenly and excitingly rise to nearly 100%.”
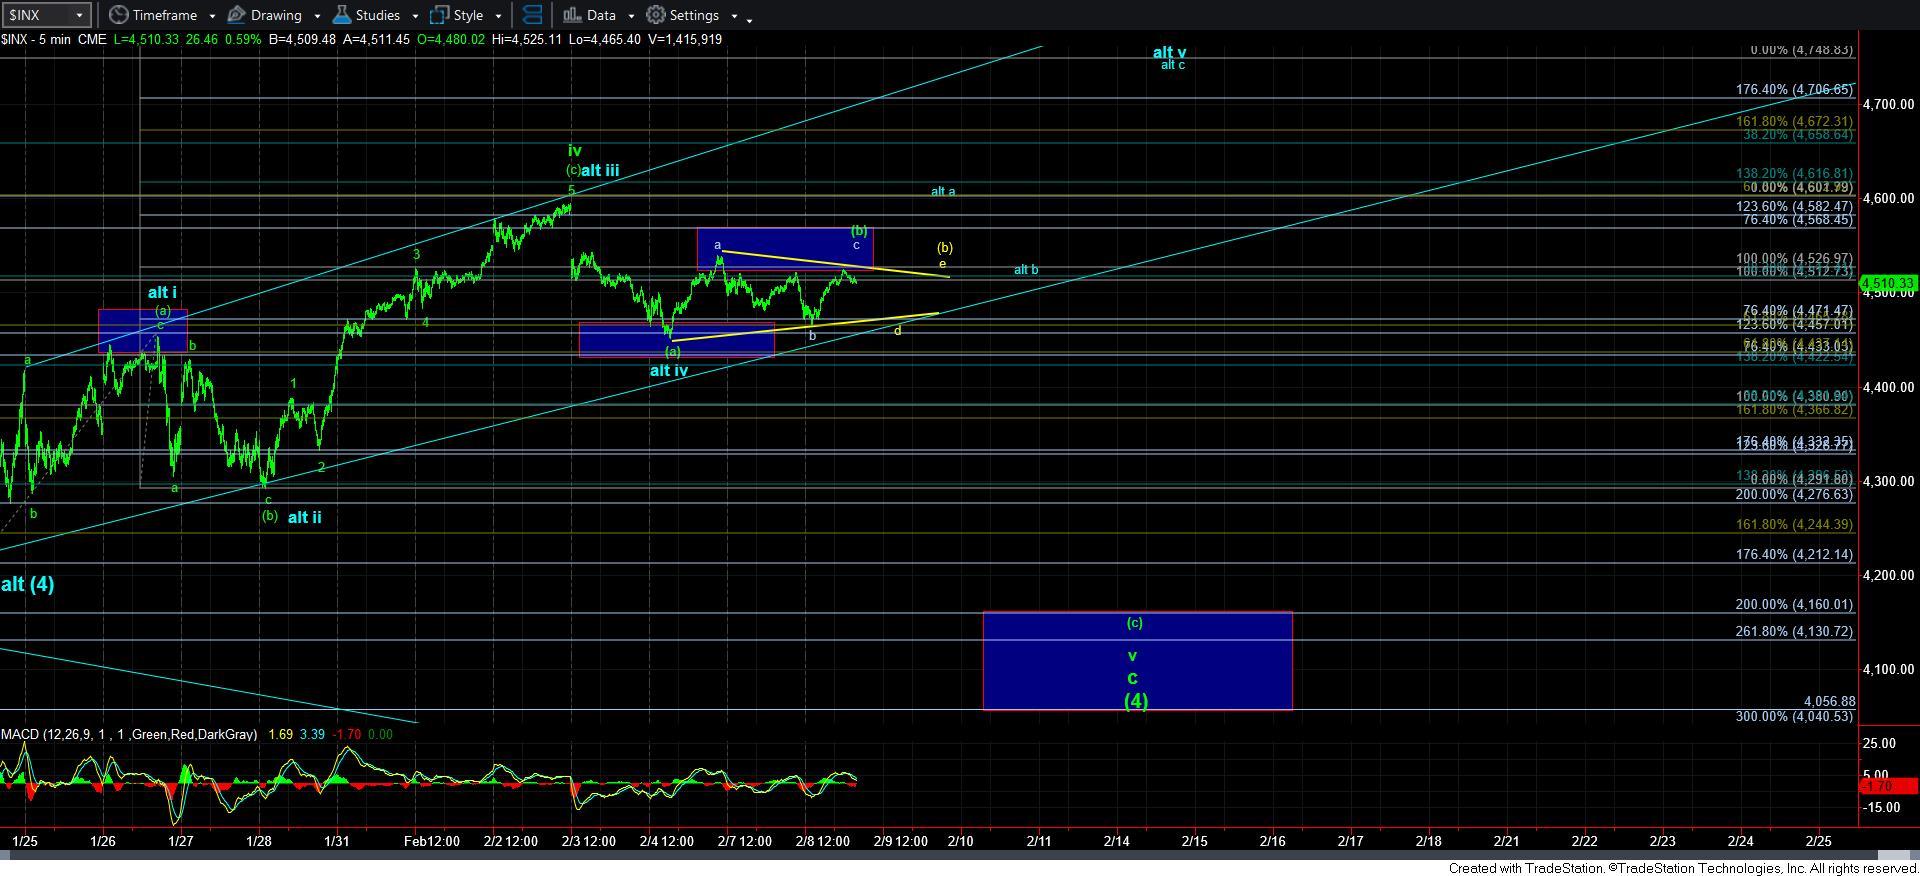
Yet, I can still view our preferred interpretation is going to be the green count, which still expects a resolution to the downside. And, I am going to drop the resistance on that potential to the 4535-50SPX region. But, it would mean the market has to head higher into the end of the day to complete the c-wave of the [b] wave in a more direct fashion today.
Thereafter, we MUST see a clear 5-wave decline, and that would then signal that the larger [c] wave down to lower lows is in progress, with confirmation coming in a follow through break down below Friday’s low.
However, as we know, these 3-wave corrective structures can still take many forms. Therefore, if we are unable to rally towards the 4535SPX region and, instead, we roll over, then I am going to be considering the yellow [b] wave triangle on the 5-minute SPX chart. This would suggest that we completed the b-wave of the triangle today, with waves c-d-e to come. It also means that we must remain below whatever high we create today to keep this triangle as a viable count. And, once completed, then we can begin the larger degree [c] wave to the downside. Clearly, this would extend the time this consolidation can take before the [c] wave down begins in earnest.
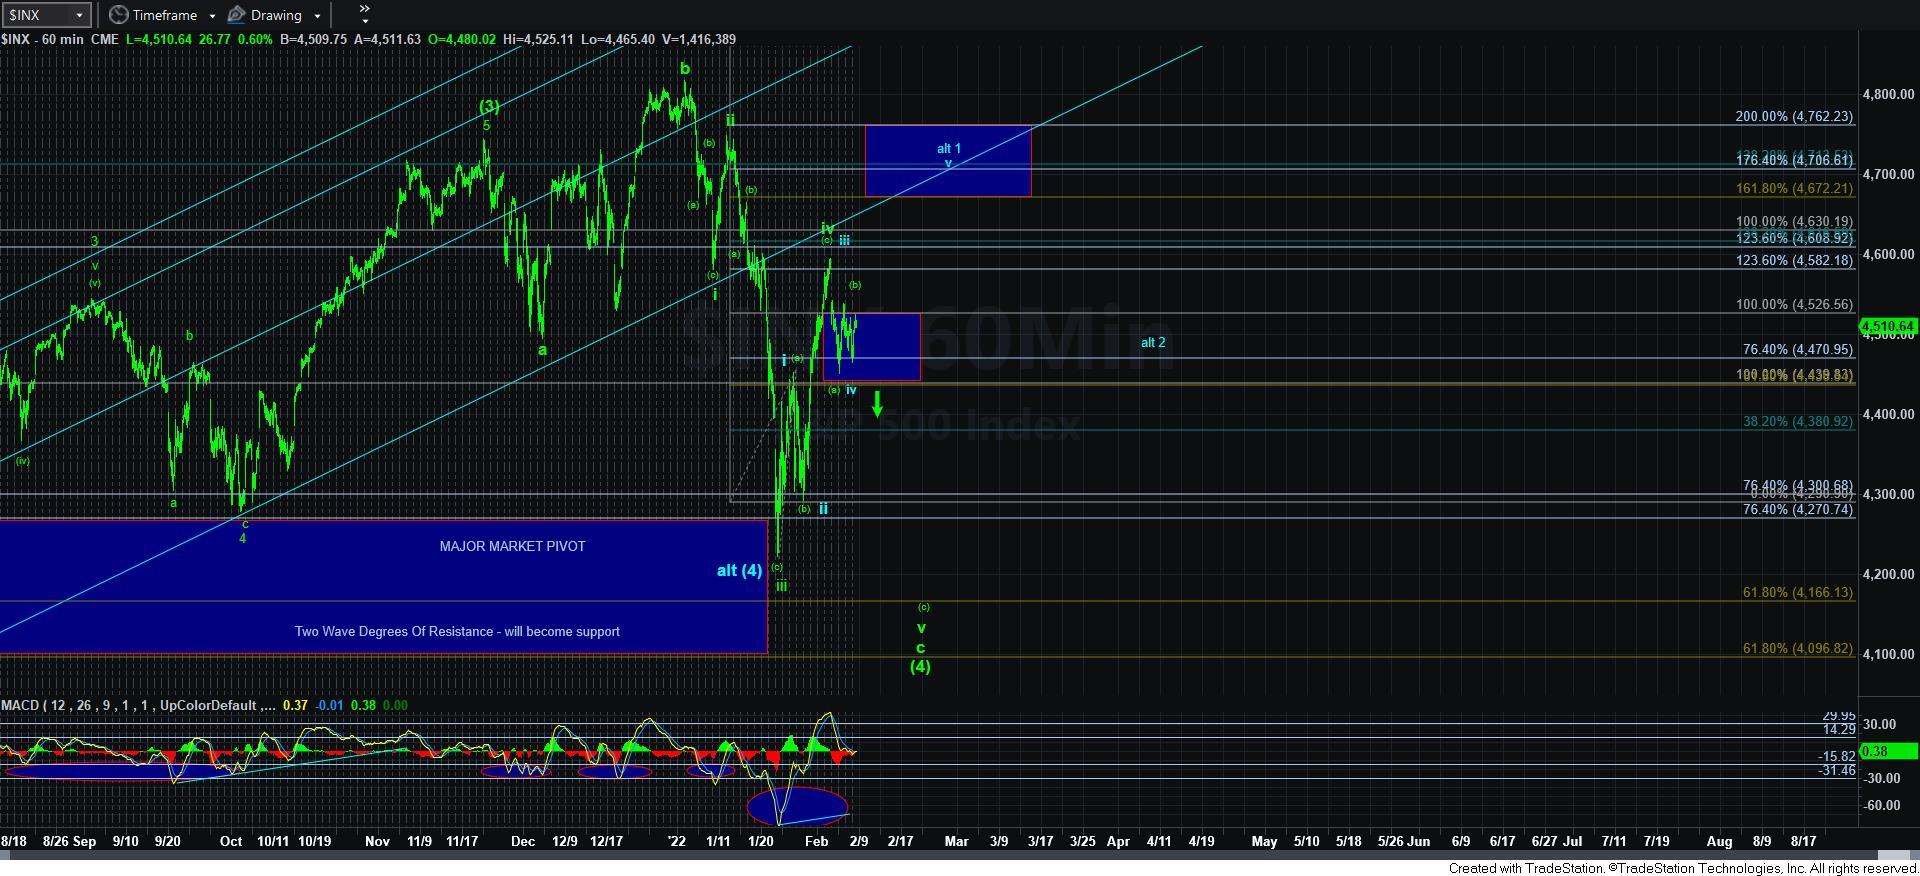
The other count I am going to be watching very carefully if we roll over is that this rally was wave 1 of the [c] wave in the blue a-wave, pointing us back up to the highs. I don’t have that on the chart right now, as I wanted to keep the chart relatively straight forward for now.
But, the main point is that the analysis will turn on whatever high we strike today, and remaining below that high, developing a 5-wave structure to the downside, and then breaking down below Friday’s low. If we fail to do so, and instead break back out over whatever high we create today later this week, then that opens the door in a big way to the blue count.
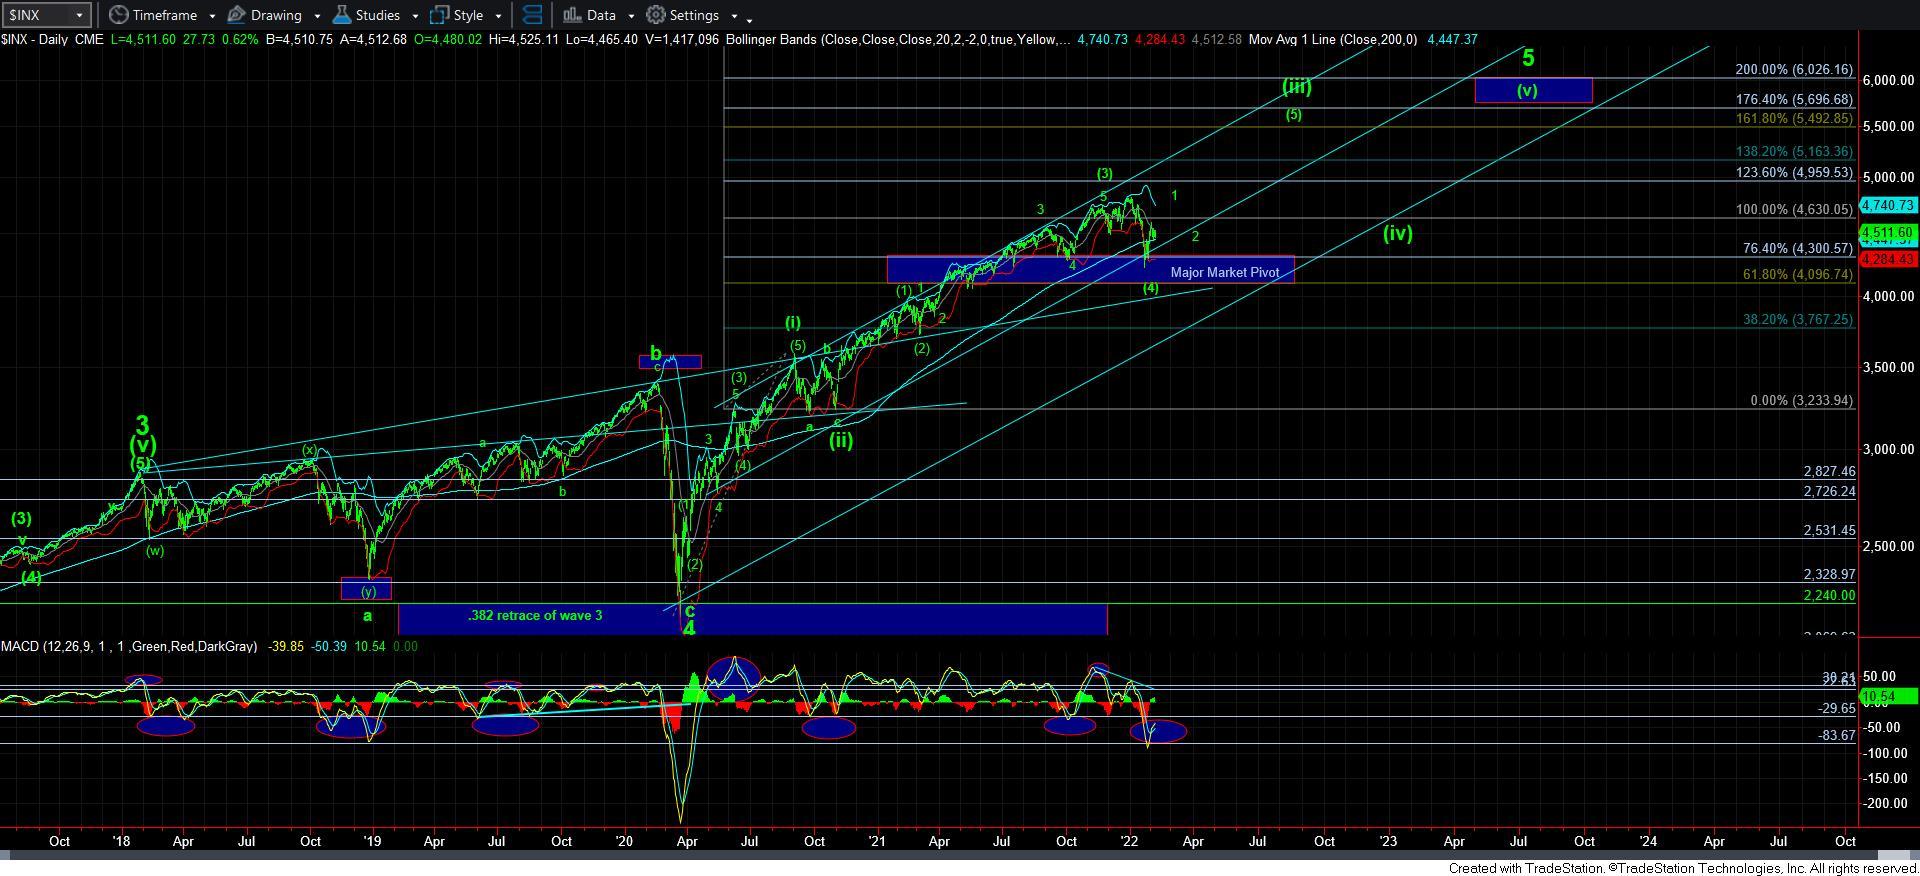
I know this is complex, but this type of market action is not meant to be easy. This is why I warned over and over to be wary of whipsaw, as the market made it quite cleat to us early on that this is what we would be seeing until we resolve this region. So, while I am unable to identify every single little twist and turn during this whipsaw, we have certainly caught most turns, and have been quite aware of the environment in which we currently reside. A decision should be forthcoming, which should then tell us where we can buy additional long positions for our expected rally to 5500 into the end of this year or the 1st quarter of 2023.