Getting Close - Market Analysis for Dec 19th, 2022
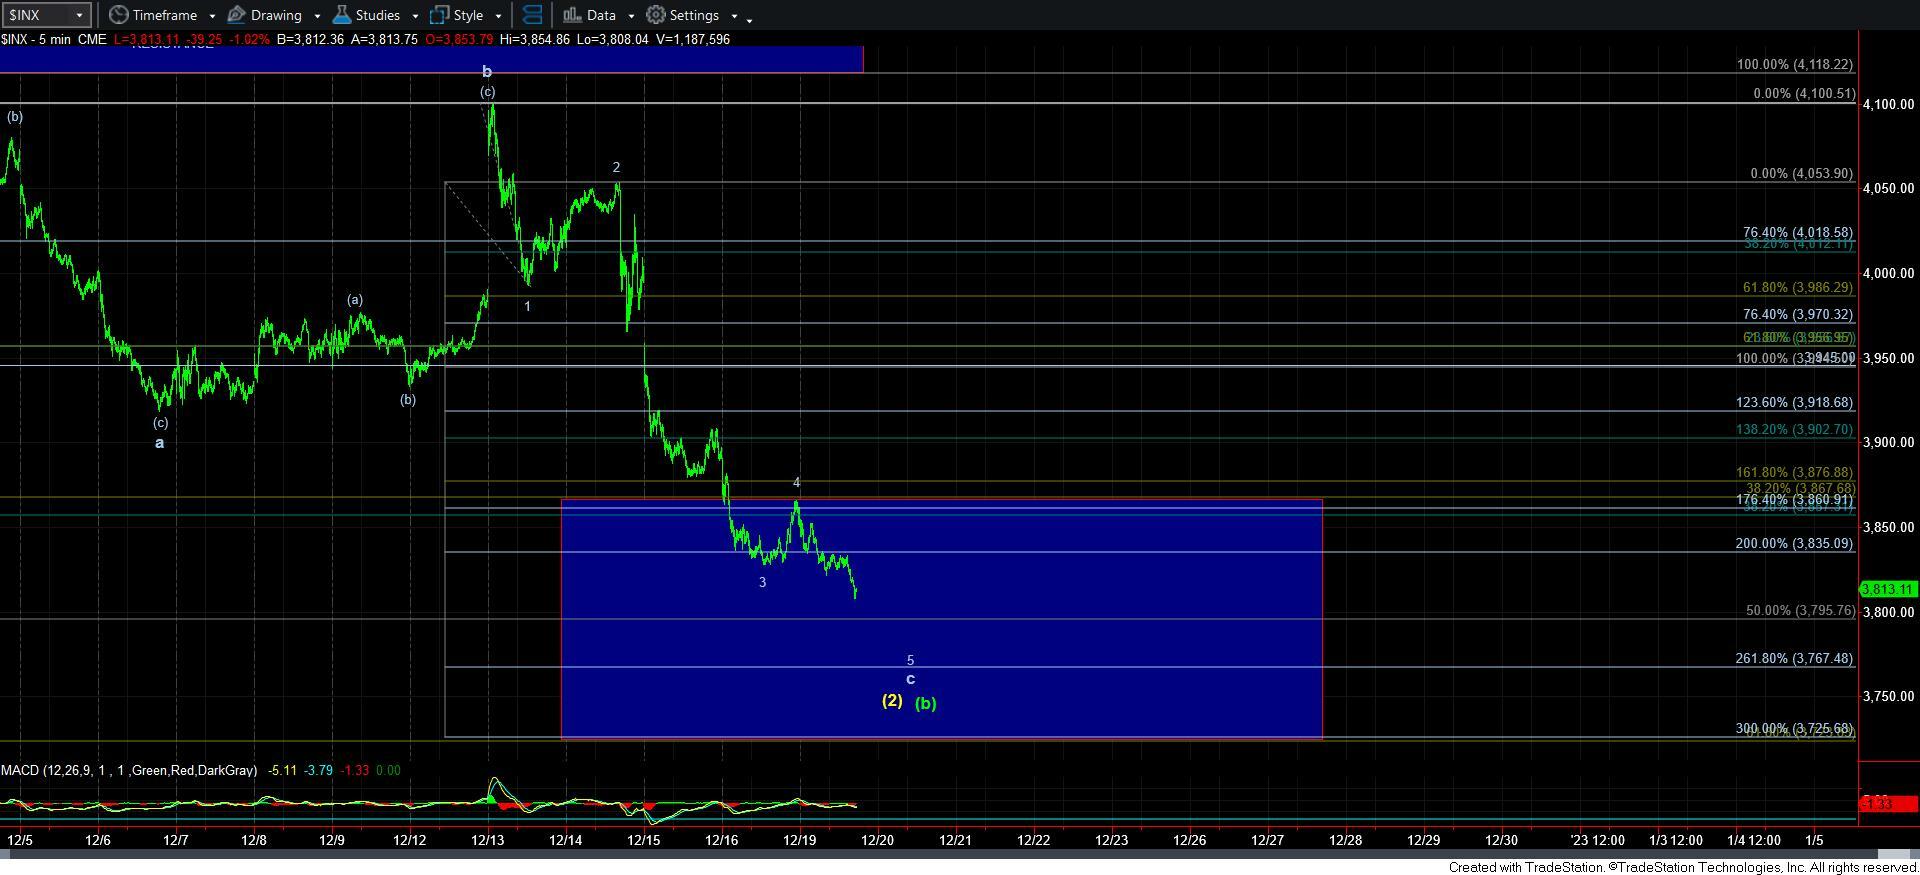
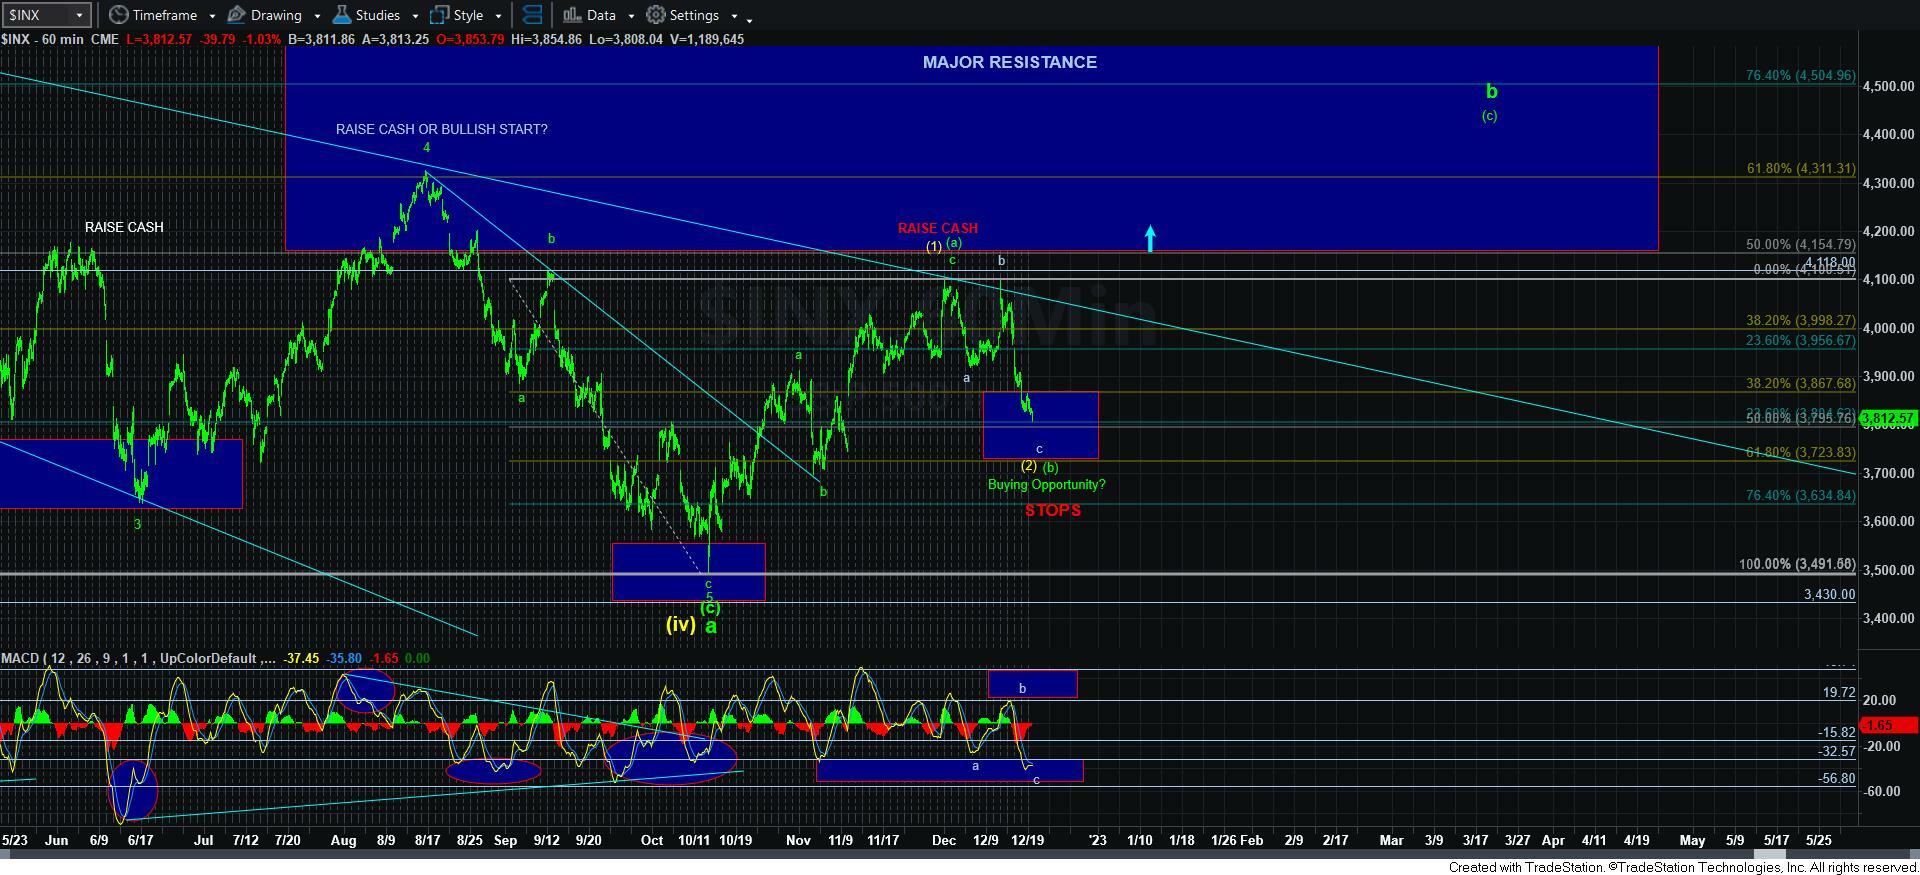
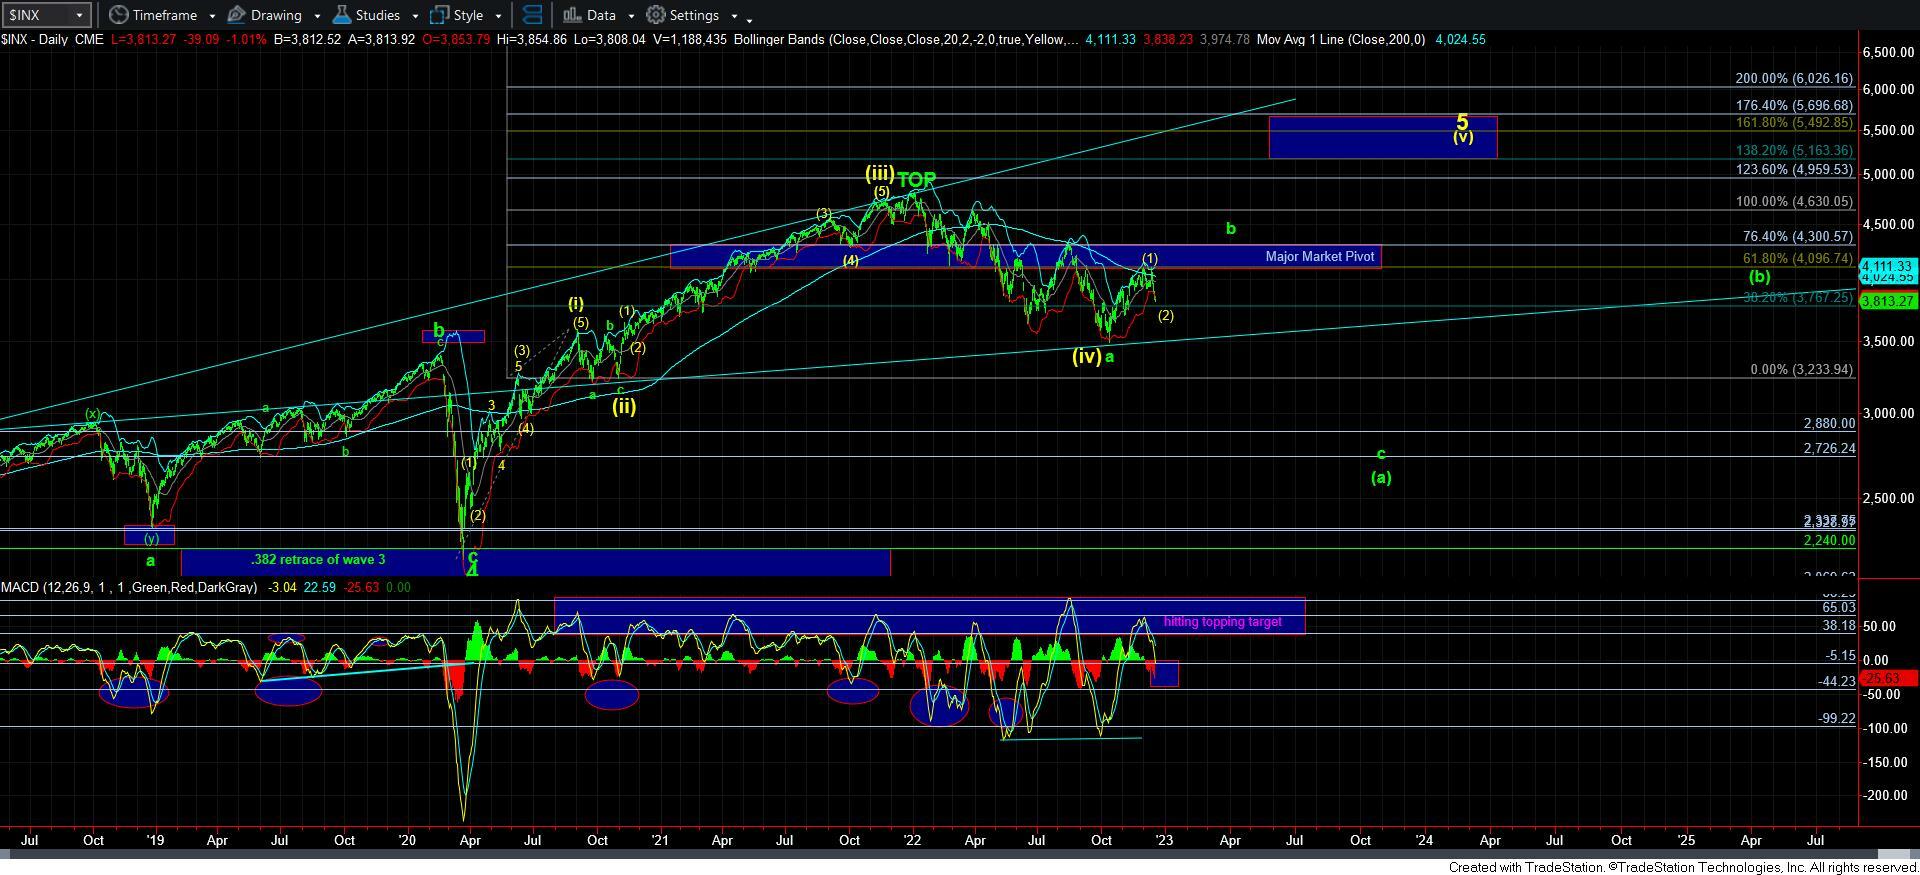
The MACD on the daily chart is now striking the minimum target we set weeks ago which would re-set that indicator to support another rally higher. Moreover, there is even arguably a positive divergence on these lower lows now being struck on the 60-minute MACD, which is somewhat faint, and not the ideal structure I had wanted to see. But, there is enough of an argument to view this as a full 5-waves down for the c-wave, which is the ALTERNATIVE count I have now placed on the 5-minute SPX chart.
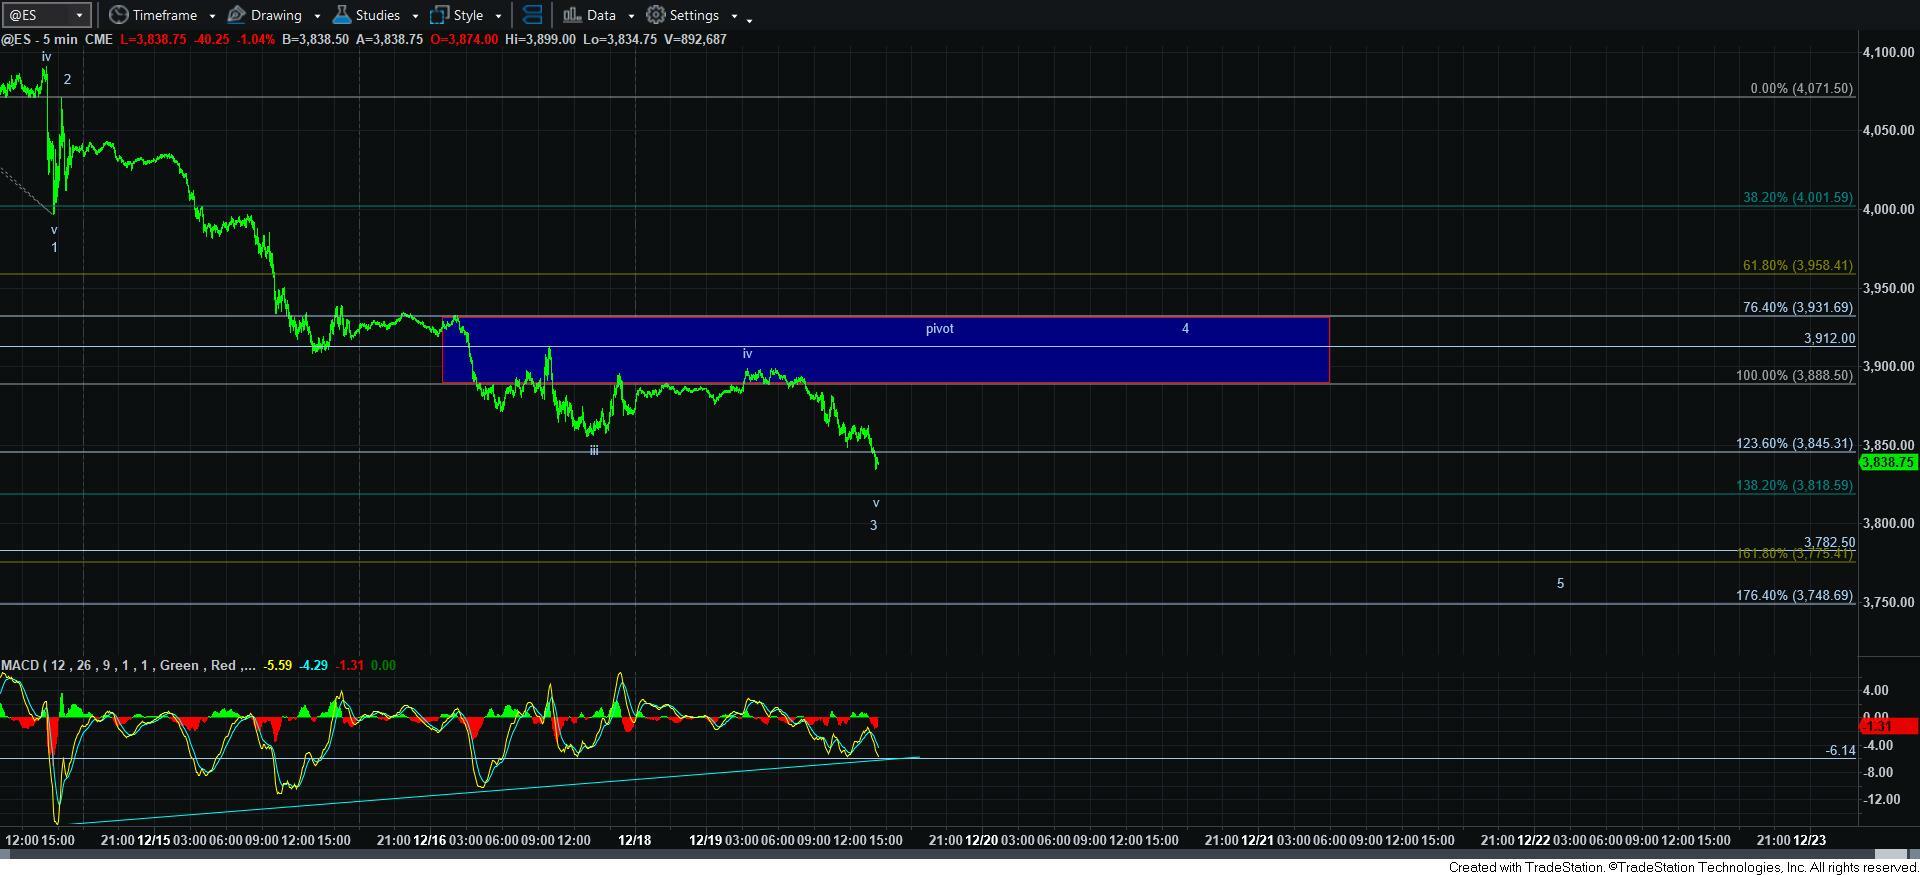
In the meantime, the primary count remains as shown on the 5-minute ES chart. We have broken down below the 1.236 extension of waves 1-2 in the c-wave in this wave count, and I can view this as completing wave v of 3 at this time. Therefore, I have accordingly dropped the pivot on the 5-minute ES chart. That is now our resistance. Should we see a move back through that resistance, then I will have to consider that this decline has potentially completed.
As far as positioning is concerned, I noted in the trading room that I have begun to add initial positions on the long side. We are within 100 points of the bottom of our support box, and we are within 5% of our stop out point on the SPX chart. That is the maximum risk I am willing to accept at this time on a long attempt in this region.
The next time we move over the high struck on Friday will either indicate that wave 4 is in progress, or, alternatively, the bottom has been struck. My main expectation remains for the 4-5 to be seen. But, due to the potentially small positive divergence seen on the 60-minute chart as I write this as we are striking lower lows in price forces me to consider that alternative at this time.