Further Downside Still Likely
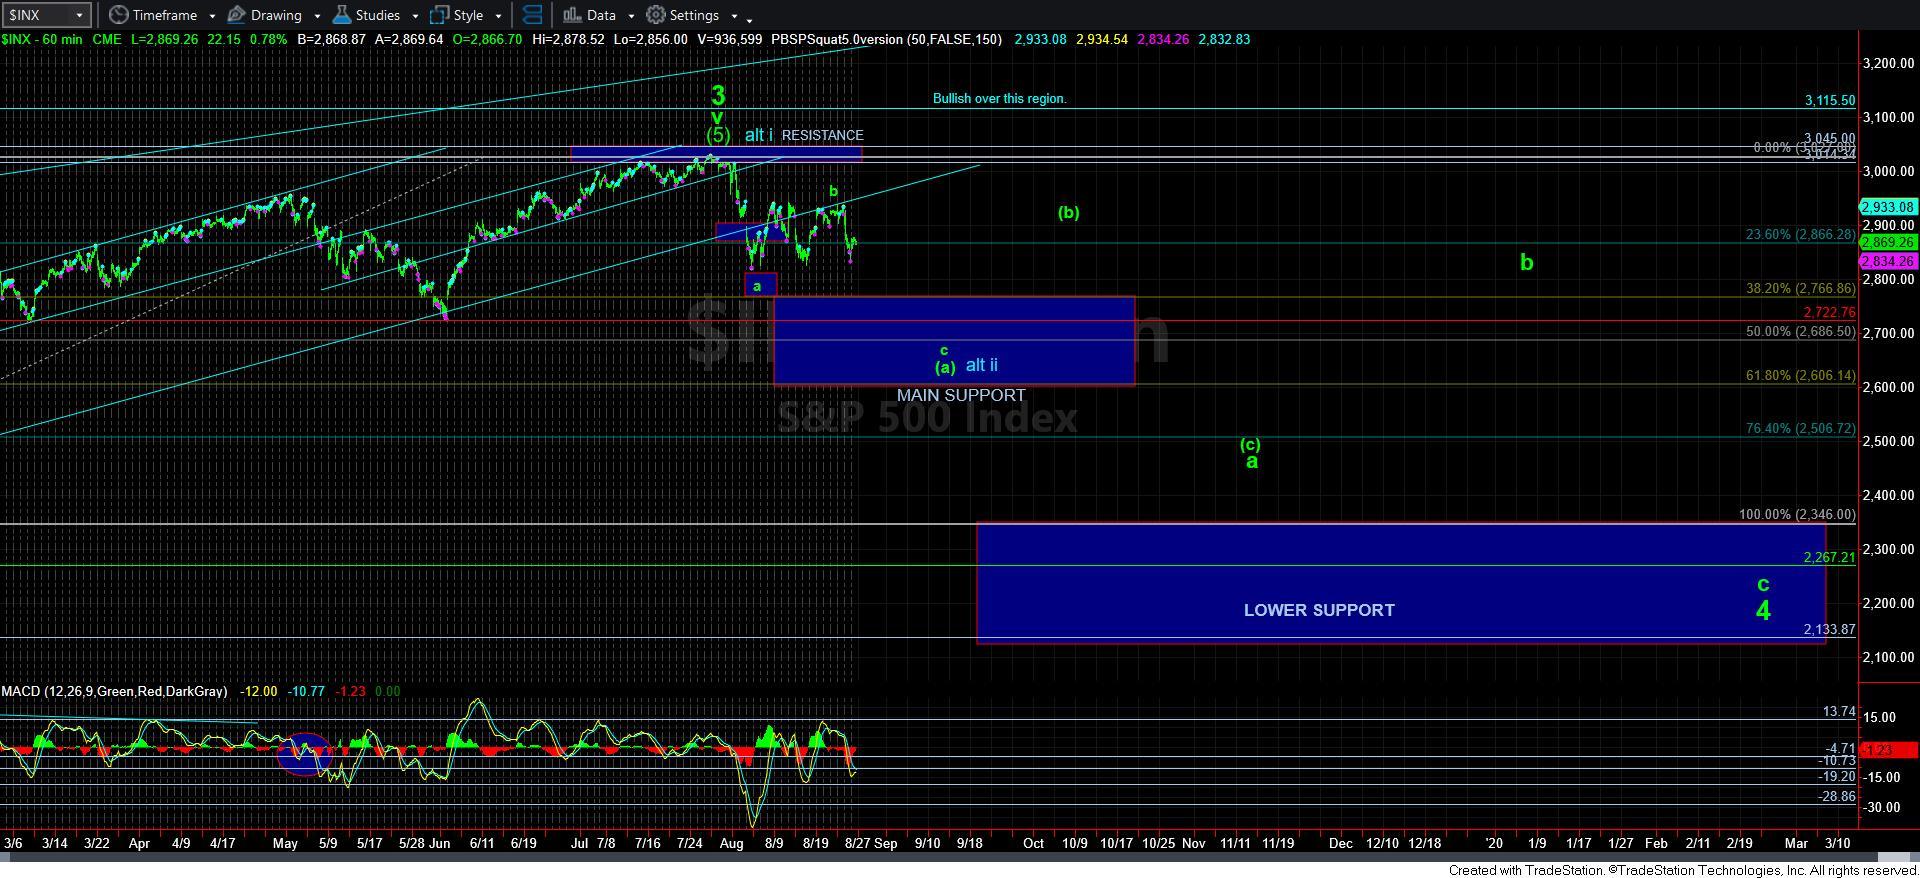
Before I go into the detail of the analysis, I want everyone to remain focused on one main point: As long as the market remains below the high struck last week, we must respect the bearish potential until such time it is able to exceed last week’s high.
With that said, I have to begin this analysis noting that we have a divergence in patterns again between the futures (ES) and the SPX.
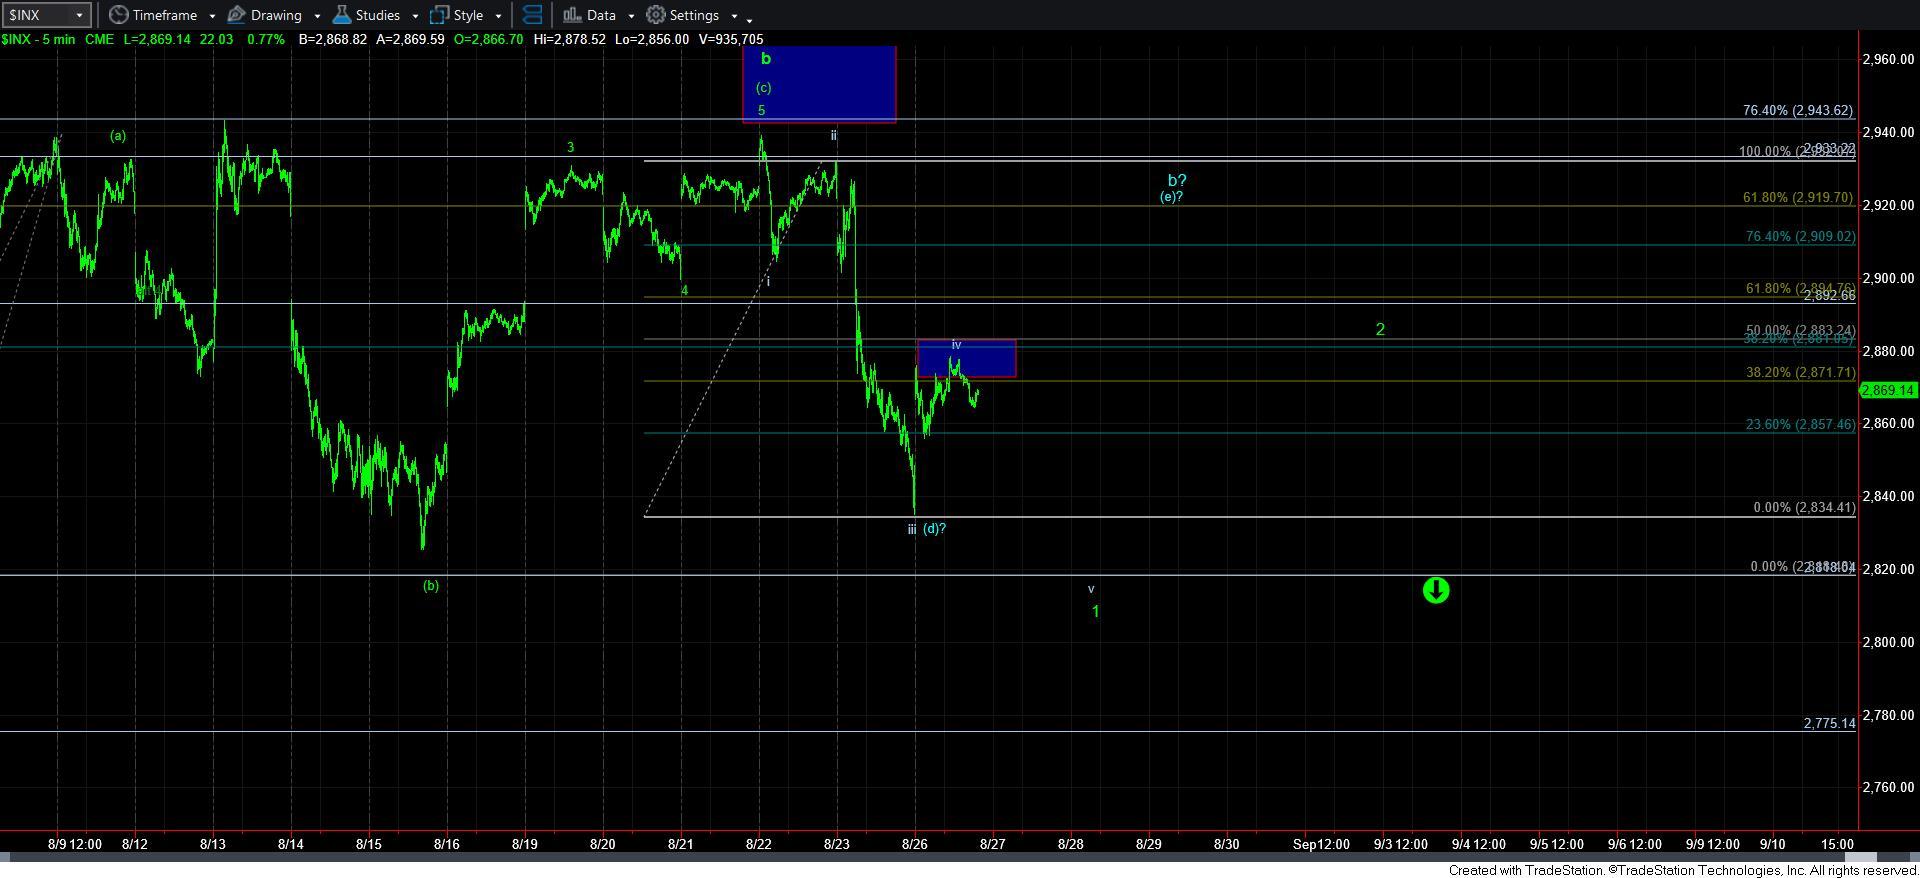
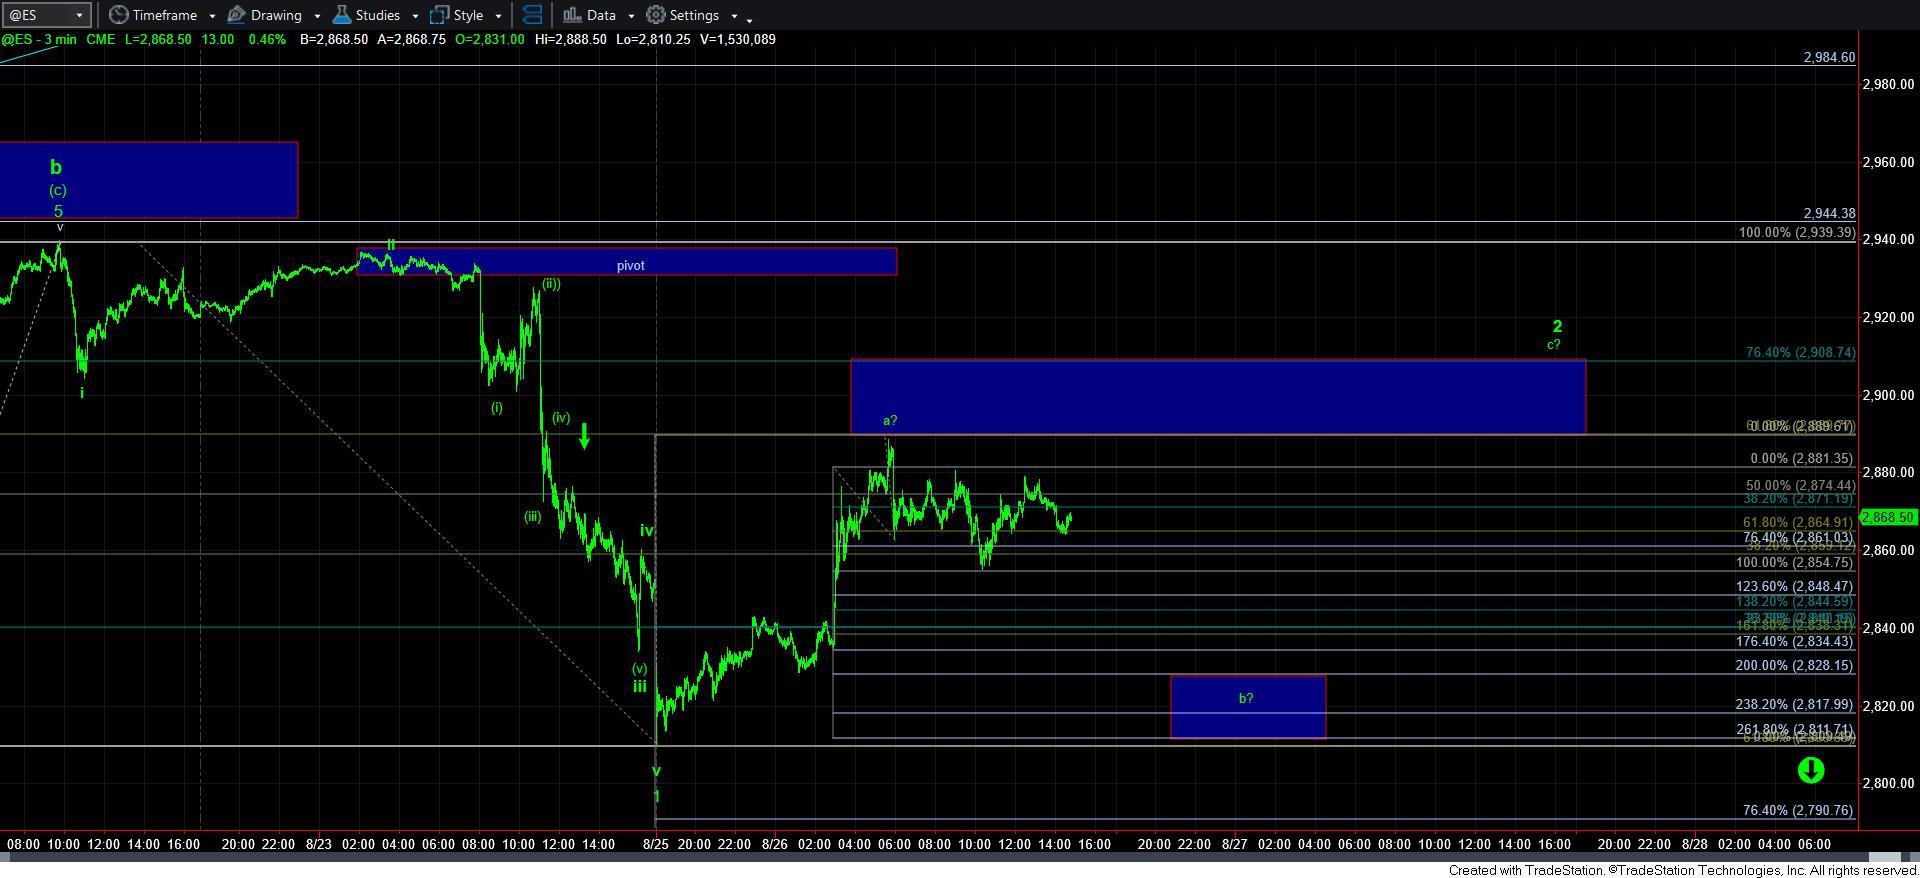
With the futures dropping to lower lows overnight on Sunday night, it has seemingly completed 5 waves down off last week’s high. However, we really only have a confident 3 waves down in the SPX thus far. And, my standing rule is "cash is king," so I will almost always give primacy to the cash SPX index.
Today’s gap up took the SPX right into the target we had for a 4th wave bounce, as you can see on the 5-minute SPX chart. However, as of my writing this update, I do not have a micro 5-waves down yet to suggest we have begun a 5th wave lower.
The question now becomes how do these two patterns between the ES and SPX align? Well, I offered a hypothesis this morning. A drop down to the target box on the ES chart would provide us with a lower low in SPX, but it would count best as a b-wave of wave 2 in the ES, especially if it would drop in an overlapping manner such as in a diagonal. Then we would see a rally back up towards the 2900-10ES region for a c-wave of wave 2. That would then align the two charts, as least for me.
The other potential remains that the market is going to trace out the triangle for the b-wave I mentioned over the weekend.
But, I am going to stress that as long as we remain below last week’s high, I still have to view this pattern with bearish glasses. It would take a break out over last week’s high to invalidate that immediate potential. So, until such time, I am going to give the bears the benefit of the doubt.