From Support To Resistance In Three Days
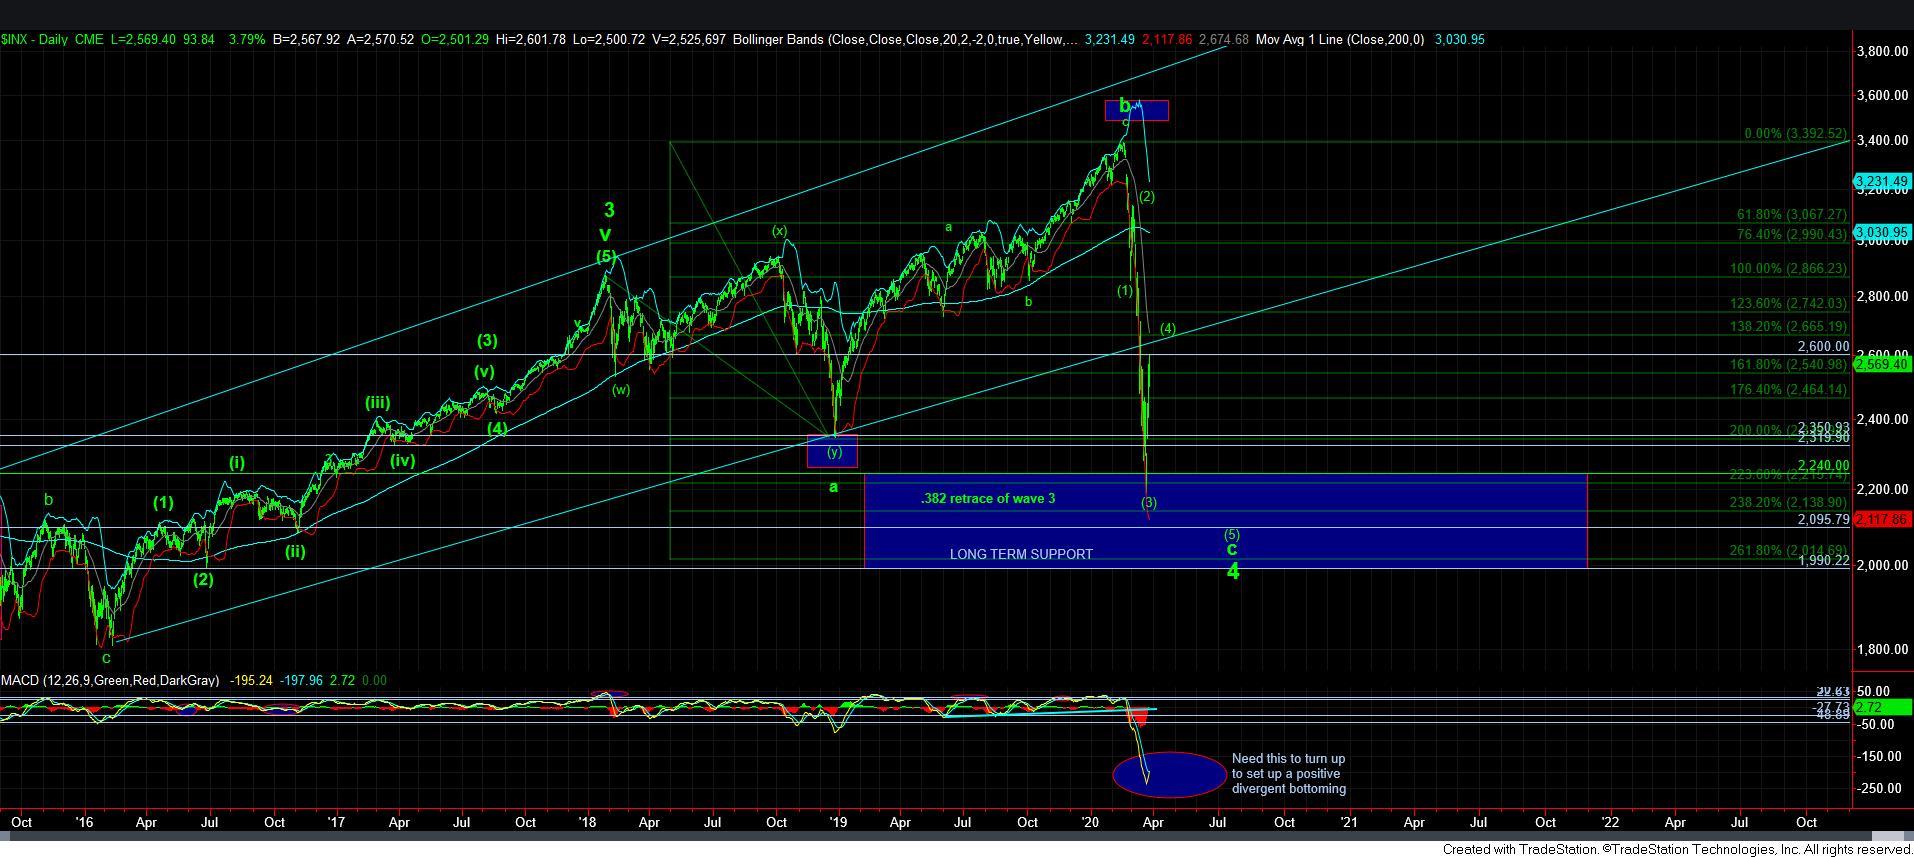
Again, I find this market simply amazing. Just a few days ago we were down at the depths of wave [3], and three days later, we have struck our minimum target for wave [4] . . . which was over 400 points higher. Just amazing.
And, as I warned before, many are now turning very bullish with the expectation that the bottom has certainly been struck.
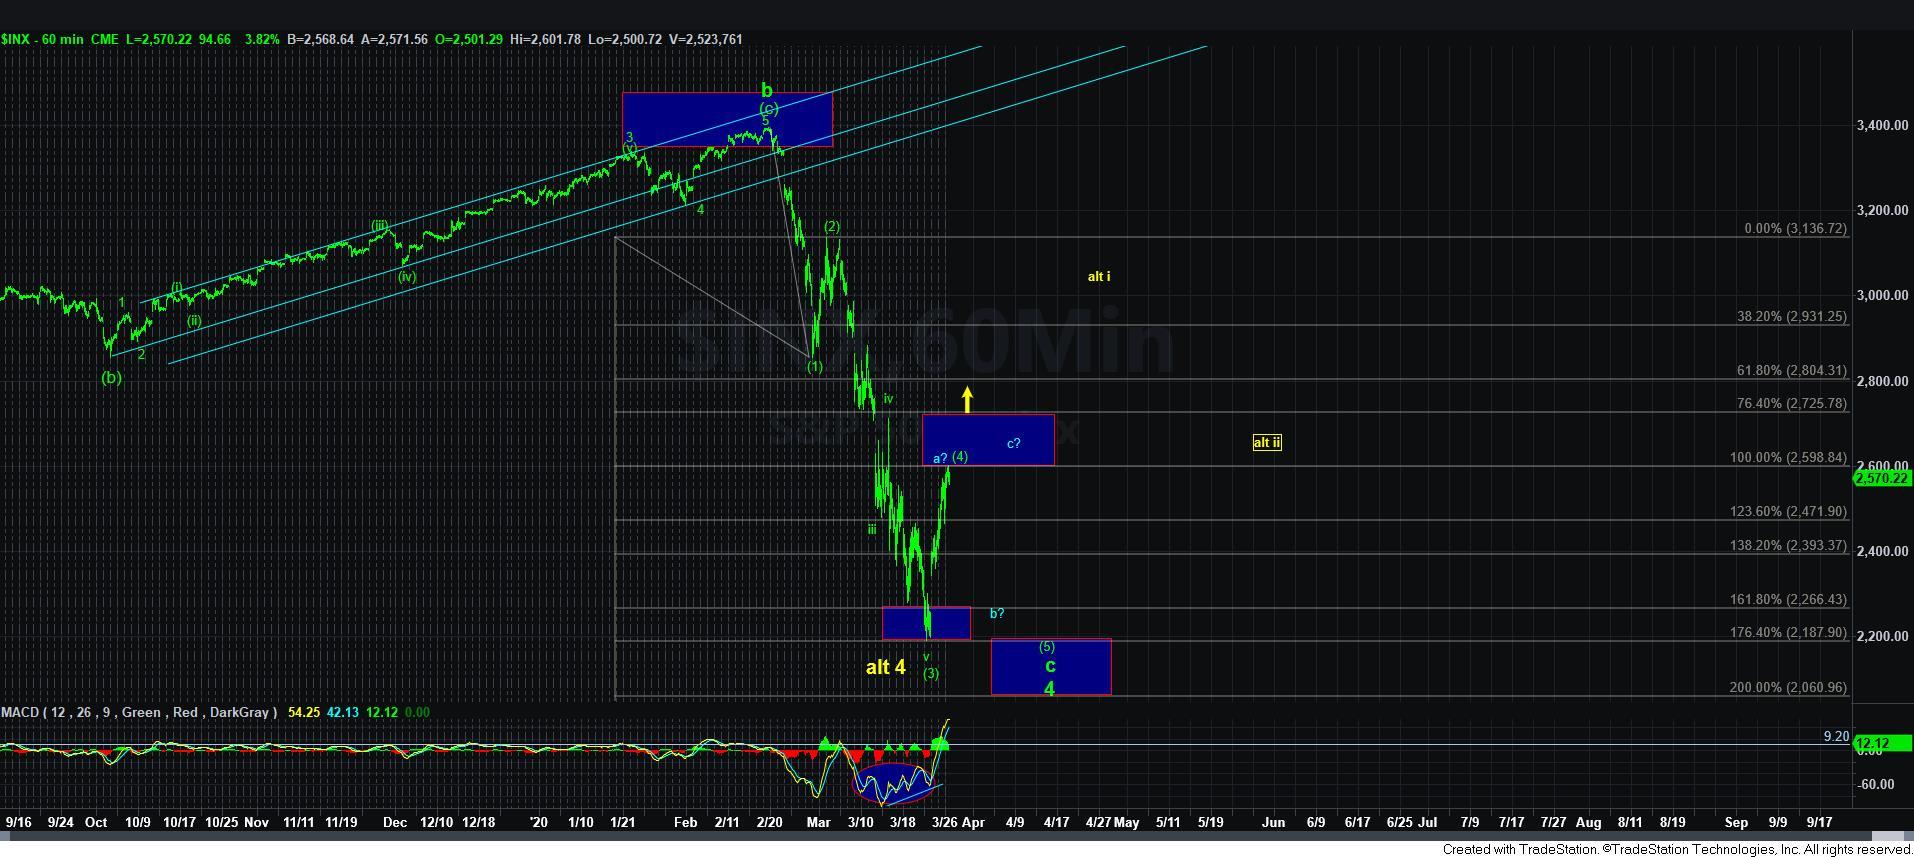
Now, as I have outlined many times before, and even noted as we were bottoming in the IWM, there is a strong likelihood that the IWM has bottomed, as it has enough waves in place and has extended far enough to the downside to consider all of wave 4 as completed. For that reason, I would not even be looking to the IWM for any short trades if you want to trade for a potential 5th wave lower.
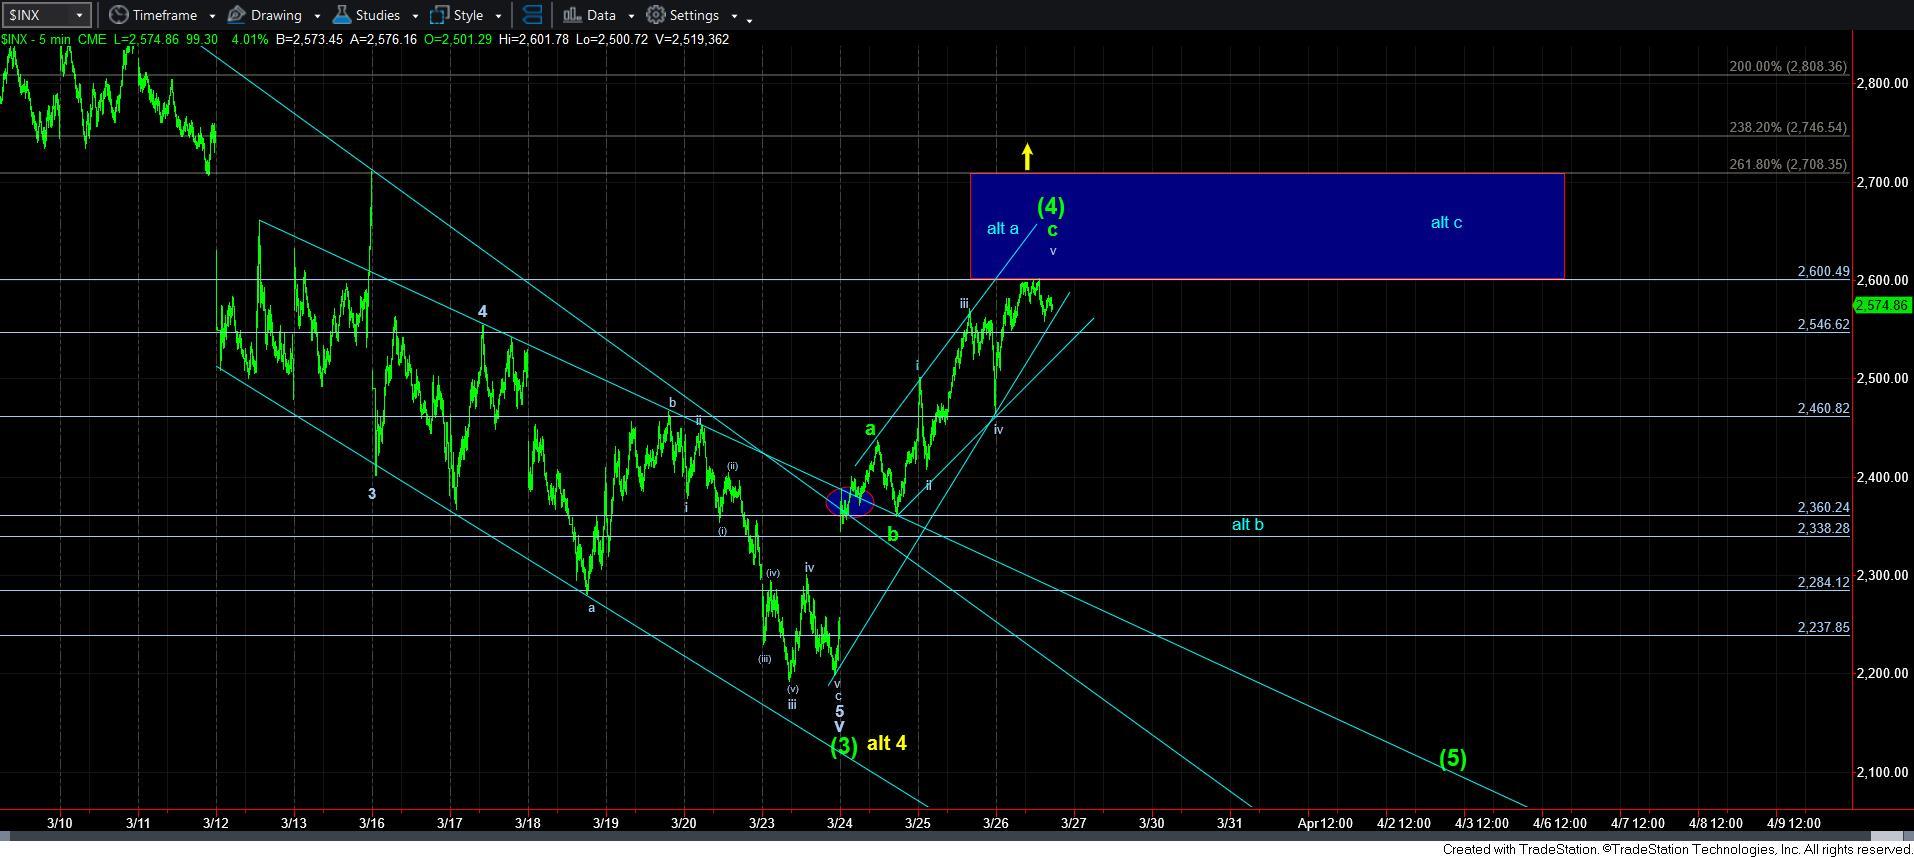
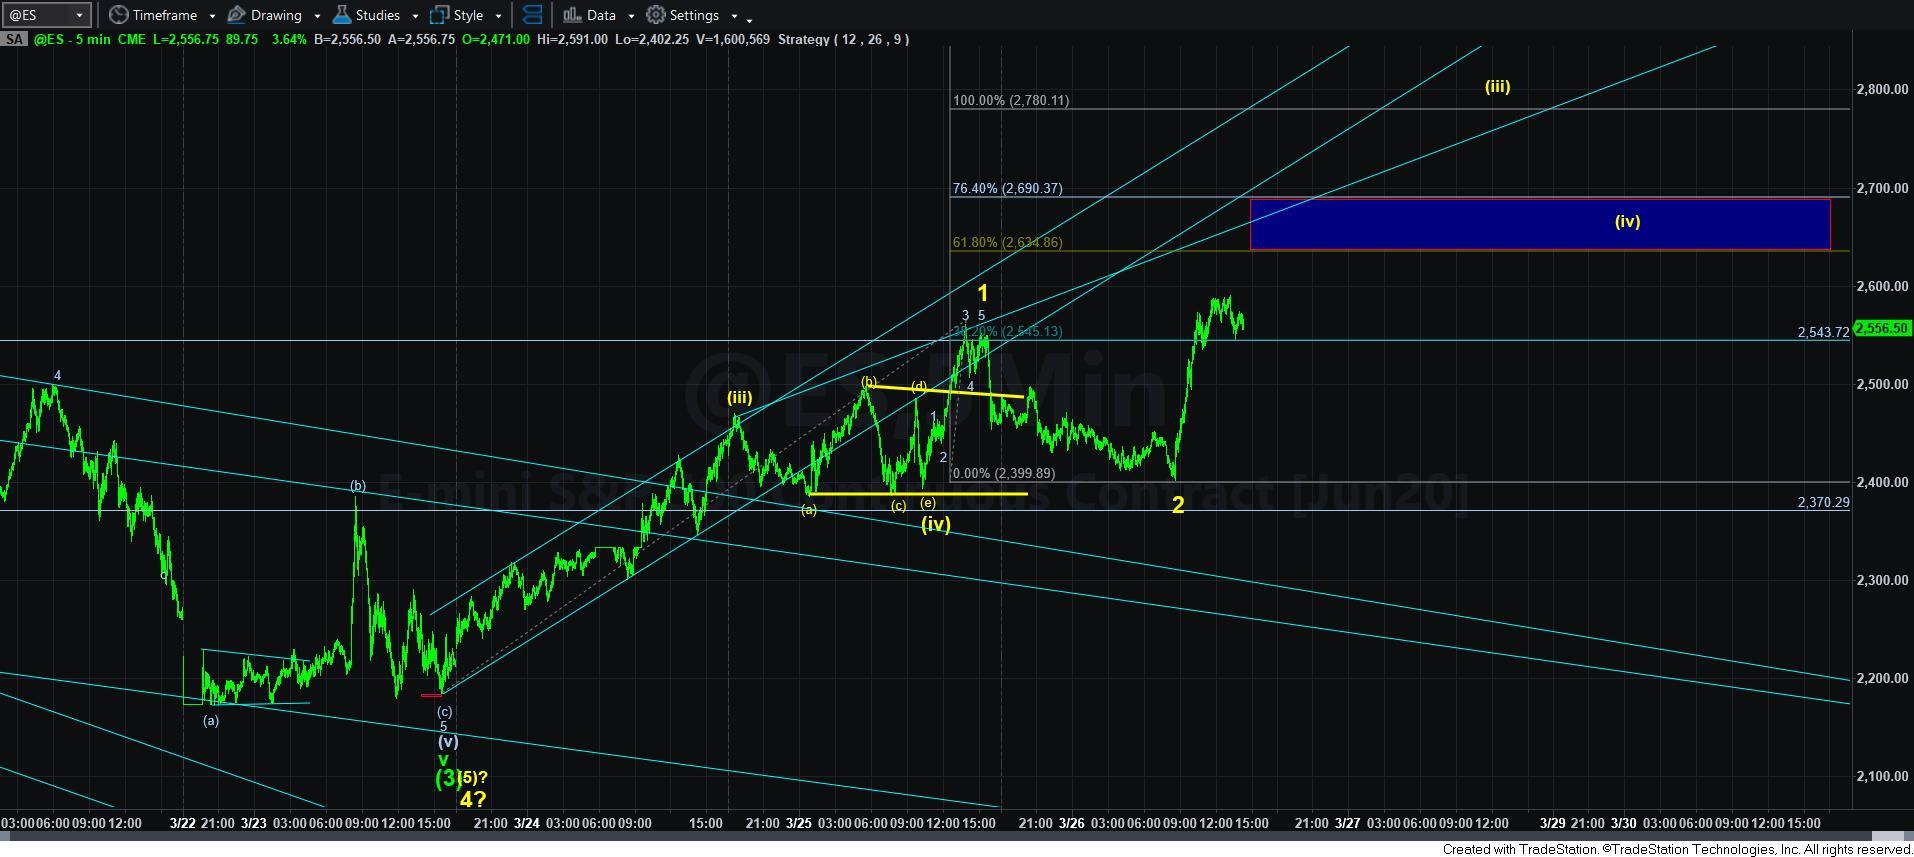
So, I am going to be focusing primarily on the SPX for signals. As we know, our expectation was that the SPX would rally to AT LEAST the 2600 region for wave [4]. But, this has been rather fast. And, while the daily MACD on the SPX chart has only begun to rally off the lows, it makes me wonder if this wave [4] will potentially take a bit more time and provide more whipsaw. For this reason, I have added the potential in blue. Ultimately, I cannot make a determination about this potential until we drop further in the market to be able to gauge if the drop is corrective or impulsive. If corrective, then I will be leaning towards the blue count potential much more. If impulsive, then I will be looking towards the target box on the 60-minute chart for wave [5].
Now, since there is potential for the IWM to have bottomed already, I have to keep an eye out for the potential that the SPX may have bottomed as well. For this reason, I have noted that as long as we remain below 2725SPX, I can view this as a wave [4] rally. However, if the market is able to exceed the 2725 region in a more direct fashion, then I have to begin to assume the c-wave of wave 4 is done, and we have begun wave 5. To this end, there is a pattern on the 5-minute ES chart that I have begun to track. But, as I noted in the trading room today, this is simply an ALTERNATIVE I am tracking in the background, and it does not have a reasonable probability until the market is able to exceed 2725. Should it be able to do so, then you can buy longs in during the wave [iv] in yellow pullback into support.
As of today, we have struck our minimum target for the SPX for this wave [4]. And, I am now looking for a sustained break down below 2545SPX to provide initial confirmation that the market has topped in this rally off the lows. And, the manner in which we break down will give us a better indication as to whether we will continue in wave [4] based upon the blue count, or if we will be heading directly lower for wave [5].
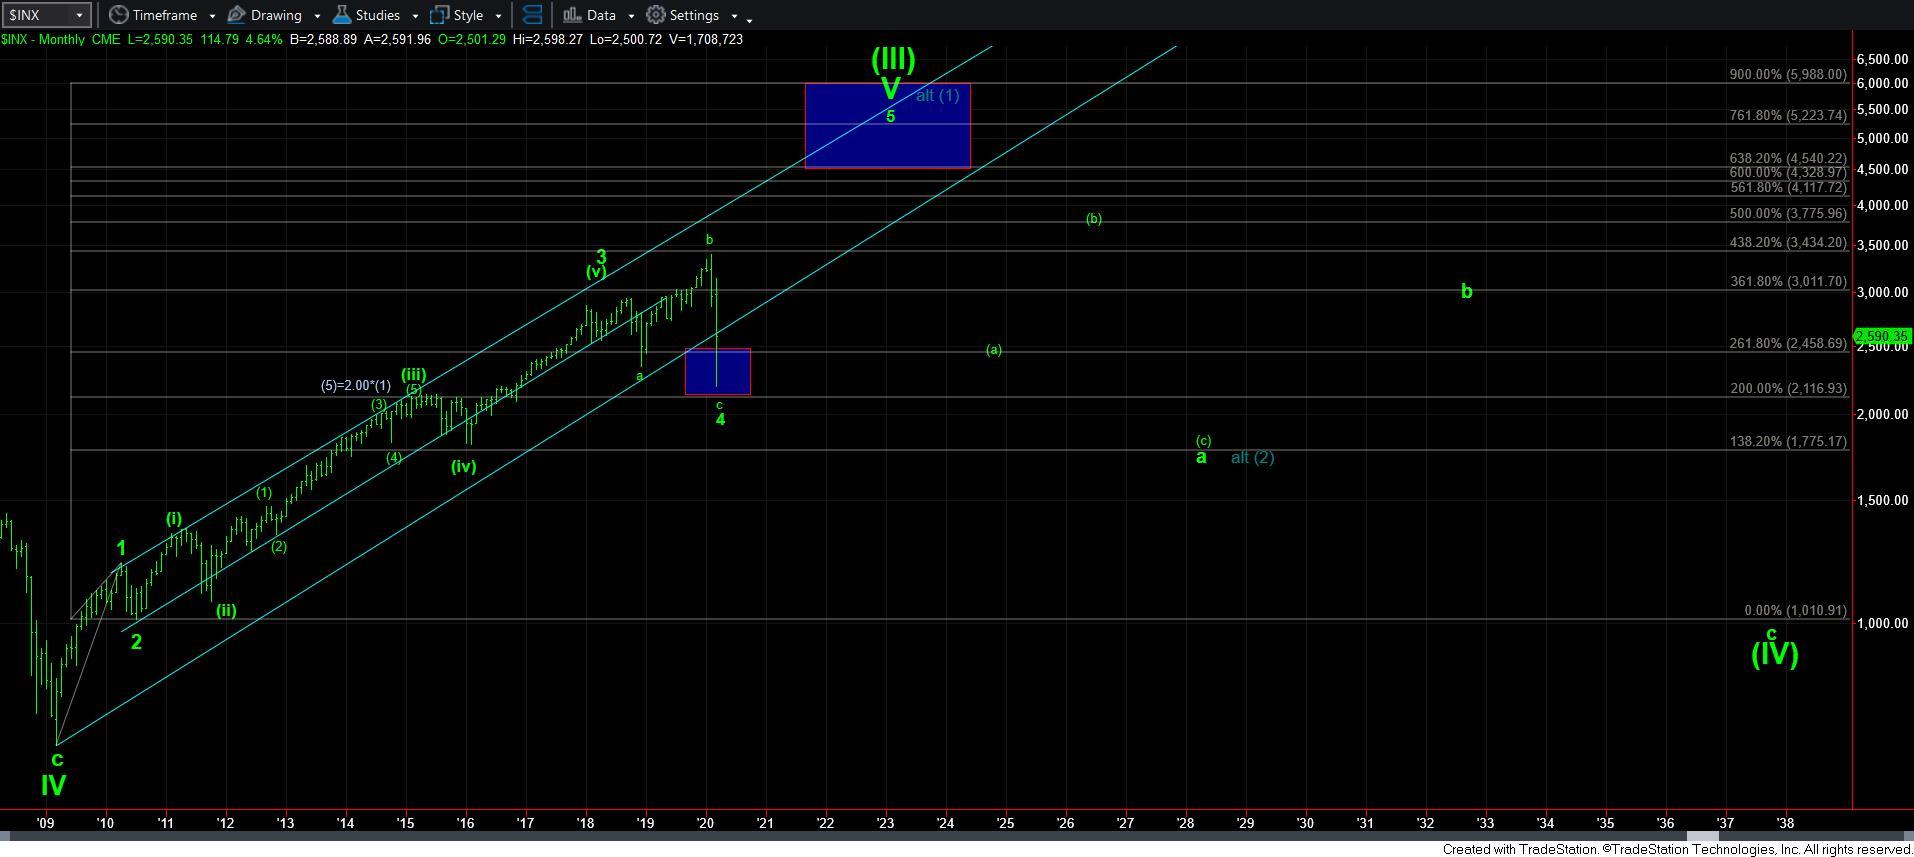
As I said recently, the easy part to the market action has concluded. Now we have to see from where we will begin that 5th wave rally we still expect to take us to the 4000-6000 region in the SPX in the coming years.