Fourth Wave Likely Underway
 By
By
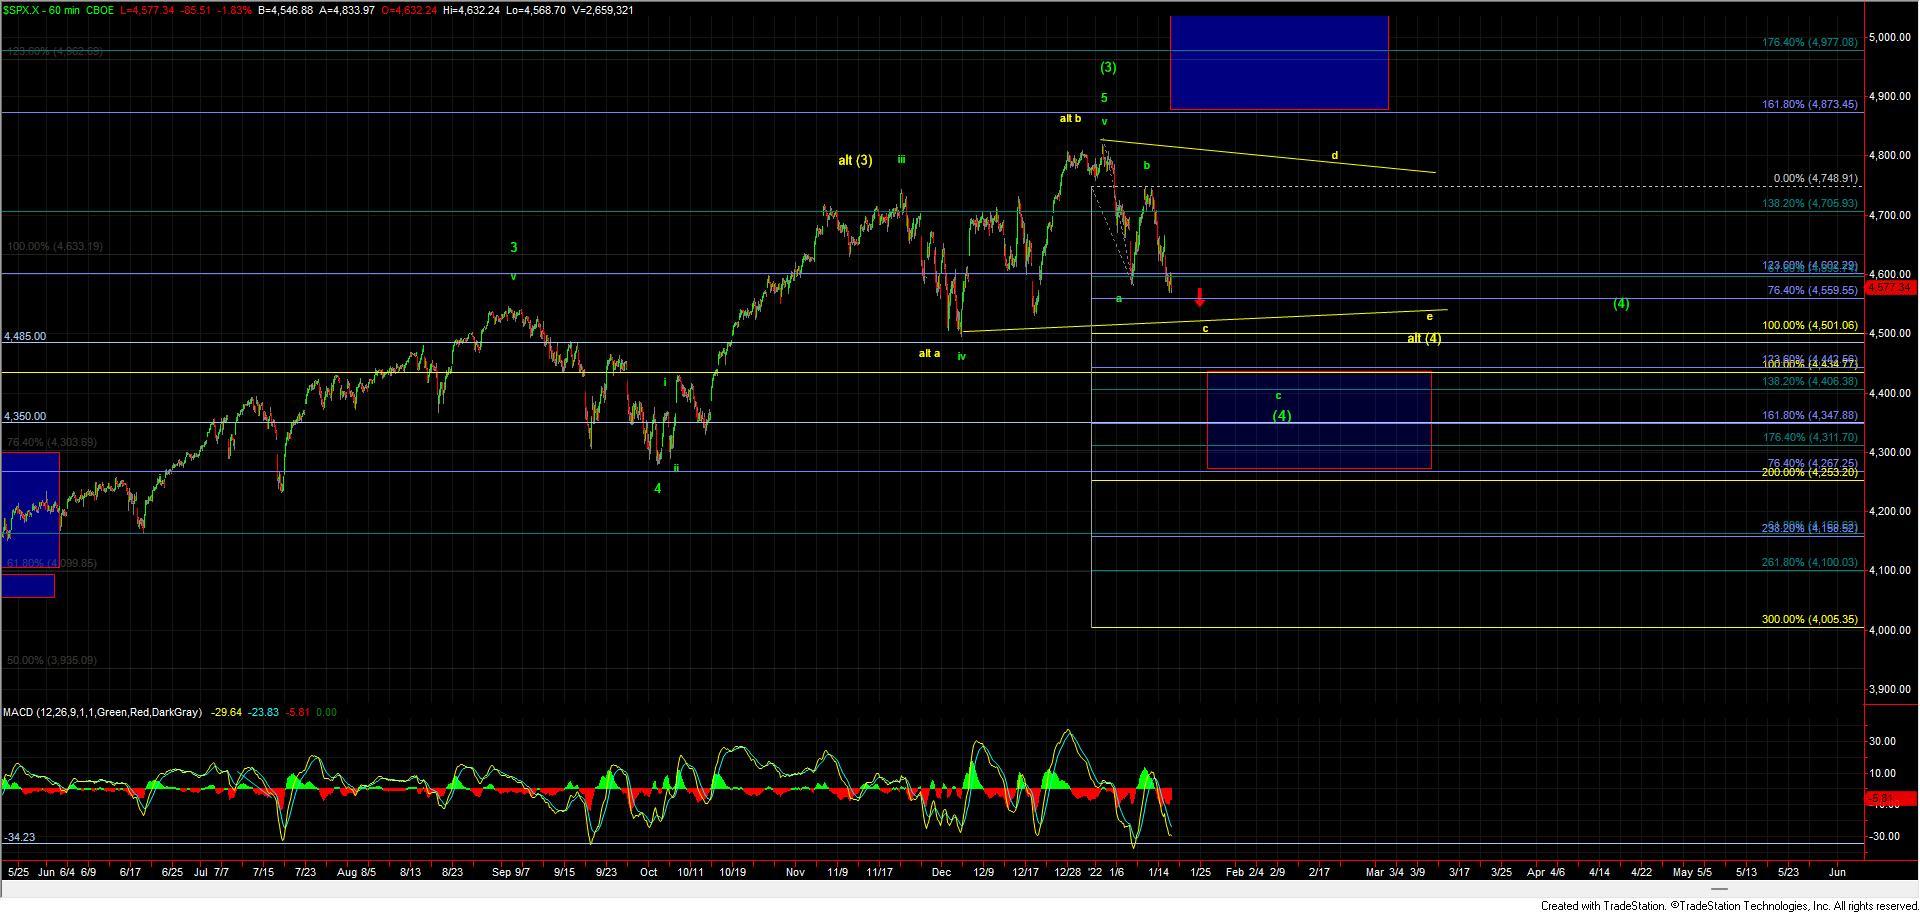
Today the market continued to push lower thus invalidating the most immediately bullish count which we had previously labeled in green and would have suggested that the SPX was going to see another higher high before finding a top in the wave (3). With the break down it is now likely that the wave (3) has already topped at the January 4th high thus likely putting this in the wave (4) retrace. With this break, we have re-ordered the counts with the new primary count being shown in green and suggesting that we have topped in the wave (3) already and that the wave (4) is already underway.
As fourth waves are some of the most difficult and unreliable patterns to track as they will often take some unexpected twists and turns before the wave (4) is completed. With that said as of right now, we are giving the benefit of the doubt to the most simple and straightforward path which would suggest that we are now in a wave c of (4) down which we are showing in the green on the charts. How exactly this c wave will subdivide is still a bit unclear however I am also going to give the benefit of the doubt to the most simple and straightforward path on how this subdivides on the smaller degree timeframes.
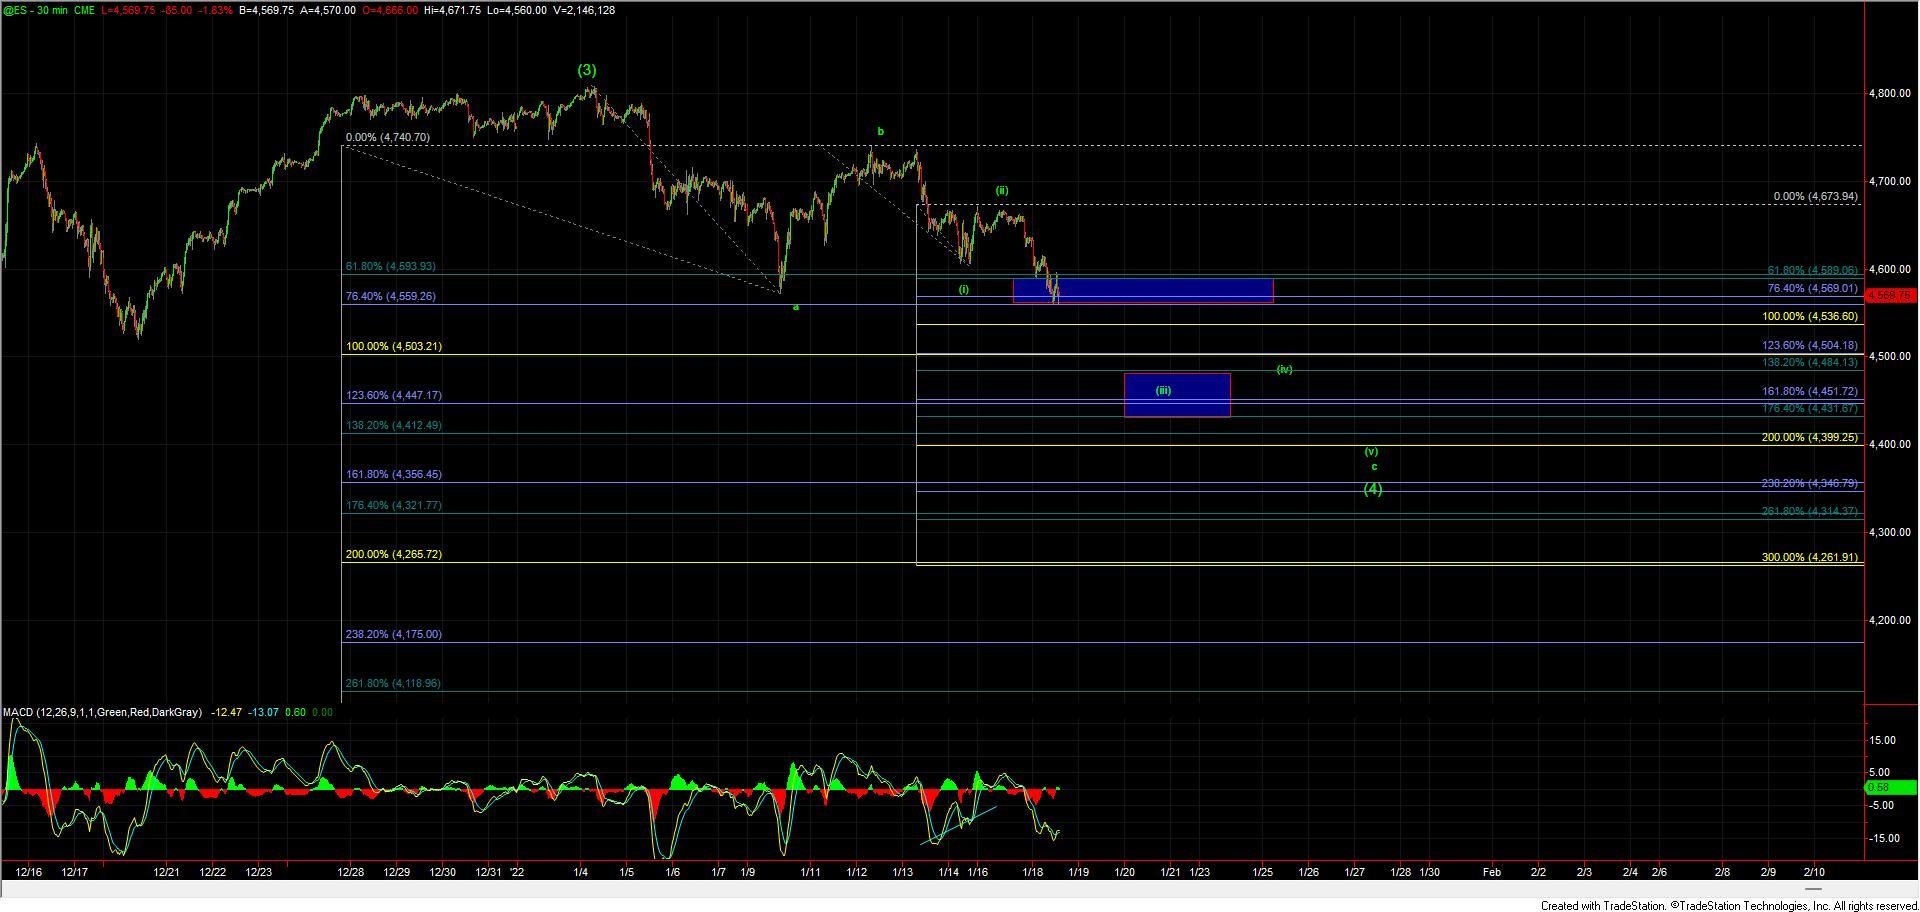
Using those smaller timeframes and as I am showing on the ES 30min we are already through the micro pivot level which came in at the 4589-4569 zone. Assuming we can sustain this break then the next key pivot below comes in at the 4536 level and moving through that level should open the door to a fairly direct move down to the wave (iii) of c target zone in the 4484-4431 zone with ultimate targets for the wave (v) of c of (4) coming in closer to the 4412-4356 zone.
Once we get through the 4536 level then overhead resistance will be at the 4589 level. For now, however, we do still need to push through the 4536 level to give us further confirmation that we are going to follow through to the downside in a direct impulsive fashion. If we do not see that direct push lower but rather a retrace higher before breaking down then it could be suggestive that the c wave is forming an ending diagonal for that wave c of (4). Both cases do suggest that we will see lower levels the latter would however simply give us a more complex pattern to get down to those lows.
If we push higher and then break back over the 4704 level then it would suggest that we may in fact be working on the larger fourth wave triangle count which we are showing in yellow on the 60min SPX chart at which point we can expect several months of continued sideways action as the bulls and bears battle things out before finally breaking higher. At this point in time, this yellow path is still the alternate path however until we see the SPX break down below the 4500 level we still have to allow for the alternate yellow count to remain on the board as a valid alternate path.
So while the pattern in this region has certainly not taken the most ideal and straightforward path and the smaller timeframe charts have been less than clear what is more clear is where we stand within the context of the bigger picture. That bigger picture context is still suggestive that all of the major indexes still need to see higher levels to finish what is very much incomplete patterns before this larger degree rally off of the 2020 lows is finished.