For Those Asking For That VERY Bullish Alternative
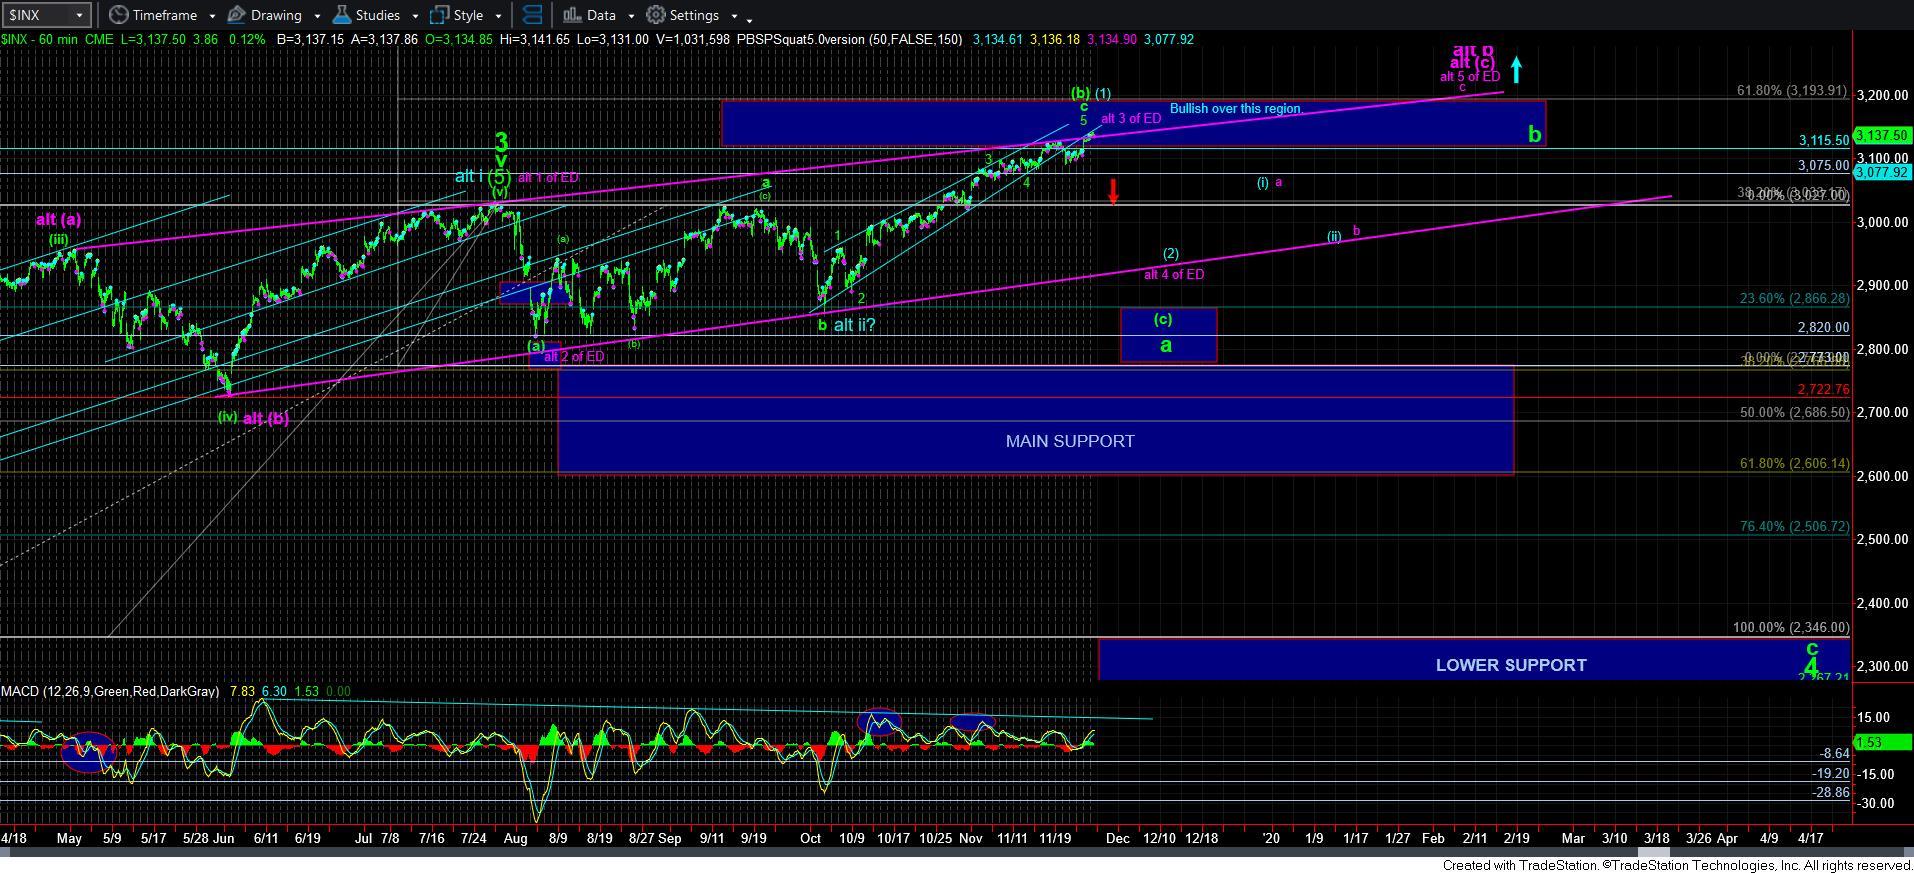
With the SPX providing us with a very overlapping structure up here, and no clearly definable micro structure, I have done as I often do in such instances, and move to a chart which does have clarity. Hence, I have been focusing on the IWM.
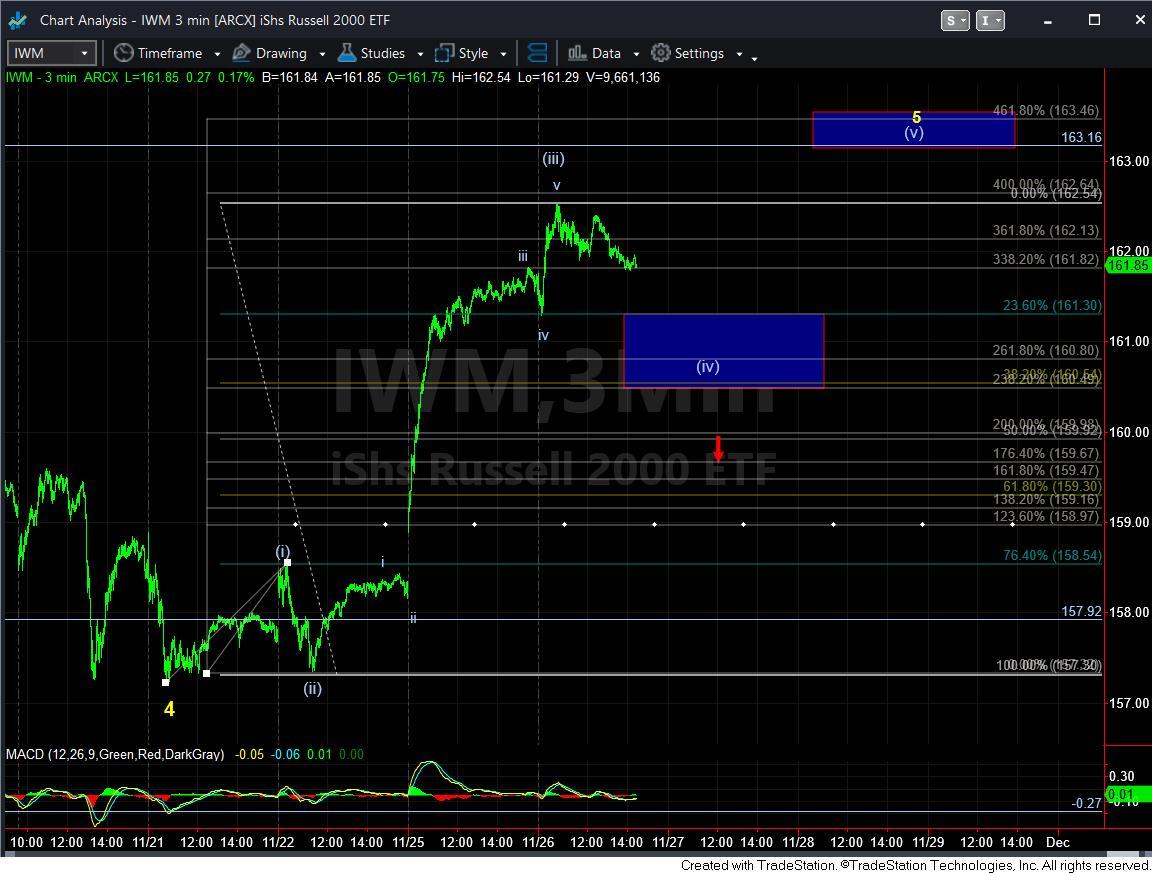
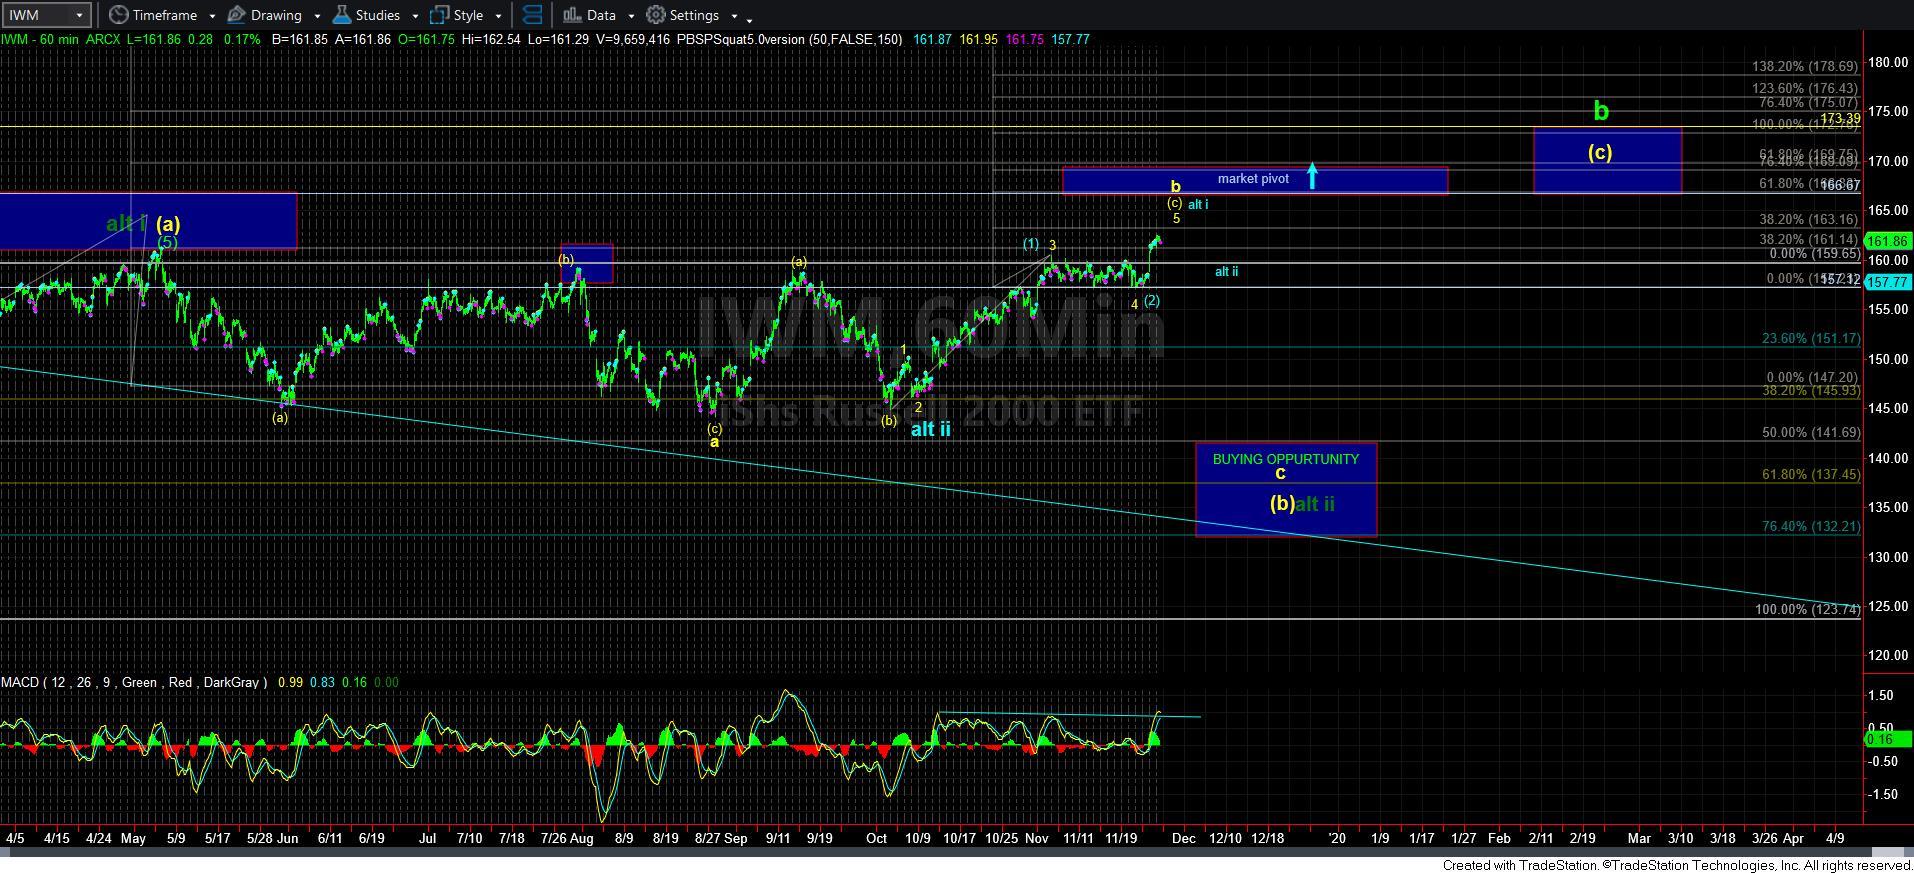
As you can see from the attached 3-minute chart, I am tracking this rally as completing the wave (iii) off the recent lows. Moreover, I am tracking this rally as the 5th wave in the [c] wave of a b-wave, as you can see from the 60-minute chart.
As long as we hold over 160.50 in the IWM, then I still think we will see waves [iv] and [v] fill out before this structure has completed. However, if we see a break down below 160.50, with follow through below 160, then I will be intently focused upon the 157 region. You see, we will need to break down below that 157 support to open the door to the bigger downside structure I am still expecting.
Now, last night, I sent out an update outlining when my overall perspective will change in the IWM. With the market continually pushing higher, similar to what we experienced in January of 2018, I am outlining the most bullish count I can find on the IWM chart, and highlighted it in blue. But, I will warn you that once I did this same exercise in January of 2018, we topped not long thereafter.
In the count presented in blue, I would be considering the month long consolidation we just completed in the IWM as a wave [2] in blue. But, I am going to warn you that it is very rare to see a .236 retracement in the IWM for a 2nd wave. But, within this count, it means that the current 5-wave rally we are tracking is the start of wave [3]. Again, the larger degree Fibonacci ratio structures do not suggest this is the correct count, but I am presenting it as the most bullish alternative I can find.
So, when this current 5-wave rally off the 157 region completes, the next major move will depend upon whether the IWM can break back below 157 or not. If the drop off this 5-wave structure is corrective in nature, and takes us back down towards the .500-.618 retracement of this rally, and then we see a rally over the level we strike as the high of this current rally, then I would consider that a VERY bullish indication and may even go long at that point.
But, if the market is able to continue a bullish intent through the market pivot I have noted on this chart, then I would add to my longs and use the bottom of the pivot as a stop.
Again, I want to highlight that this is the most bullish case scenario I can find on this chart, and it is not my primary expectation. Yet, if the market can prove itself in this manner, then my minimum target overhead is 220 in the IWM, with strong potential to head as high as 245. So, it still leaves well over 25% overhead to garner, even if I maintain a very cautious stance at this point in time.
For now, my expectation remains that we are “topping,” and once IWM breaks 160, then we will have a much better idea as to how we will play the next few months. But, my primary expectation remains that we can see a trip down to my target box below on the 60-minute chart, once we break down below 157.
In the meantime, I want to reiterate what I posted as an update early this morning, as I think it is important for me to say this again:
There is no question that the market is putting my larger degree expectations to the test here. And, while I have noted that I am not always going to be right in my assessments, our work on the markets over the years has always proven to be much more correct than not, even in the face of extremes we have dealt with in the past.
That does not mean there will not be times when it will be wrong. However, even though the market has now pushed to extremes on the count I am following, I still don’t have clear evidence that it is wrong.
Last night, I posted an IWM chart which outlined where I would be clearly wrong in my assessment – in other words, should the market be able to directly move through the pivot noted on the 60-minute IWM chart. And, should the market move through that pivot on IWM, then I would have to accept we are on our way to levels that are 25% higher, and potentially even more over the coming year or two (my minimum target on the IWM is 220). But, until that happens, I see the risks of a 30% drawdown as too great to simply throw caution to the wind and assume that the market does not have such risks, especially when I consider that we have over 5000 members I need to consider.
While you may chose to view the market as you see fit, the standards that I apply in analyzing the markets have kept me safe from large draw downs. While I certainly may miss some of the upside in a 5th wave (should this actually turn out to be the correct count), I will personally only adopt that count if the market makes it clear I must do so, because there are still too many factors telling me that this is not the most likely case scenario.
So, while I wish I am able to be 100% correct in all my assessments, I still have to apply what has proven to be correct the great majority of the time, as the risks are still too great for me to put my own money to work in assuming that we will have a melt-up from here, as so many are so certain. While they could be right, I still think the risks are too great for me to be willing to put my own money to it.
So, over the next week or so the market will likely either confirm or invalidate my expectations. At this time, if we spend the day in a pullback/consolidation, as shown on the IWM/RTY charts, then this would go a long way to supporting my perspective. But, I am not going to give the market too much more time to prove my larger degree count to be correct.