Focusing on The Bigger Picture
Being in a 4th wave, there is very little I trust, especially when the market obfuscates the smaller degree patterns we track. So, it leaves me with either attempting to force a wave count on the micro level, or taking a step back and focusing on the bigger picture. I prefer to focus on the bigger picture, but will also outline what I am seeing in the smaller degree structure.
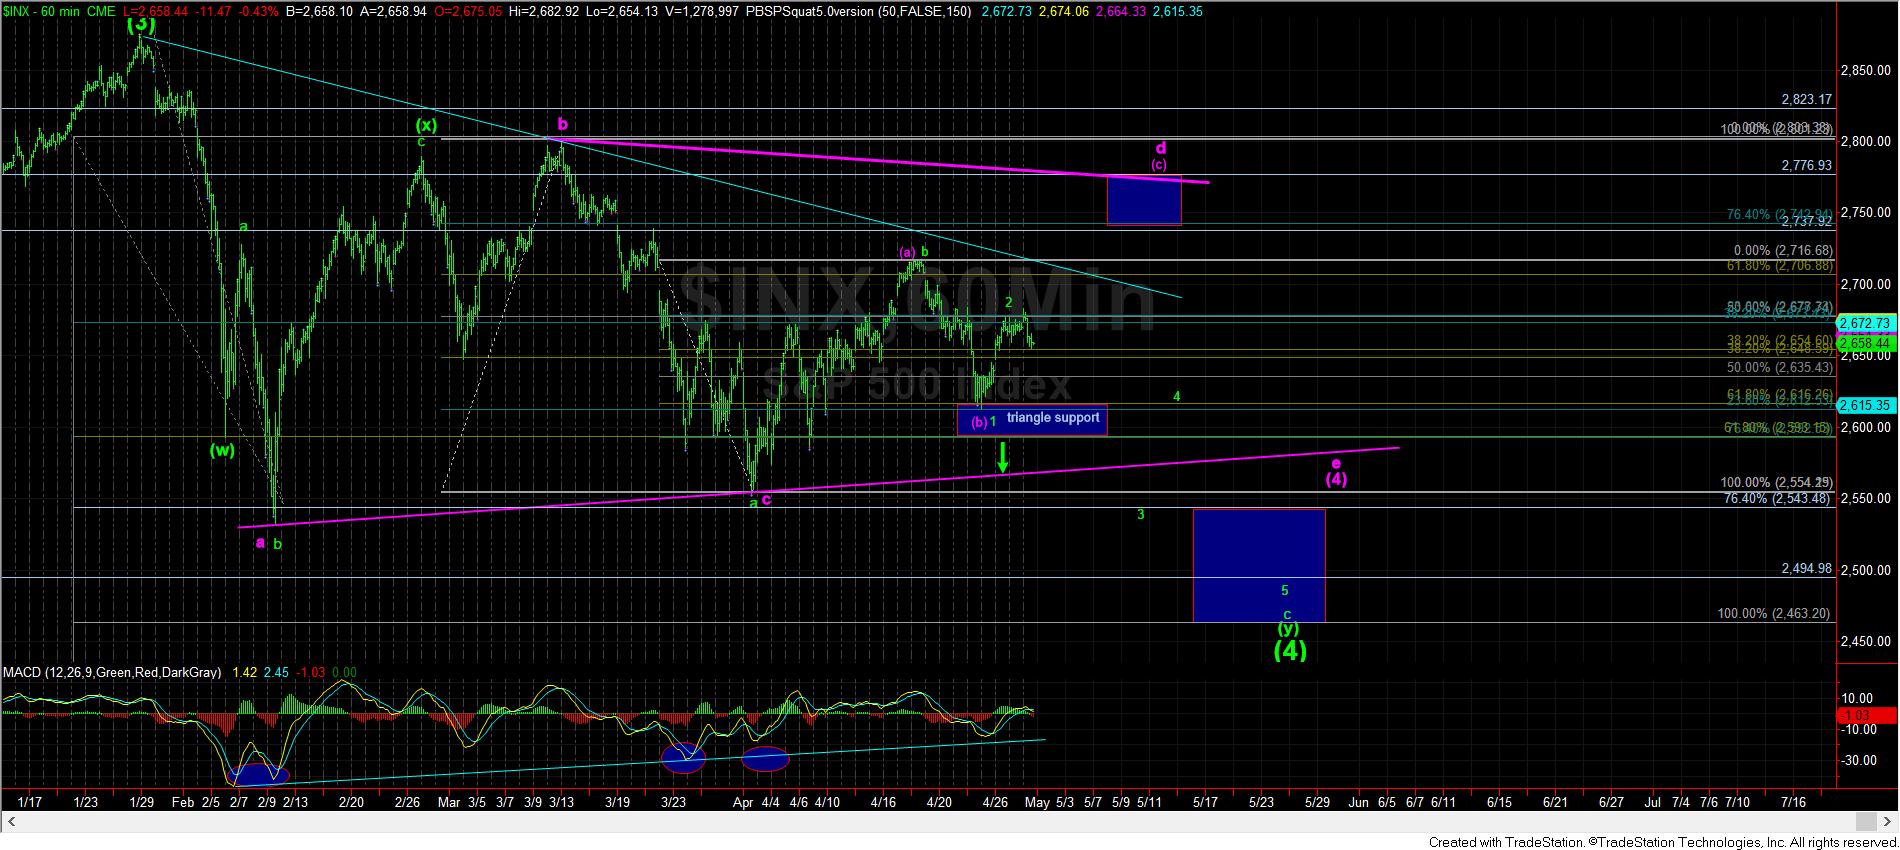
The 60-minute chart is our bigger degree perspective right now. As long as we remain over last week’s low, my expectation remains that we are setting up for a rally to take us up towards the 2737-2776SPX region to complete the (c) wave of the d-wave of a triangle.
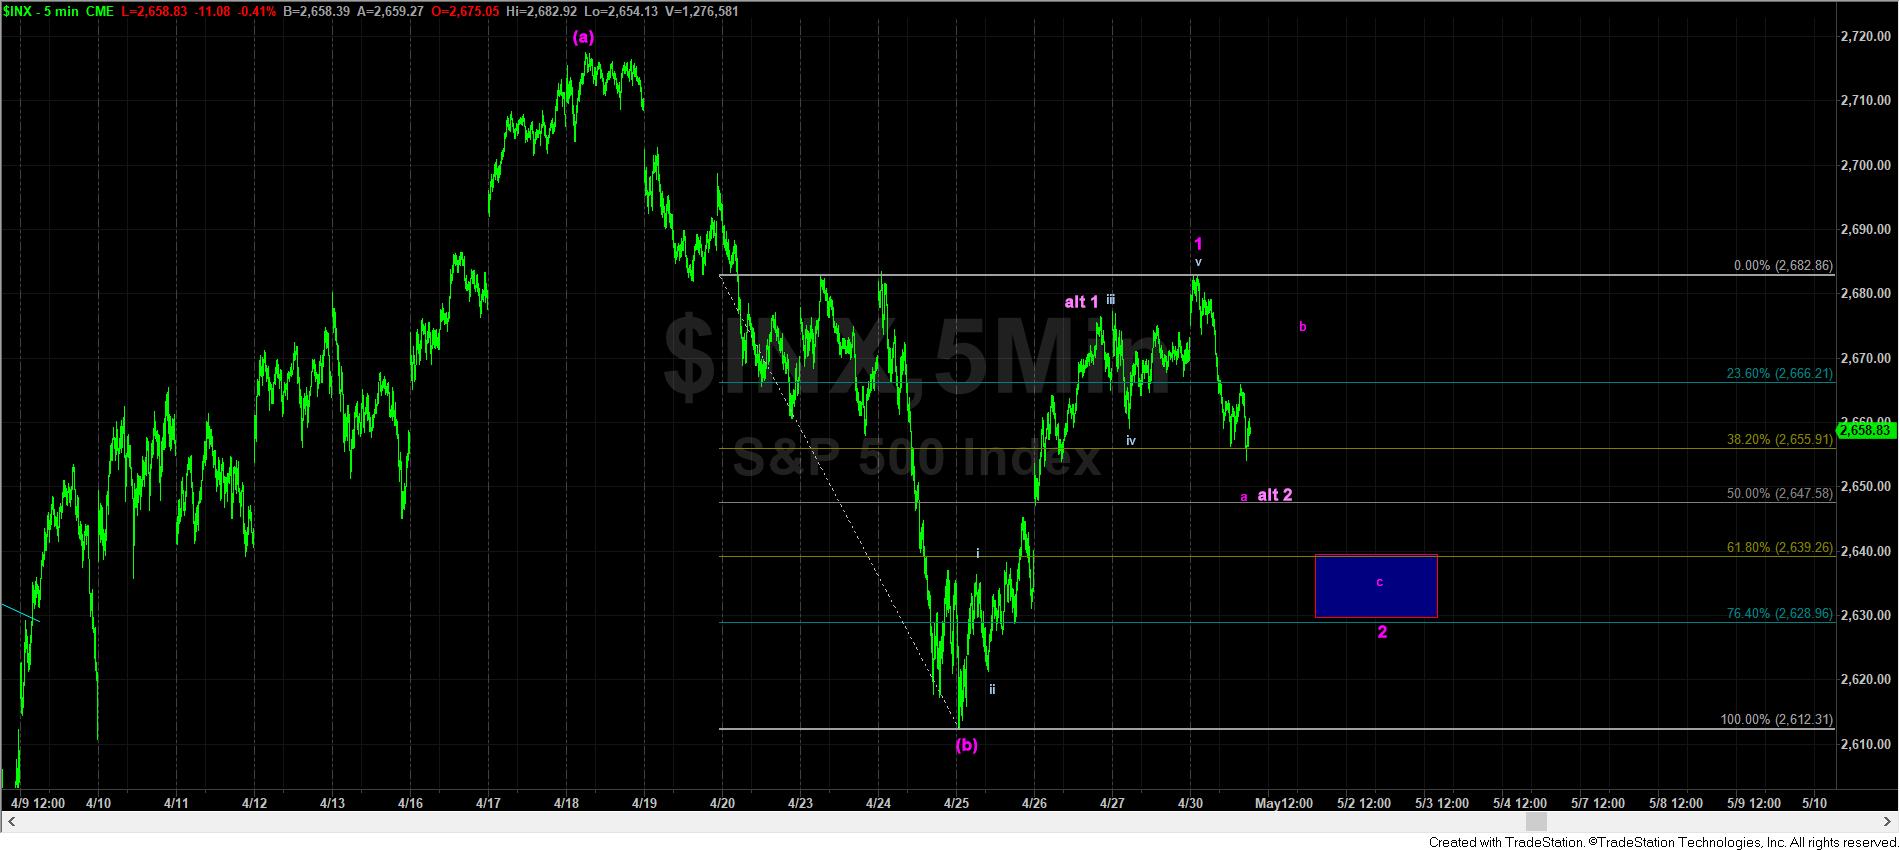
Normally, a (c) wave presents as an impulsive 5-wave structure. And, with this I am struggling at this time on the micro structure. There are a number of points in the rally off last week’s low that present overlap which makes it tougher to consider it as a clean 5 wave structure having completed into today’s high. Moreover, the move up into today’s high really looks best as a 3-wave structure rather than a 5-wave structure for the 5th wave. This means that the only real way I am able to come up with 5 waves for wave 1 of the (c) wave is as a non-overlapping leading diagonal.
For those that follow me regularly, you know that I am not a fan of leading diagonals, and certainly not the kind that do not overlap, as they are much more rare than even those that do overlap. And, since we are still likely in a larger 4th wavs structure, I clearly have issues placing strong reliance on such a structure. But, for now, I it presented in purple on the 5-minute chart, and will continue to track it into tomorrow.
Moreover, if the purple count on the 5-minute chart is operative, then it would suggest that the wave 2 pullback will likely be deep so that it would fit with the larger degree projections to 2776SPX. That points a wave 2 in the 2630-40SPX region. A bottom to wave 2 in this region would project 1.76-2.00 extension right towards our blue box overhead in the 60-minute chart.
The alternative I am tracking on the 5-minute chart is that the rally up in the (c) wave will turn into a larger degree ending diagonal. That means that the bottom we just struck could very well be all of wave 2 in an expanded flat (with today’s high being the b-wave of wave 2). But, the only way to take that potential more seriously is if we break out over today’s high. But, I will warn you that if the market is going to trace out a (c) wave as an ending diagonal, it will continue to provide us with a significant amount of whipsaw through waves 3, 4, and 5. The ideal target for wave 3 would be the 1.236 extension in the 2735SPX region, and will be met with an a-b-c rally.
And, lastly, as I have been noting since last week, should we break below last week’s low, then it opens the door to the market dropping down to the 2440-2495SPX region in an ending diagonal down for the green (c) wave.
So, if the market does not provide us with a clear wave 2 pullback, as presented in purple, over the next day or two, I can assure you that the market will continue to frustrate market participants, as we will likely be dealing with another diagonal, one way or another.