Focusing On IWM - Market Analysis for Dec 19th, 2023
For those that have followed my work over these last two years, you probably have read at least 100 times how I was always going to give the yellow wave count to new all time highs the opportunity to prove itself. The main reason was because I was unable to count a solid 5-wave structure into the January 2022 top. While I did reiterate that I was going to approach the market from a more cautious perspective for risk management purposes, that yellow count had always been a silent preference (which many of you read between the lines) in order to complete a more appropriate 5 wave structure off the 2020 low. And, now, we are likely in the final throes of that 5th wave.
And, while we caught the bottoming in the 4100SPX region, and expected a rally to at least the 4350-4475SPX region, I went neutral the market once we got to that point, and raised a little cash. I noted that I wanted to see how the market reacted at that point, and whether or not we would get a 5-wave decline to tell me I had to raise a significant amount of cash due to the bearish ramifications of such a structure, or if we would get clues as to the market wanting to get that higher high and complete that 5th wave off the 2020 low in the yellow count..
Over the last few weeks, as the market was making it more and more likely that it wanted to go to 4800+, I have noted how I was adding various long positions with the cash I raised. And, yes, I left cash on the side for the standard b-wave pullback that we normally see in these structures. I cannot say that the market confounds me often, but when it does, man does it do a good job. And, without any real pullback since we caught the bottom in the 4100SPX region, this market has moved into a very rare form.
As I have highlighted in prior updates, I really cannot remember the last time I saw such a large rally at this wave degree wherein we did not even see a .236 retracement at some point. And, without retracements, it is almost impossible to appropriately gauge where we reside in the smaller degree wave structure.
While the IWM is actually providing us with two relatively solid paths we are tracking, I simply cannot just slap the IWM structure onto the SPX, even though it would make my job quite easy. But, that would not mean I was doing what I need to be doing as an honest analyst. So, there are several reasons as to why I simply cannot apply the IWM wave count to the SPX.
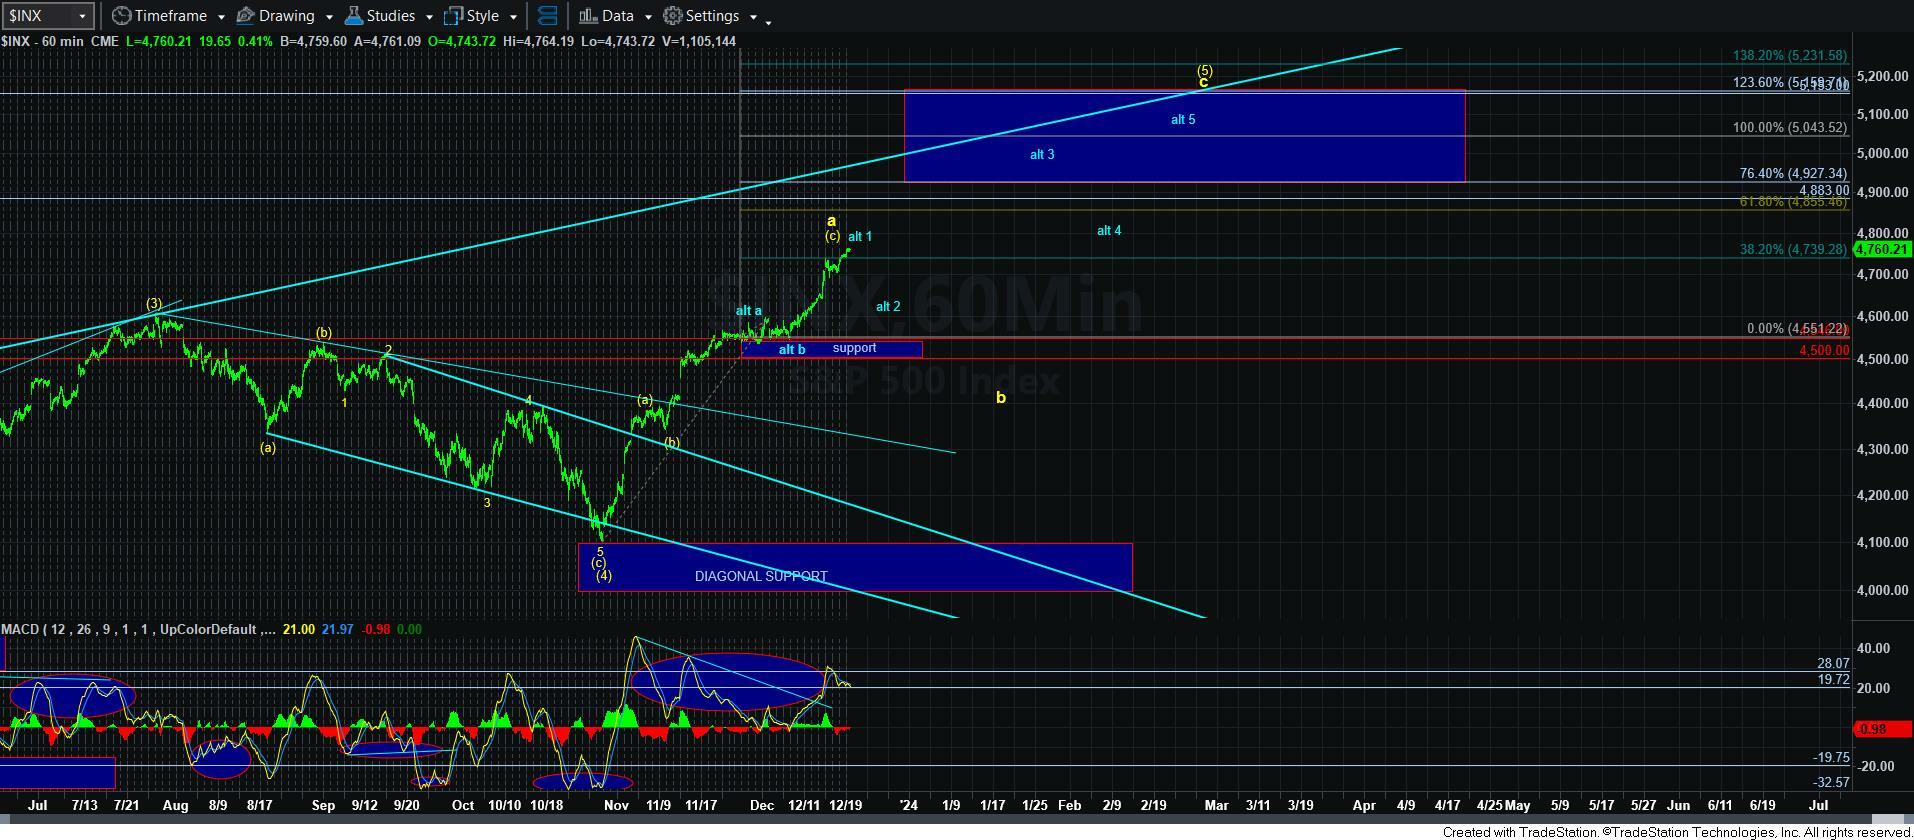
First, the IWM structure is calling for a [c] wave rally off the October low and [c] wave rallies take shape as a 5-wave structure. However, in the SPX, we are seeking a 5th wave rally within an ending diagonal. And, ending diagonals sub-structures all take shape as 3-wave structures. Therefore, applying the IWM wave count to the SPX is like trying to fit a square peg into a round hole.
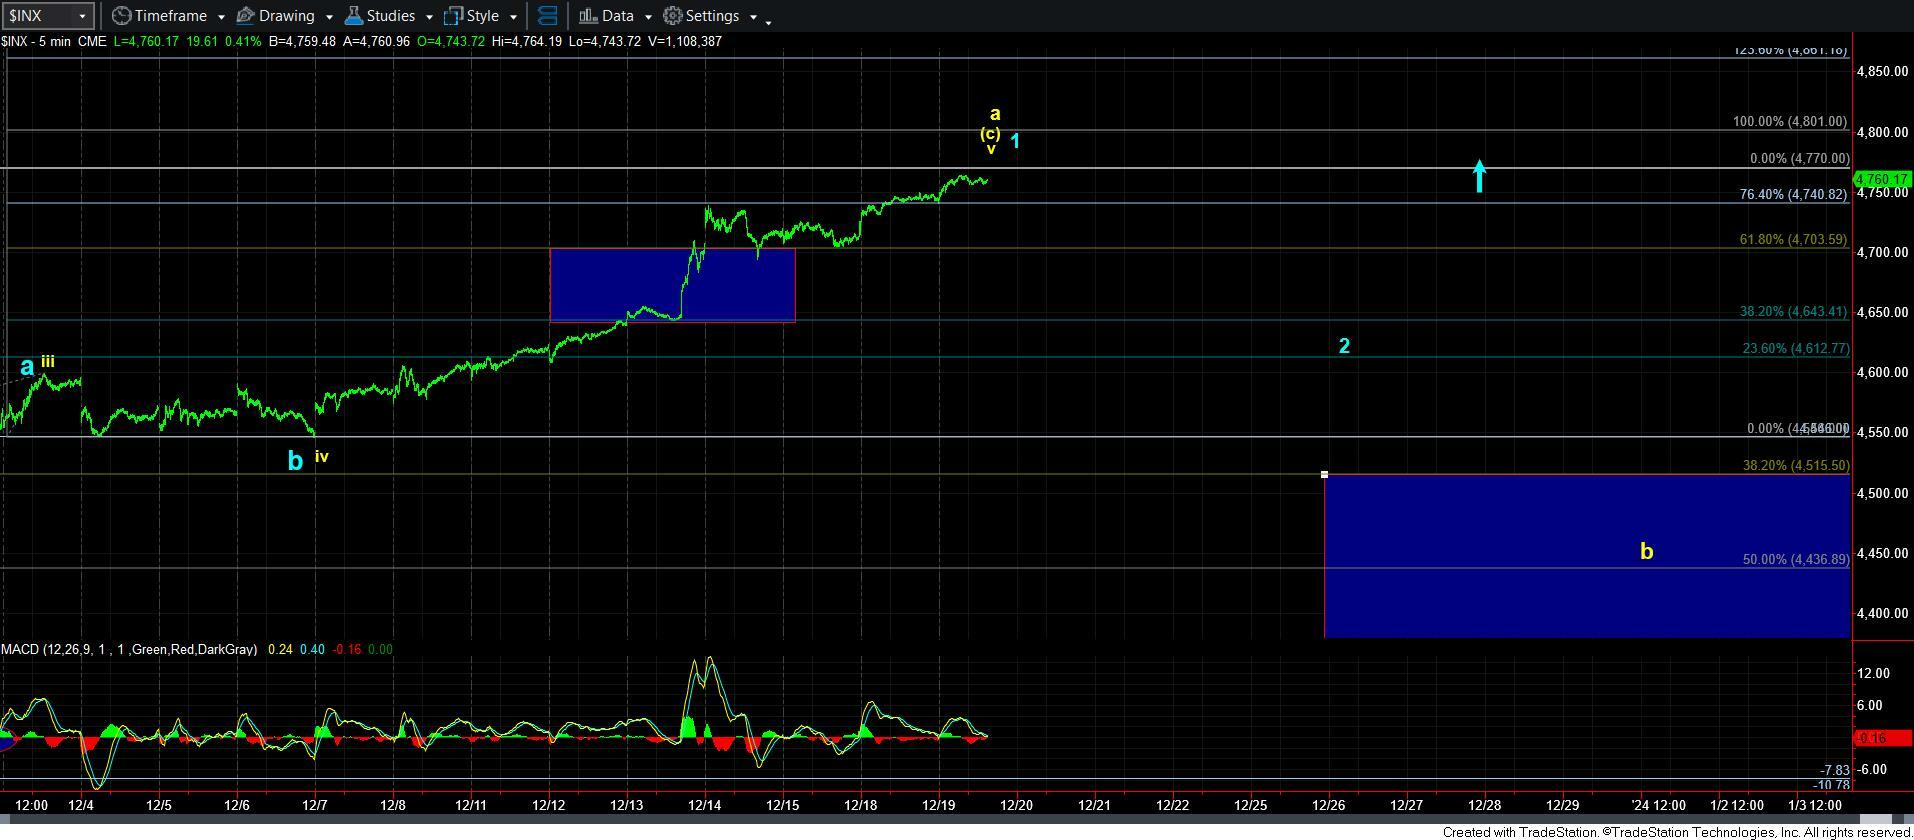
Second, the largest consolidation of note in the SPX is the sideways action that took shape at the end of November into early December. And, since it is the largest consolidation we have seen during this entire uptrend off 4100SPX, it still makes the most sense to label that as the b-wave within this 5th wave. Clearly, this does not match the IWM either.
It still leaves me with paths in SPX within which I cannot say that I have a ton of confidence, especially now that the market has exceeded the 4750SPX level. It now forces me to view these two paths on my SPX charts as equally probable. These two paths presented seem to be the most reasonable out of all the various patterns I have attempted to overlay into this rally after going through many different calculations and permutations.
Therefore, without a solid path to follow in the SPX, it does suggest that I want to focus a bit more on the IWM. So, I think that is what I am going to do going forward, at least until the SPX gives me a much higher probability wave structure.
So, let’s get into a bit more detail today on the IWM. And, to this end, I have added 3-minute and 60-minute IWM charts to my analysis. Let’s start with the daily chart.
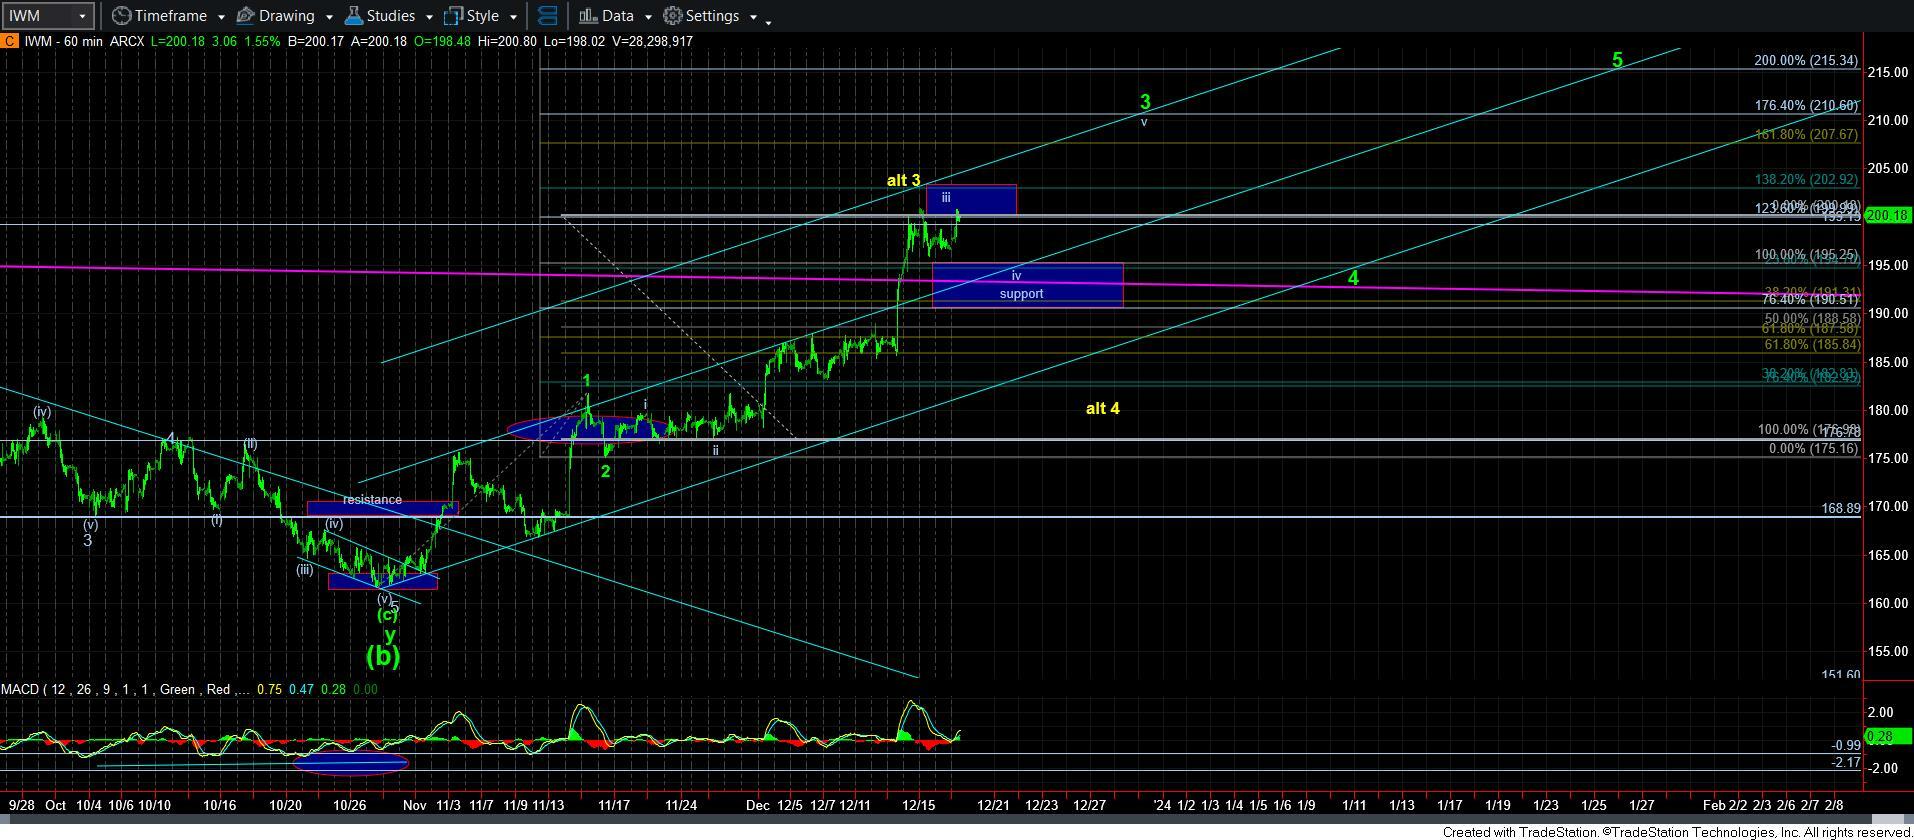
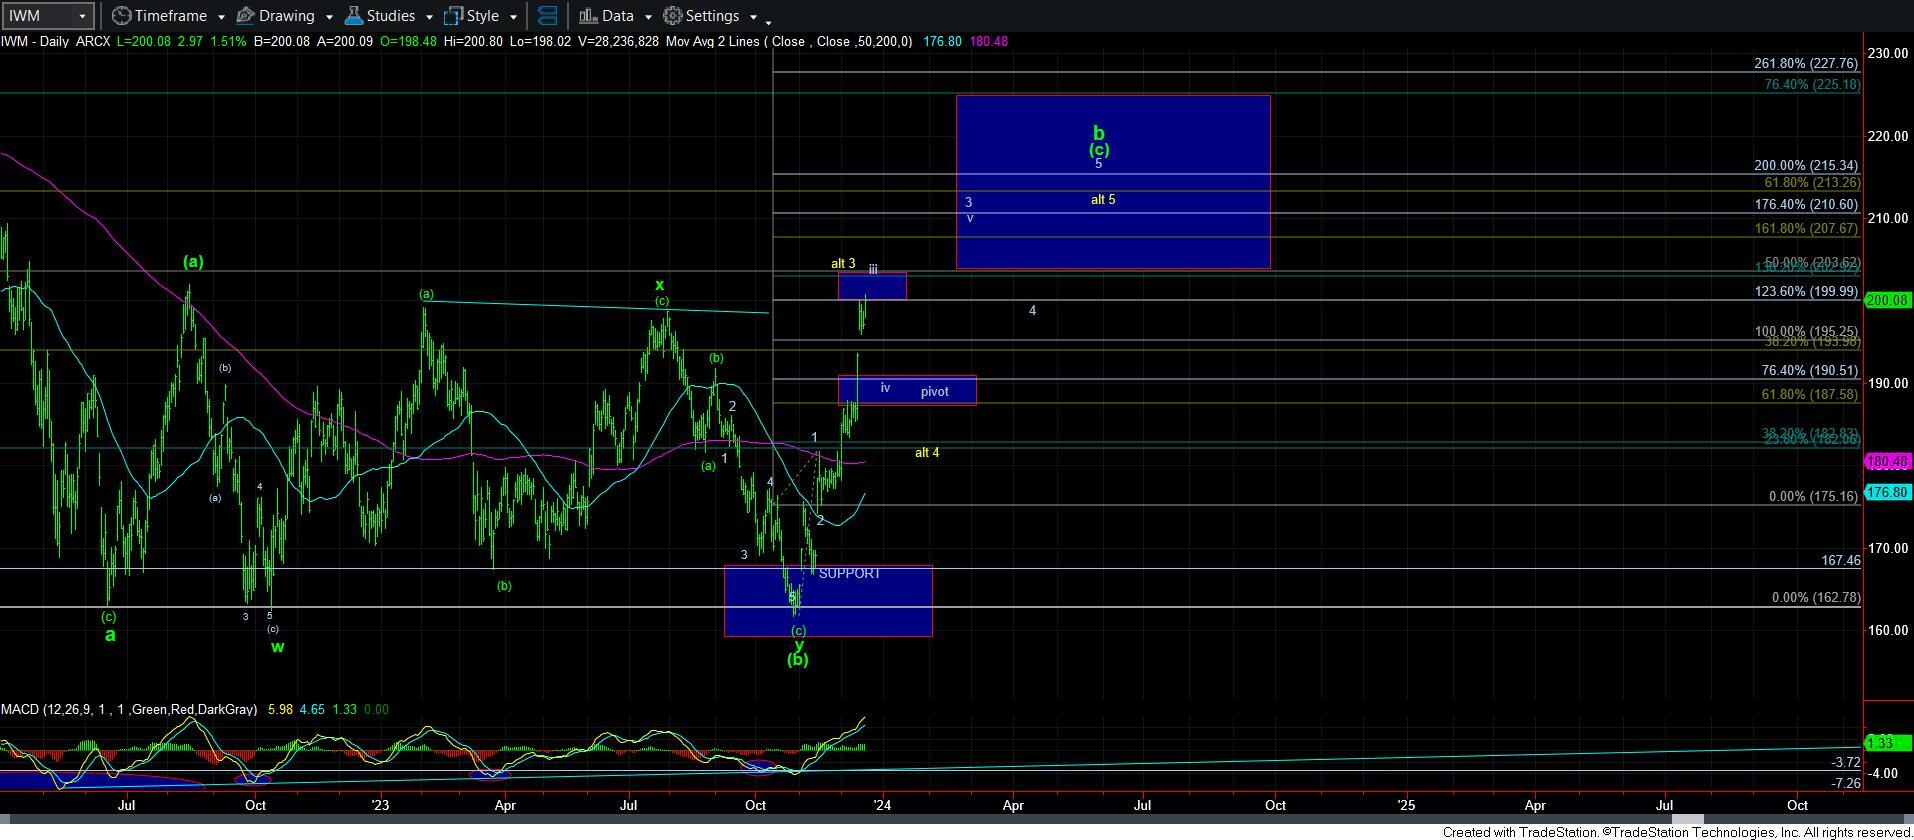
As you can see, in the standard impulsive structure, we are likely transitioning between waves iii and wave iv within wave 3 of this [c] wave rally. And, if we zoom into the 60-minute chart, you will see a similar view. Right now, our upper resistance overhead for this wave degree is in the 202.92-203.65 region. The 202.92 region represents the 1.382 extension of waves 1-2, and the 203.65 region represents the .500 retracement of the large a-wave decline, of which this is a b-wave rally retracement likely targeting the .618 retracement region overhead in the 213 region.
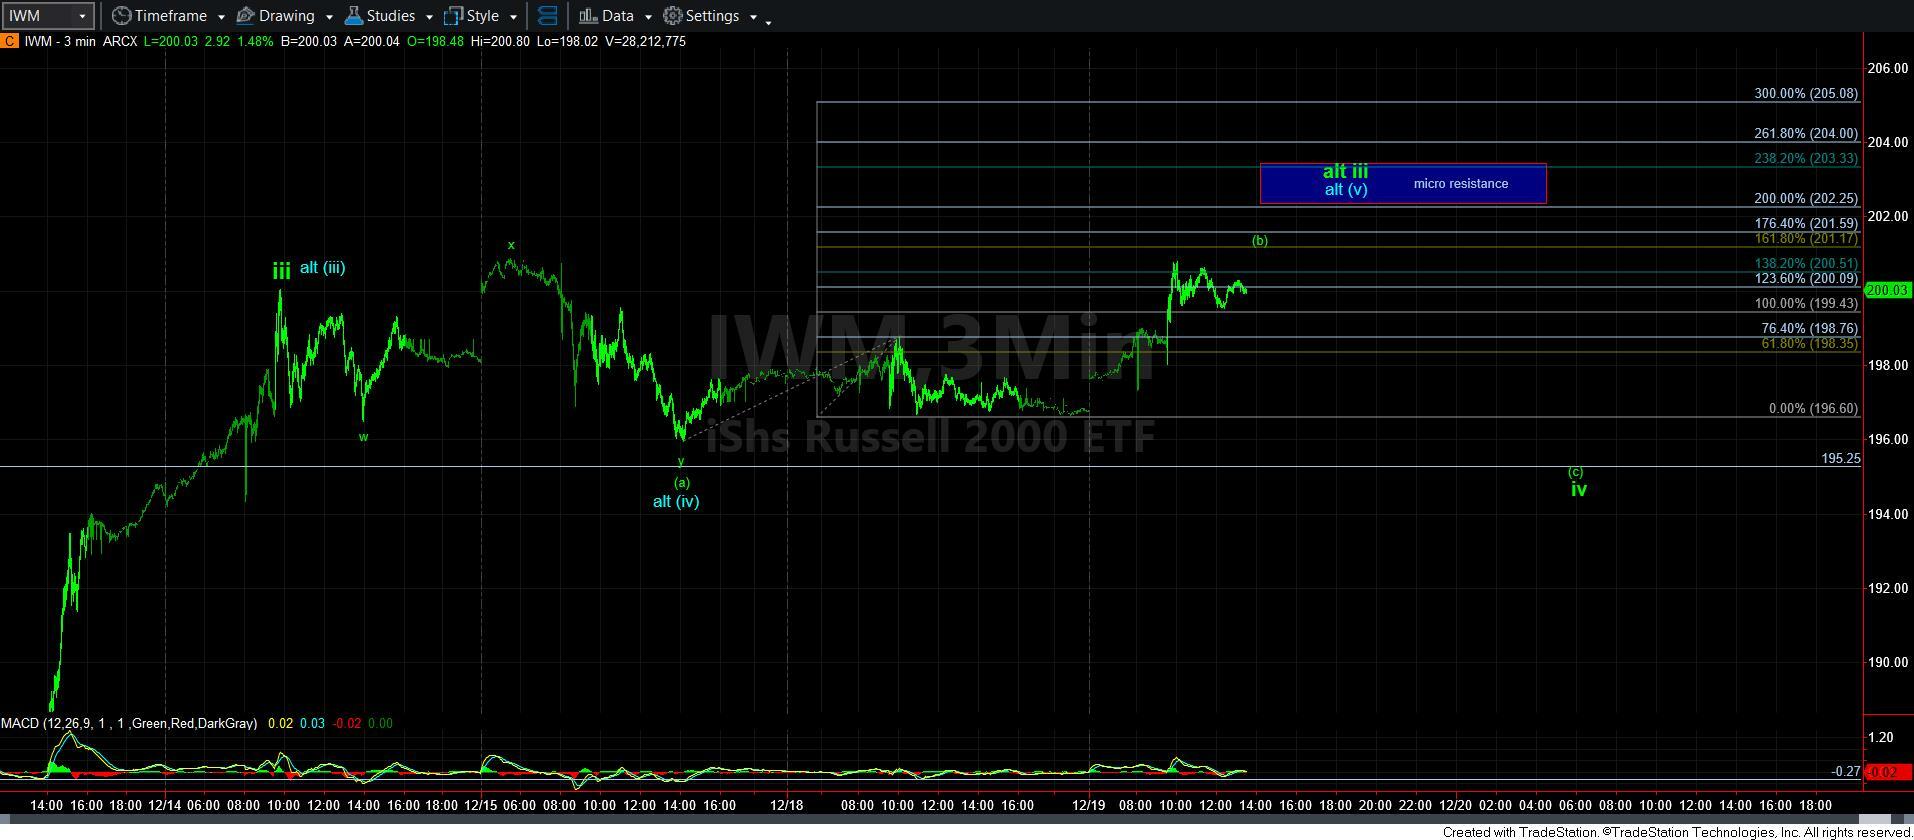
So, let’s now zoom into the 3-minute IWM chart. This outlines our smaller degree question as to whether wave iii of 3 has indeed completed. As you can see, if the market holds this smaller degree consolidation we are seeing today and is able to extend north of 201.17, then it likely means that wave iii is simply extending.
But, ultimately, it would mean that we should reasonably expect a return to the 195 region. That currently represents the .236 retracement of wave iii based upon if we have already struck the top. Ultimately, the main support right now is the .764 extension of waves 1-2 (the traditional support/target for wave iv if wave iii strikes the 1.236 extension), which is in the 190.50 region.
So, as it stands right now, our support is 190.50-195 for wave iv. As long as a corrective structure holds this support over the next week (depending on when wave iii actually tops), then I would expect us to continue higher towards the 207+ region for wave v of 3, which can be seen clearly on the 60-minute IWM chart. So, even if we do rally a bit higher before wave iii completes, I would still expect to see a wave iv pullback before we begin the next rally to 207+.
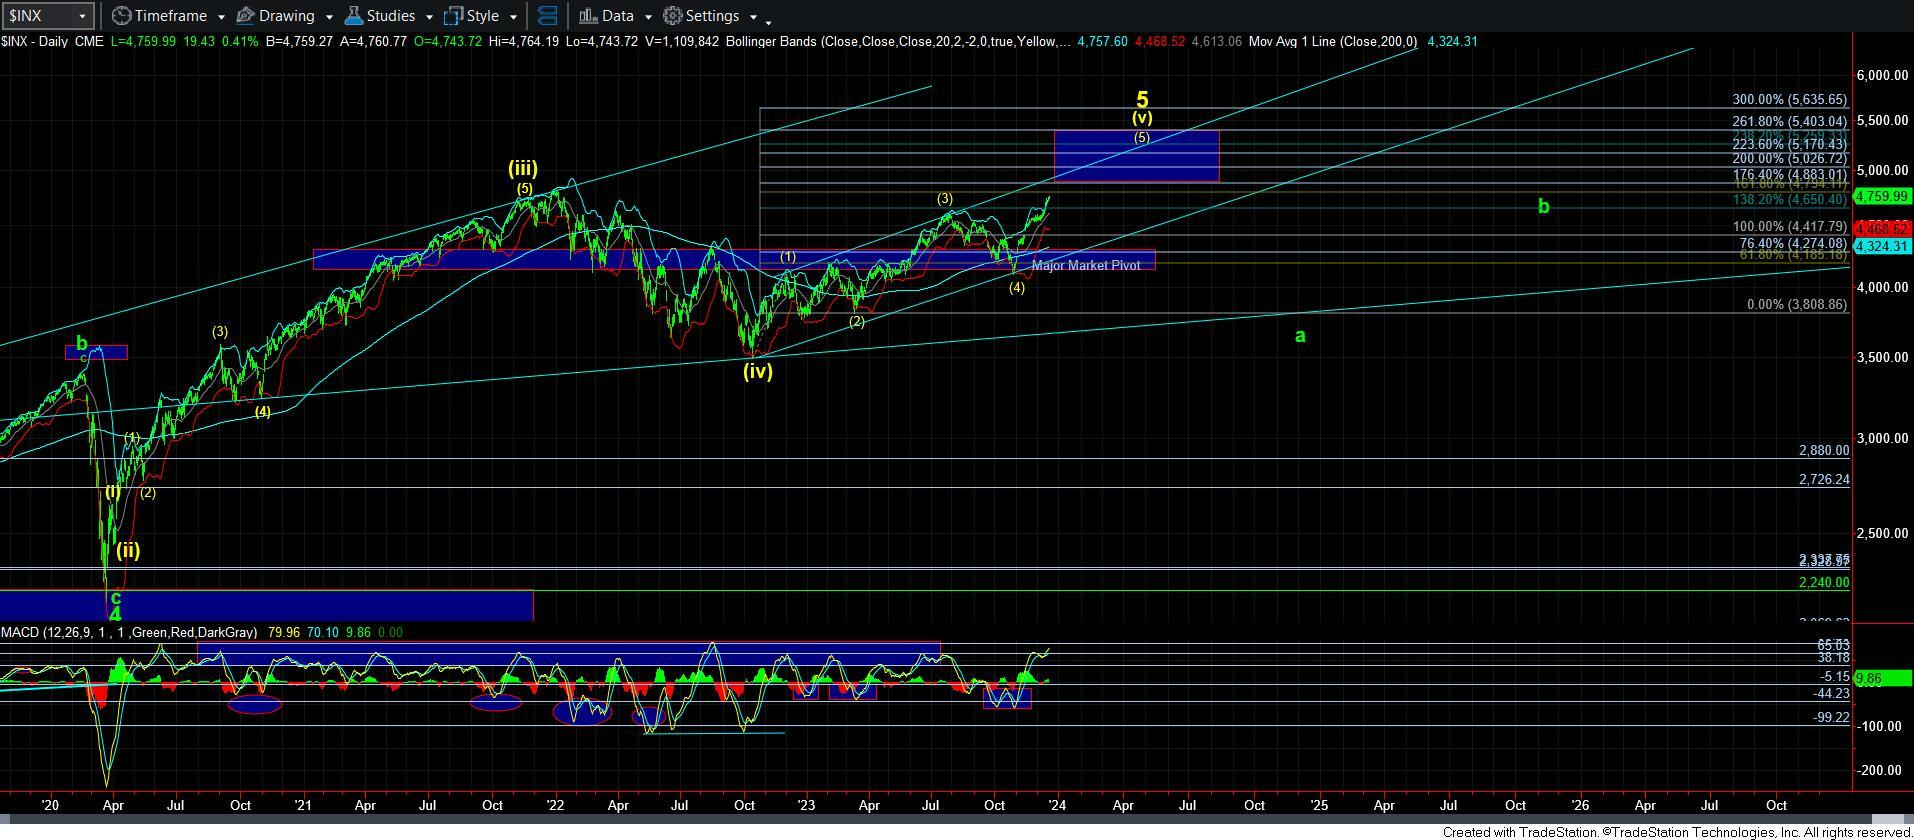
Of course, should the 60-minute support box break, and we then follow through below the pivot on the daily chart, then it makes it clear that this [c] wave will take shape as an ending diagonal, as outlined in yellow on the daily chart. But, as long as we remain over the 190-195 support in IWM, we have a pattern in place to head to 207+ sooner rather than later.
Therefore, I think the IWM is providing us with the clearest paths as to how this market can complete this final rally in the coming weeks/months before we strike a potentially major top.
In the meantime, I want you to take a step back and view the daily SPX chart. Again, I do not think we are done yet with this rally, as I still think there are a few waves left to complete before this chart reaches its destination. But, we are certainly approaching a potentially major topping point.
Moreover, there are a number of individual stocks with upside set ups (some of which I outlined in our StockWaves service as to when I was buying them) which I will also be following in the background that I want to see complete their structures, among them a number of big tech stocks with upside room. In fact, a number of them still have not triggered their 3rd wave rallies yet, which could mean the NDX may see some strength in the coming weeks as well.
In summary, I am still questioning how the SPX is going to complete this rally to 4800+ over the coming weeks and months. But, I think the IWM is now providing us with a much clearer smaller degree structure, upon which I will be focusing much more carefully due to the lack of clarity in the SPX. And, based upon the IWM and a number of individual stocks, it seems we still have more upside work to be done in the coming weeks before we are likely going to strike a top.