First Test Of C-Wave Impulsive Structure
The market bottomed today, as was my posted expectation this morning. The question now is what this bottoming represents.
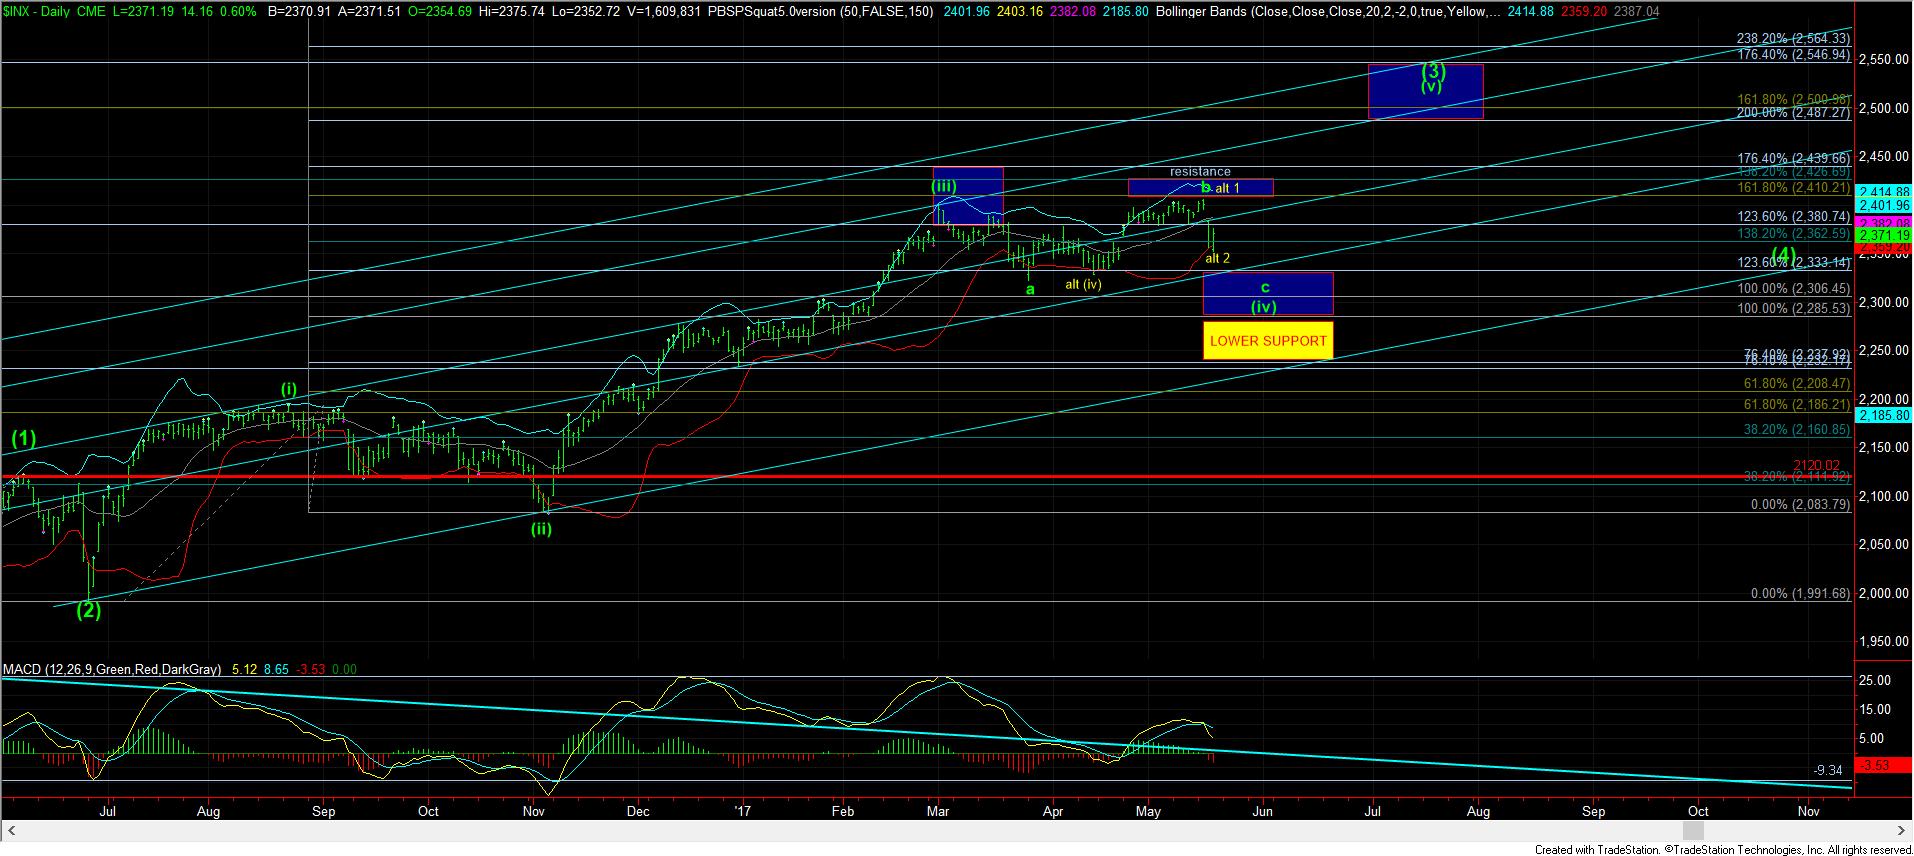
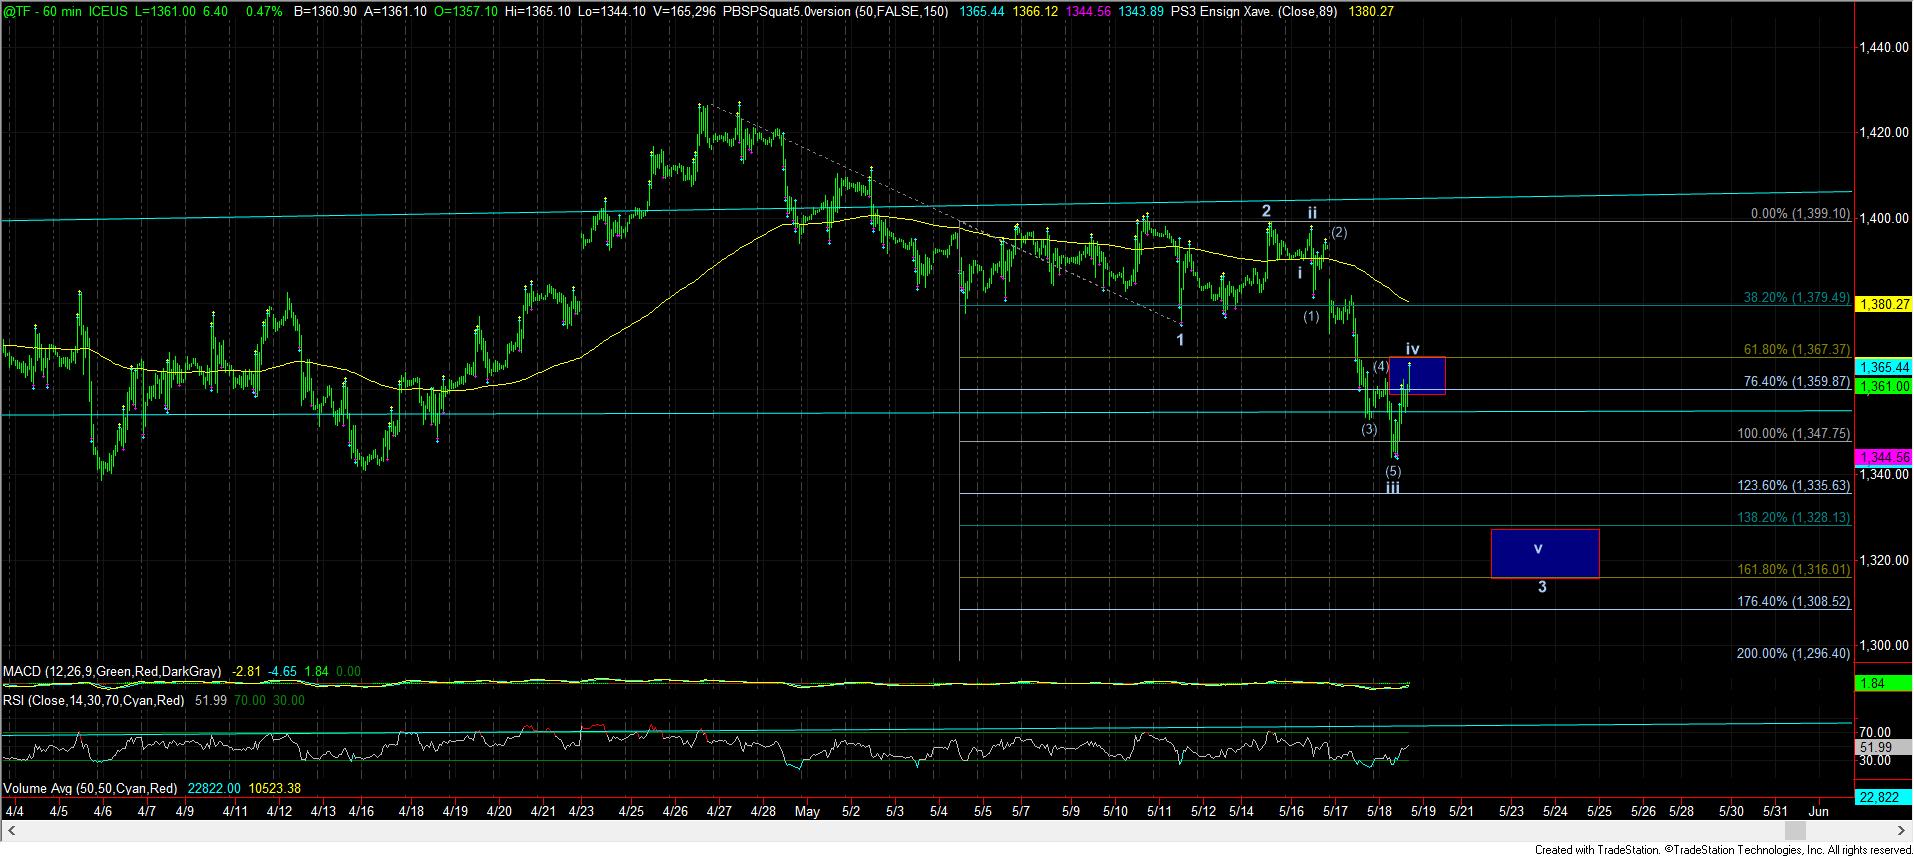
When I review the TF and SPX charts, the most consistent count would make this rise wave iv of wave 3 in the c-wave lower. However, that would mean that the upside should be quite limited as I write this.
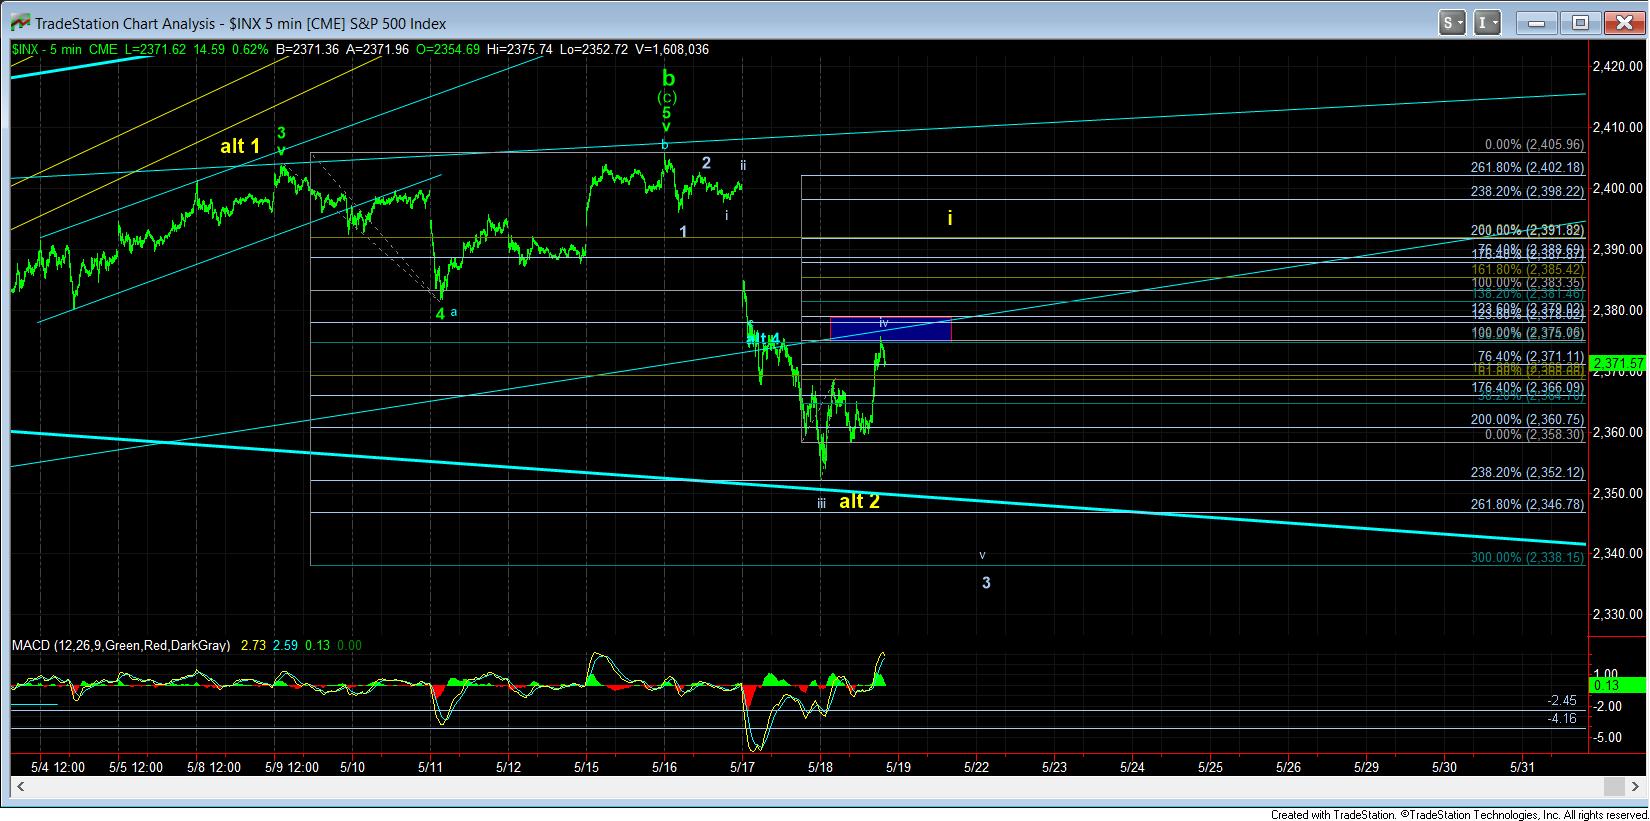
Moreover, the 2368SPX level is an important signal point right now. You see, as long as the market holds 2368SPX, it CAN prove the alternative count in yellow by rallying up to the 2392SPX region in a 5 wave move for wave I of wave 3, pointing us over 2500SPX in this structure. But, as I noted, that is only my alternative count, and it must be proven with that type of price action.
However, should we turn back down below 2368SPX with a micro impulsive pattern, it would suggest we will likely be heading lower tomorrow to complete the wave 3 of this c-wave in wave (iv).
So, for now, I view the market as maintaining pressure down to complete the c-wave of (iv) in a standard impulsive structure. However, if that impulsive structure does not follow through, then we may have to consider this can morph into a 4th wave triangle, which can easily take us into June until it completes.
For those looking at this as a big 1-2 downside in the c-wave of (iv), in my humble opinion, this seems a bit too big for that structure, and the IWM pattern really does not fit that well, especially when considering the larger degree levels for wave (iv) targeting, as well as the Fibs we have been striking on the way down.
But, again, please keep in mind always that this is still a bull market, and in a 4th wave correction, we can see many different twists and turns, as there is nothing that MUST occur in 4th waves, other than providing some form of consolidation pattern.