Finally, A Pullback - Market Analysis for Feb 24th, 2020
With the market unable to break out through resistance over the last two weeks, though it tried many times, we have now stretched the opposite direction and have broken upper support rather quickly.
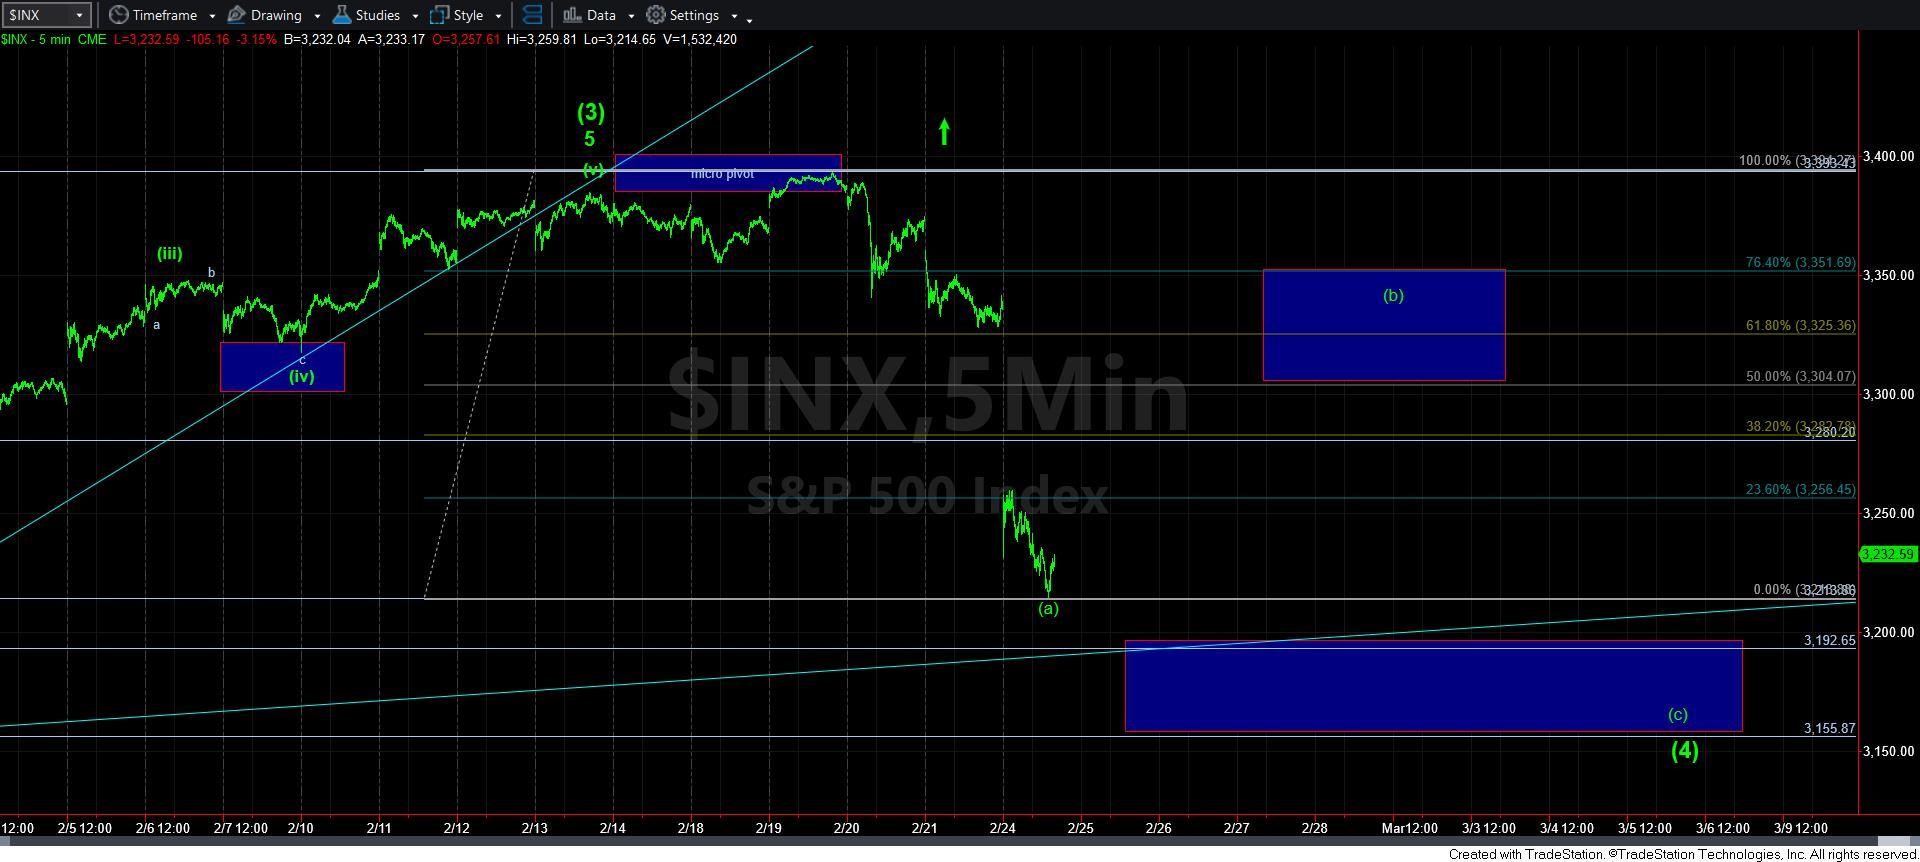
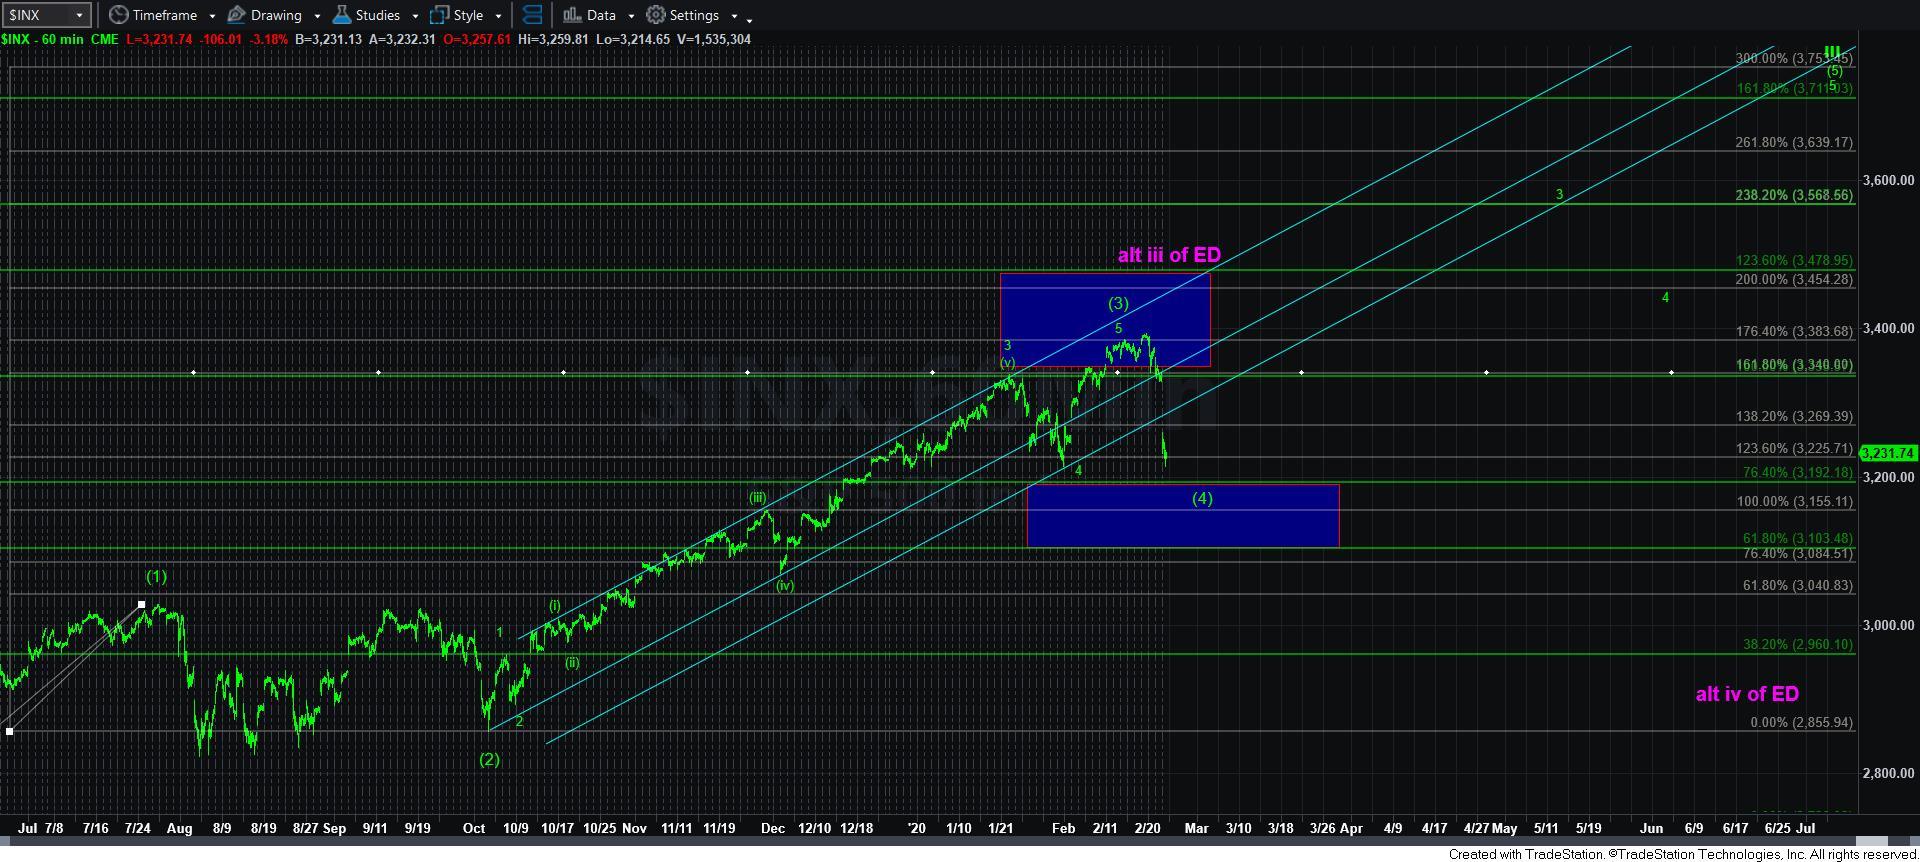
So, now that we have broken below 3280SPX, this has modified our primary expectation, as we now view this decline as a wave [4] within this larger degree wave iii in the SPX. You can see this most clearly on the 60 minute SPX chart.
If you remember, the ideal target for wave [4], of which we came up short in January, is the 3155-3192SPX region. And, we now have another opportunity to strike that target for wave [4] in the SPX.
Now, to be honest, I would much less prefer a direct move down into that support region for this 4th wave. Rather, I would much prefer that the decline today would be viewed as the [a] wave of wave [4], with a [b] wave rally taking us higher this week, setting up a [c] wave down into our ideal target zone below. Due to the depth of today’s decline, I cannot say that this is a very high probability pattern to me just yet, as we would need to get back over 3280 to make that a higher probability. That means that as long as we remain below 3280SPX, we may be targeting our support region in a more direct fashion.
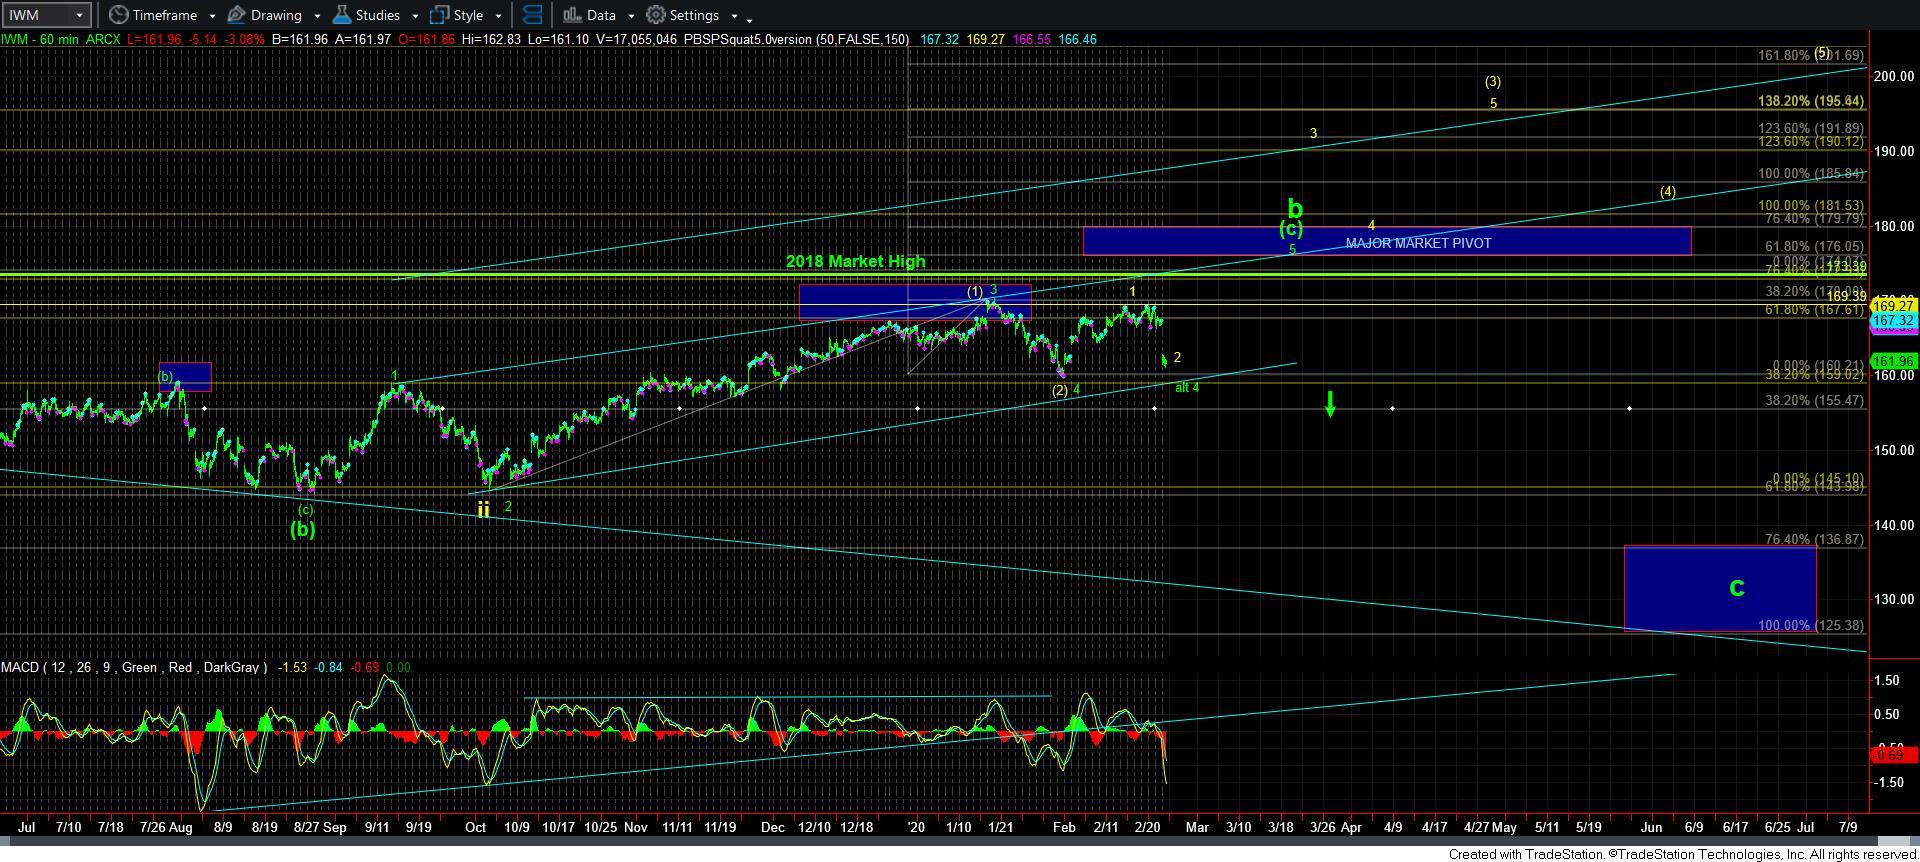
Let’s move over to the IWM chart. Clearly, the immediate break out structure we were tracking last week broke down. It is for this exact reason that I do not trade 3rd waves aggressively until they actually confirm and trigger. And, as we were outlining last week, we never confirmed that move.
So, the question on the table is how do we view this decline today? Well, technically, it still can be the yellow wave 2, as shown on the 60-minute IWM chart. However, I think it may be more likely that it is either a wider wave [2] in yellow, or a 4th wave flat within the green count. The main support region is at the 159 level now. And, as long as the IWM remains over the 159 region, I can reasonably expect a rally back up to the 173/74 region under both of these counts. And, as I have been highlighting for the last several weeks, the manner in which the market reacts up there will determine if we are going to see that bigger c-wave down in the IWM, or if we will finally see that “catch-up” move higher in the IWM.
However, if the IWM is unable to hold that 159 region, it would be a strong warning that the c-wave down may already be in progress. So, clearly, this chart would be a in a very precarious posture should we break below 159.
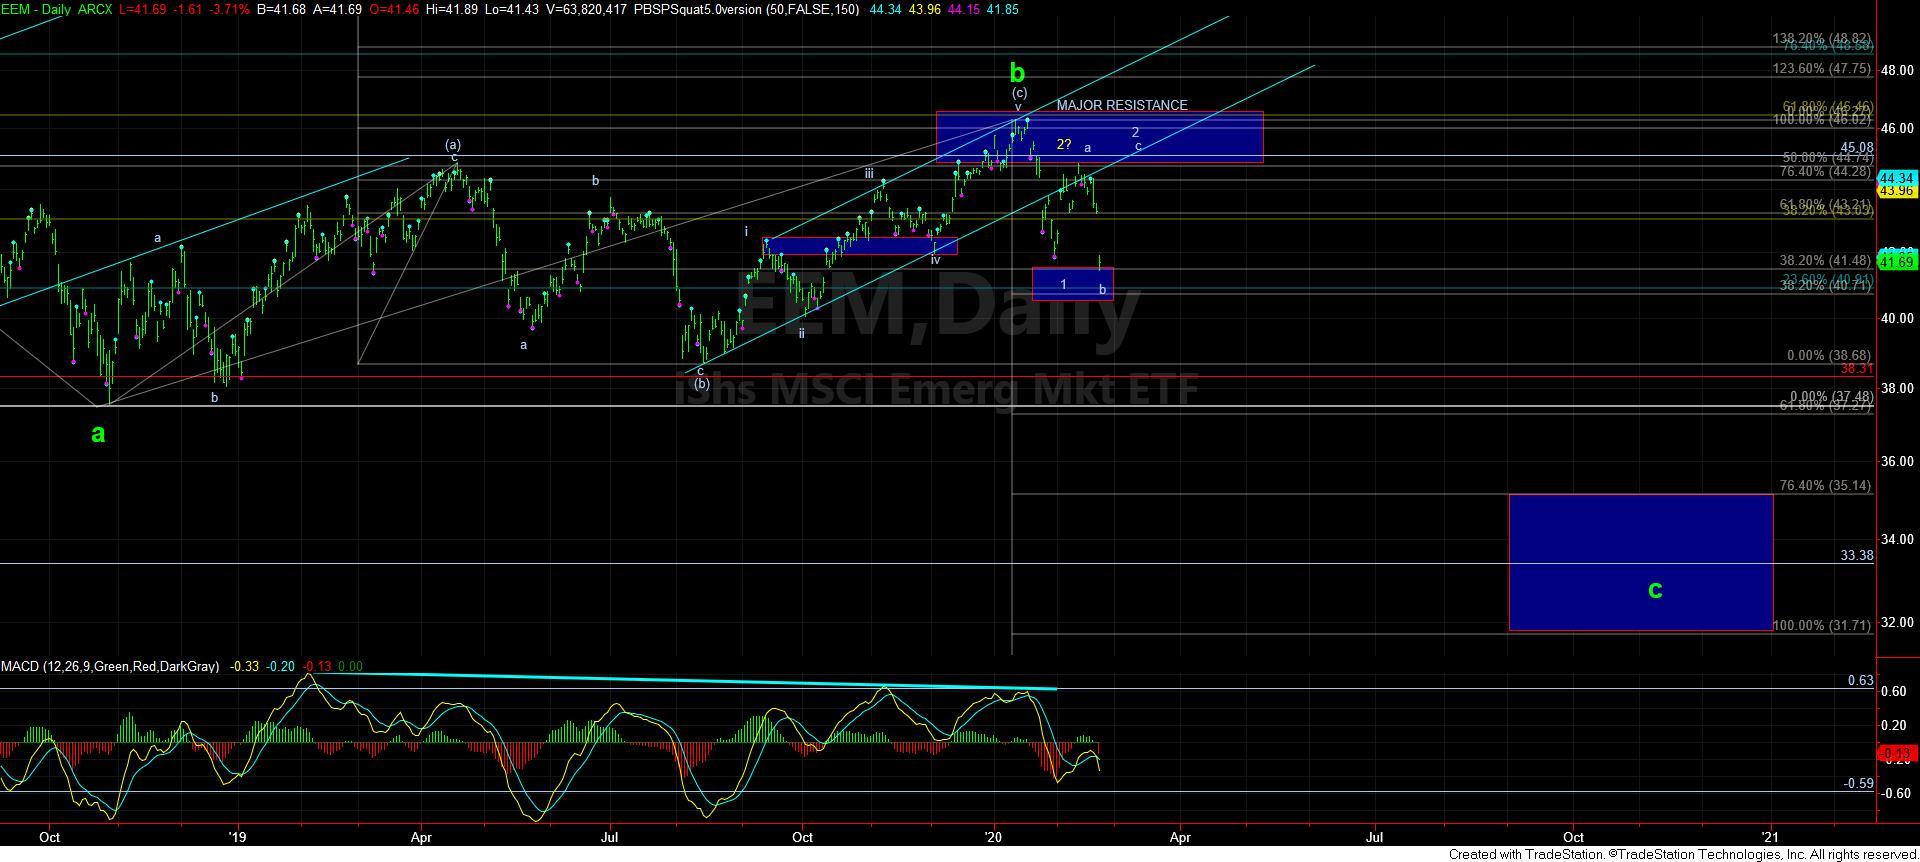
Along the lines of the precarious posture presented by the IWM is the EEM chart. I have presented this chart several times in the past, but I think it is time to present it again. You see, the IWM completed a text-book (a)(b)(c) rally for a b-wave right into a major resistance region. Since that high was struck, we experienced what counts well as a 5-wave decline. And, thus far, we have only seen a further corrective move higher back to that resistance region. With today’s decline, it could suggest that a wave 2 retracement may be completed, and the EEM has begun its decline in its c-wave lower. However, I would much prefer a more expanded wave 2, as shown on my chart. Yet, if we see a break down below the smaller blue box support which was on the chart for a wave 1 target, then it would be a strong warning that the c-wave down may be in progress sooner rather than later.
While the stronger chart – the SPX – is still holding its support rather well, we are starting to see warning signals from other areas of the market. While my preference is to remain bullish as long as we hold over the 3155SPX region, I cannot ignore the warning signs we may be seeing elsewhere, especially if the SPX breaks down below 3155, and follows through to the downside below 3100SPX. But, for now, that is not my expectation. So, I am approaching this as a buyable dip. And, as long as we remain over 3155SPX, I can maintain a very reasonable bullish bias in the bigger degrees.