Filling In The Diagonal
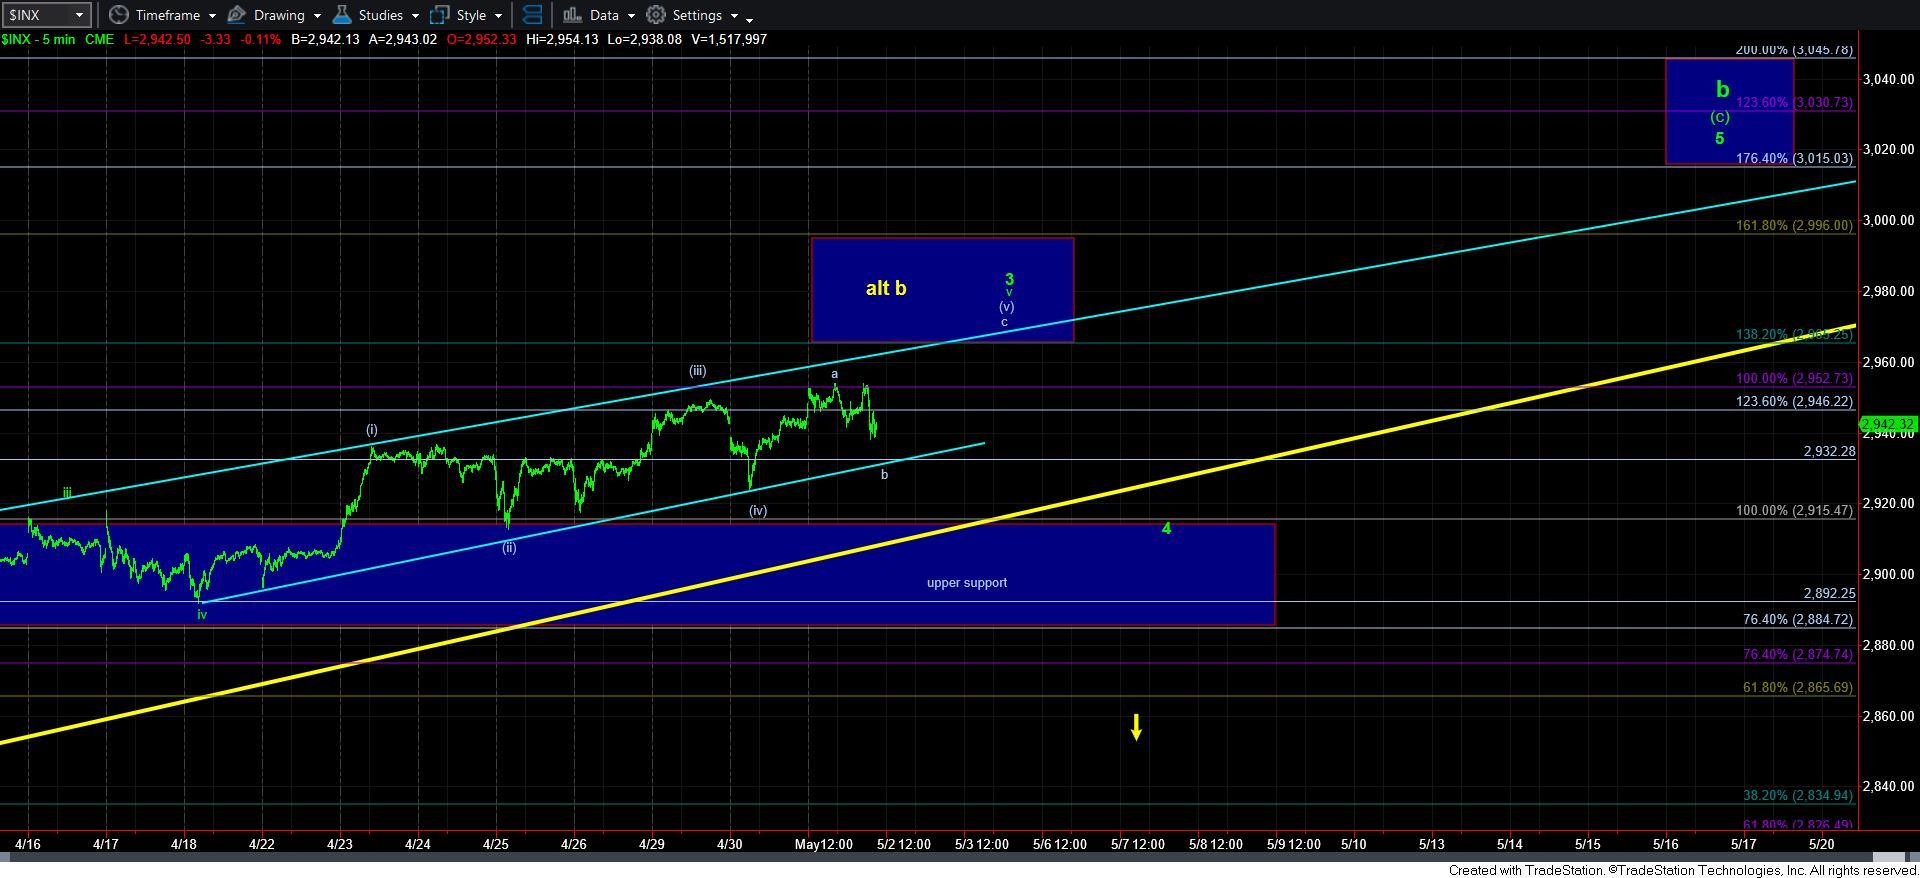
As highlighted yesterday, it seems the market is tracing out an ending diagonal to complete wave v of 3, as shown on the 5-minute chart. Most specifically, it would seem that today’s high represents the a-wave of wave [v] in that ending diagonal, with today’s pullback representing the b-wave of that wave [v]. This means we “should” still see one more rally up towards the 2965SPX region to complete wave v of 3. And, as long as we hold over yesterday’s low, that remains my expectation.
But, as I warned yesterday, we will likely continue to see this type of whipsaw, as we complete wave v of 3, and then likely begin a wave 4 pullback, also as shown on the 5-minute chart. So, I don’t think we are quite yet done with the market volatility.
In the broader sense, upper support remains between 2884-2915SPX, and as long as we remain over that support, the market still has a pattern in place to take us to 3011-45SPX.