Feeling Around For The Bottom Of The a-Wave
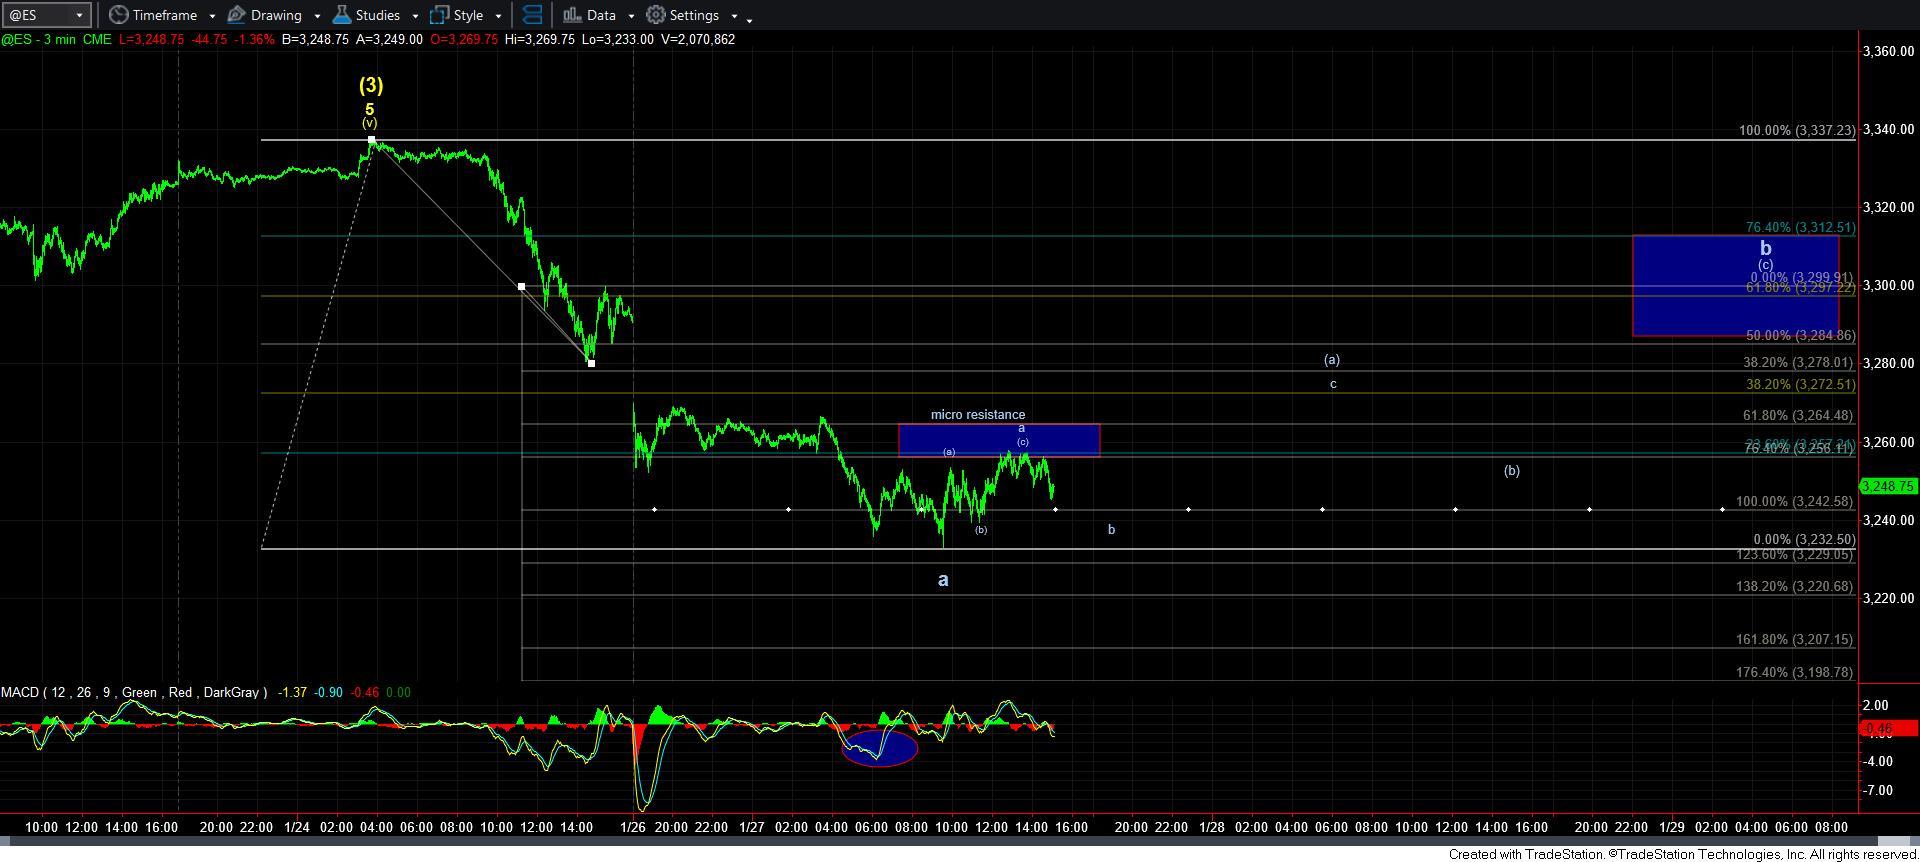
As outlined over the weekend, the ideal target for this a-wave decline is in the 3225 region. We came quite close today with the market hitting a low just over the 3230 region. So, the question is if this a-wave bottom has been reached?
I have outlined a potential micro path on the attached 3-minute ES chart, with the assumption that the a-wave bottom has been struck. But, the market is going to have to move through the micro-resistance box to make this much more likely. Moreover, if we are unable to move through the resistance noted, then it still leaves the door open for a lower low before this a-wave completes.
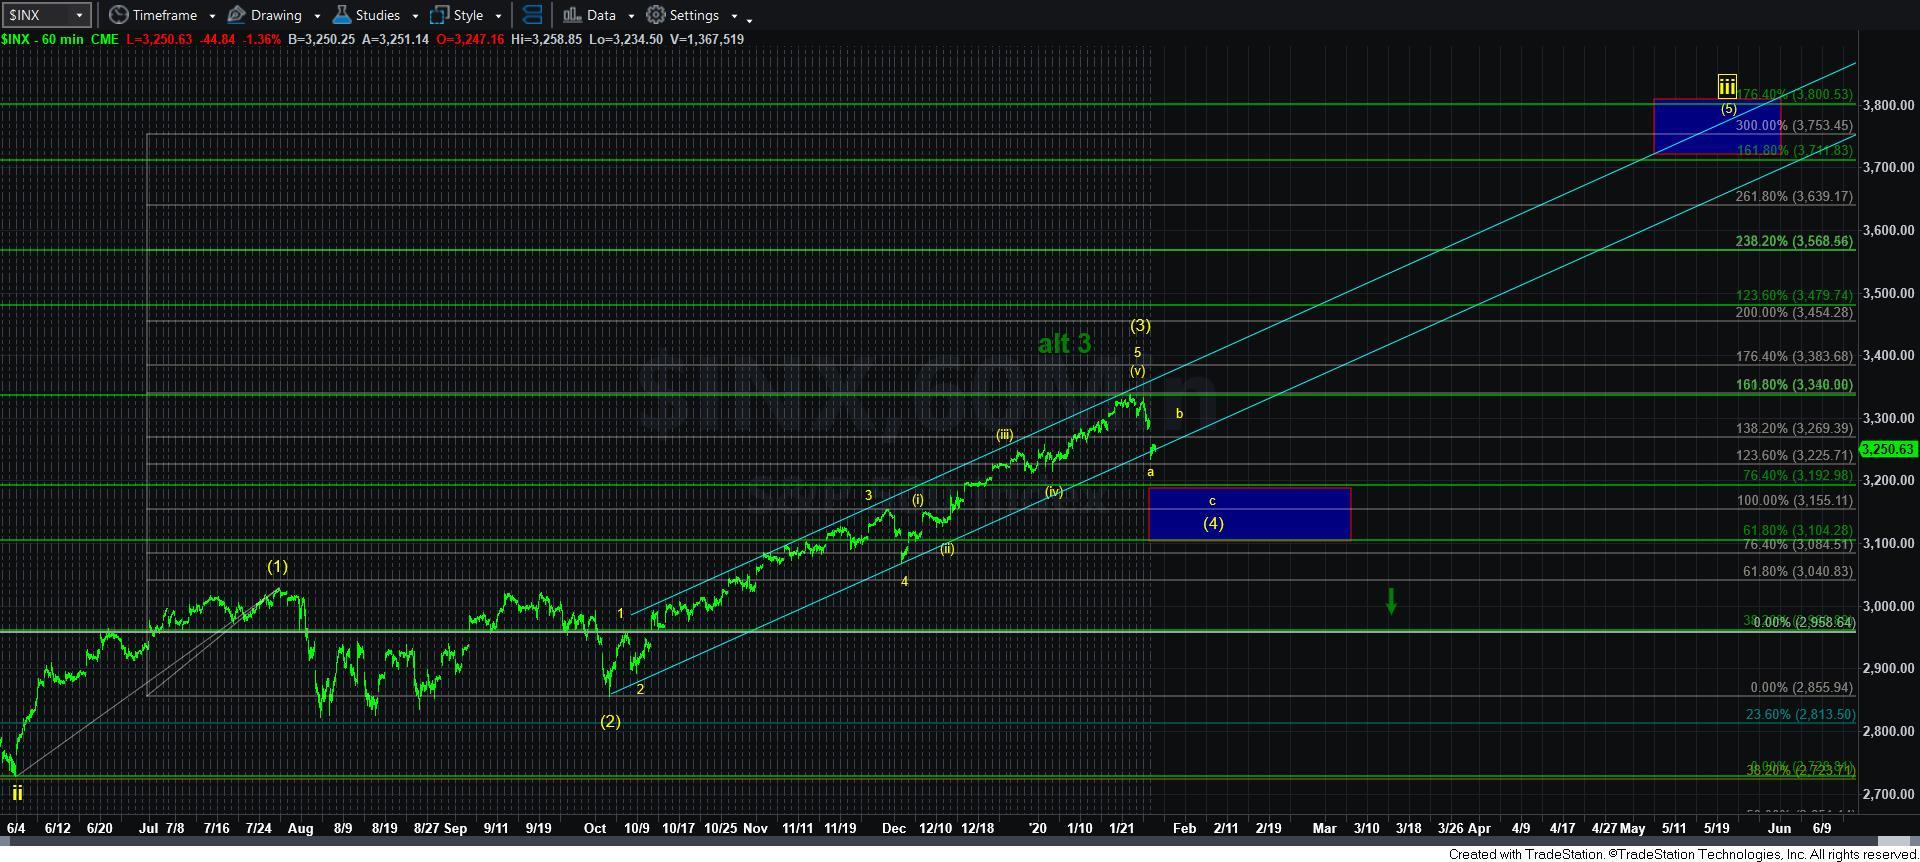
I also want to take a step back and review the larger degree expectations, as outlined on the 60 minute chart. As long as the market remains over the 3100SPX region, I have to view this as a wave (4) within wave iii, as shown. It would take a break down below 3100SPX to suggest that something else is in play, and that our targets north of 3800SPX may be pushed off by at least a year or two. For now, I am tracking the yellow count, and if we see a corrective a-b-c structure as outlined, then it would be an opportunity for a long trade as the c-wave decline completes 5-waves down towards the 3100-3155SPX region.