Fall 2018 Redux?
When I review the substructures within the rally off the December 2018 low, I have yet to find a completed 5-wave structure that provides a clear perspective. And, with the drop we experienced today, that may happen yet again. But, without some clear 5-wave structure within this pattern off the December 2018 low, it is hard to be confident of a top being in place.
So, I am going to simply present to you my thoughts of the structure, and I cannot say I have a strong preference at this time, other than maintaining a posture of caution until the markets makes things a bit more clear in the shorter term. But, w ithout the market having provided us with a CLEAR 5-wave decline off the recent highs, I am left with many questions regarding where we now reside as I am writing this update.
Therefore, I want to provide you with my overall thoughts on what I am seeing at this time.
First, I want to note that, normally, c-waves provide us with 5-wave structures. That is what I have been looking to complete before this [c] wave of the b-wave was likely completed. Therefore, as we have been tracking this rally, I have been looking for that 5-wave structure to mark the completion of this c-wave rally. Yet, the depth of this drop today has made it unclear as to whether we will see that 5th wave higher or not. The drop is much lower than one would normally see in a 4th wave within that structure, unless it was an ending diagonal, or simply only wave iv of wave 3. Allow me to explain.
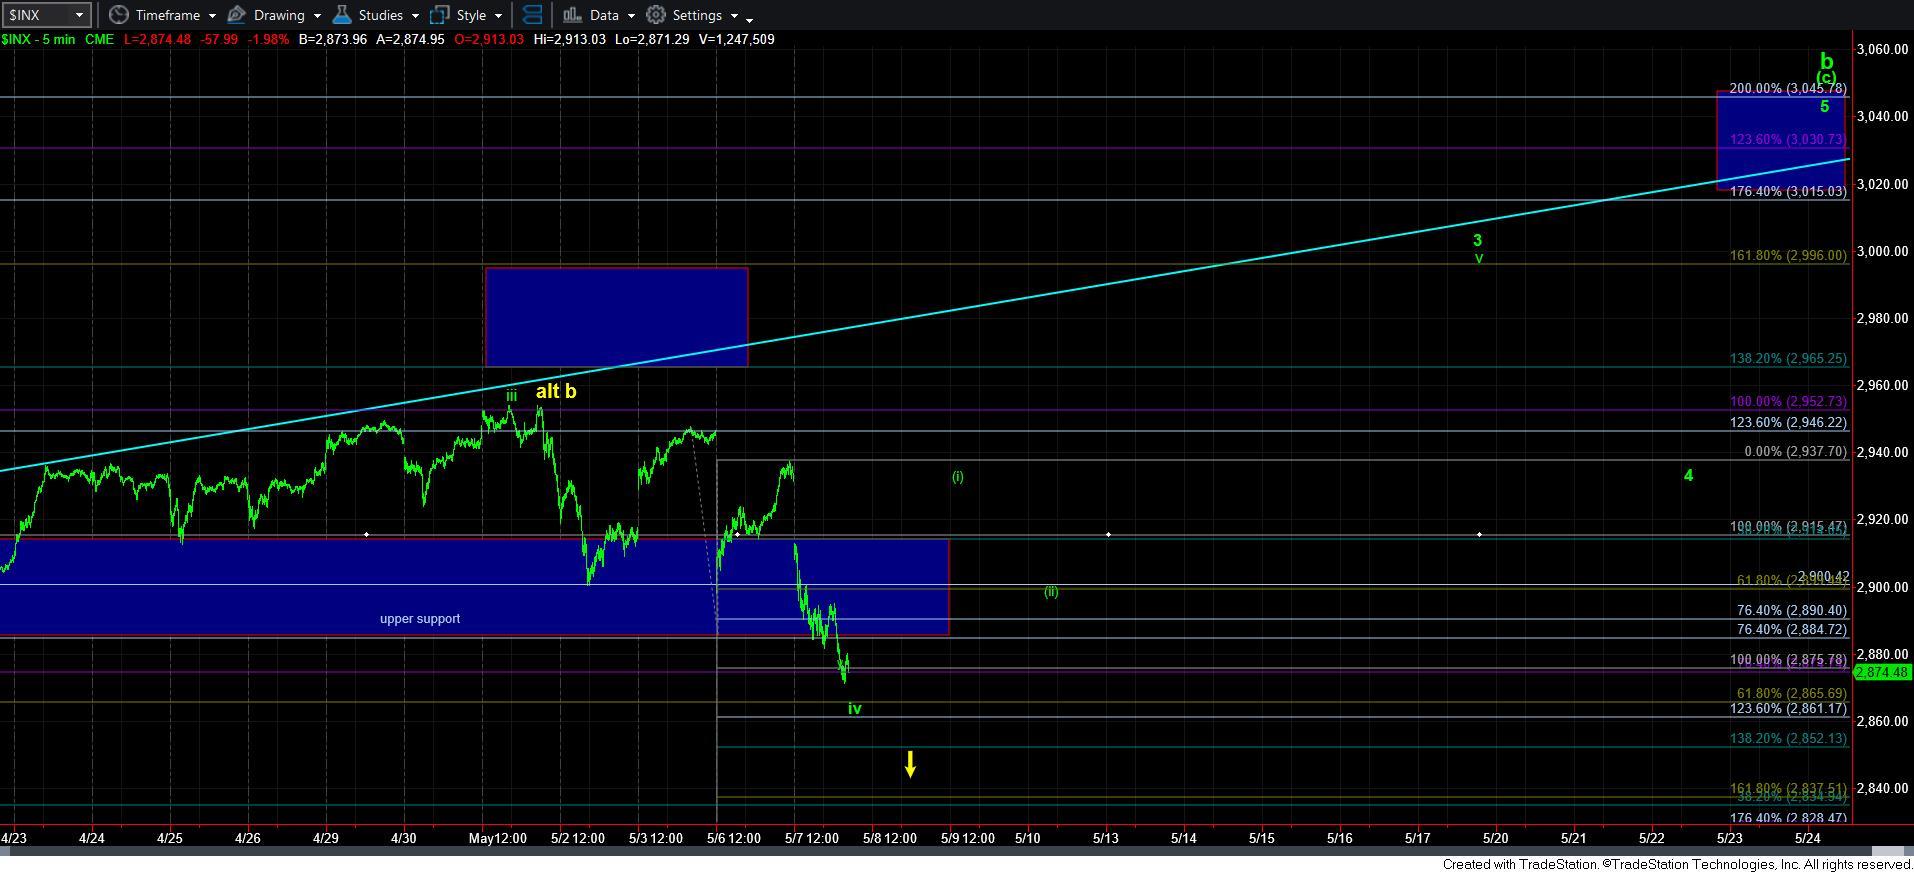
Based upon the structure we have been following, the market topped below its 1.382 extension and just above the 1.236 extension of waves 1 and 2 off the March lows, and has now broken down below the .382 standard retracement for what we normally see in a 4th wave. There are only two ways I can view this as still within a bullish structuring pointing to 3000+ still.
The first is the ending diagonal pattern, which we have discussed before, but which would likely need a drop down to the 2850SPX region to get the overlap we normally see in a diagonal between waves 1 and 4. In fact, the 3rd wave in an ending diagonal often targets the 1.236 extension rather than the standard 1.382-1.618 extension. So, this would make sense in this instance as to why we topped where we did thus far.
The other potential would view this drop as only wave iv of 3 – and I am showing this on my 5-minute chart now for illustrative purposes The only reason I am even keeping this on my radar is because the high struck so far was just beyond the 1.236 extension of waves 1 and 2 off the March lows. And, this still would point us to the 3045SPX region for all 5 waves. But, in order to even consider this structure, I would need to see us hold over 2865SPX (.618 extension off waves 1 and 2) and provide us with a CLEAR 5-wave rally taking us back up towards the 2920 region, as shown in the possible (i) (ii) of wave v of 3. Again, I want to note that I DO NOT think this is a higher probability at this point in time, and the market MUST prove this potential with that CLEAR (i)(ii) set up. But, what has me considering it is the fact we did not hit our upper targets on the last rally. So, for now, this remains in the back of my mind, but I feel the need to at least address this potential due to the lack of a completed structure to the upside.
But, the break down below 2880SPX today MUST turn you more cautious about any further upside, and the market MUST prove its ability to take us to the higher targets we have on the chart. So, for now, caution should be the appropriate stance, as this whipsaw may continue, at least until the market provides us with a sustained break of 2850SPX to even make the ending diagonal scenario unlikely.
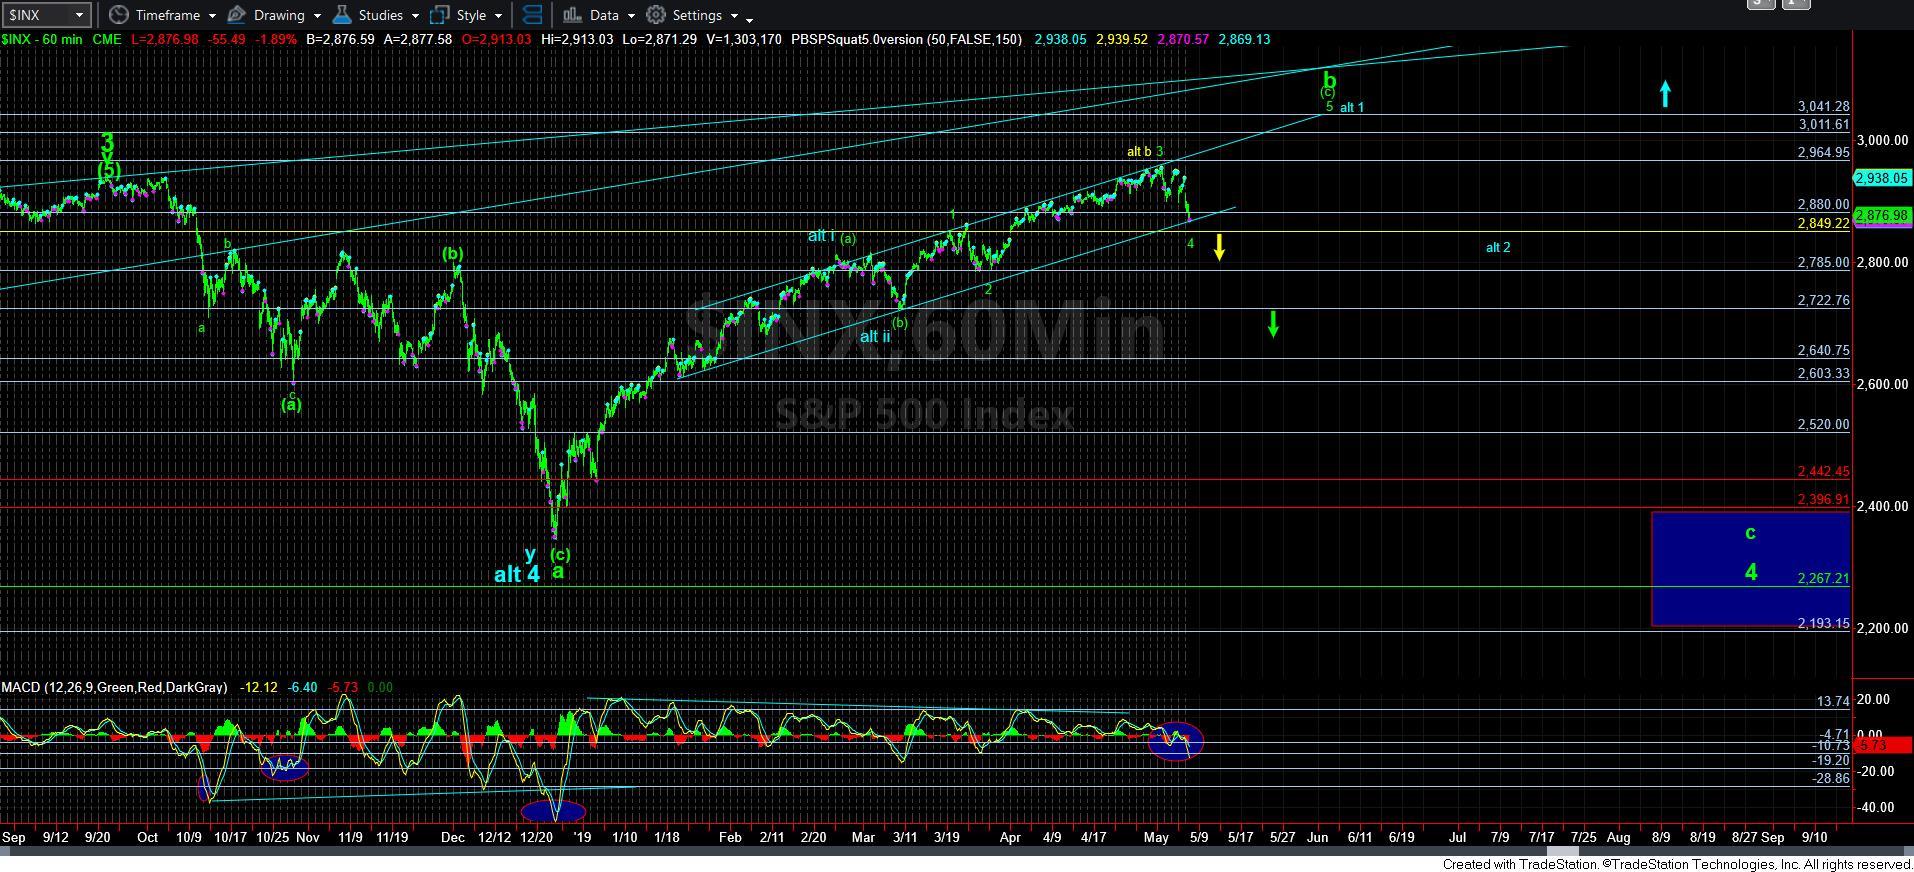
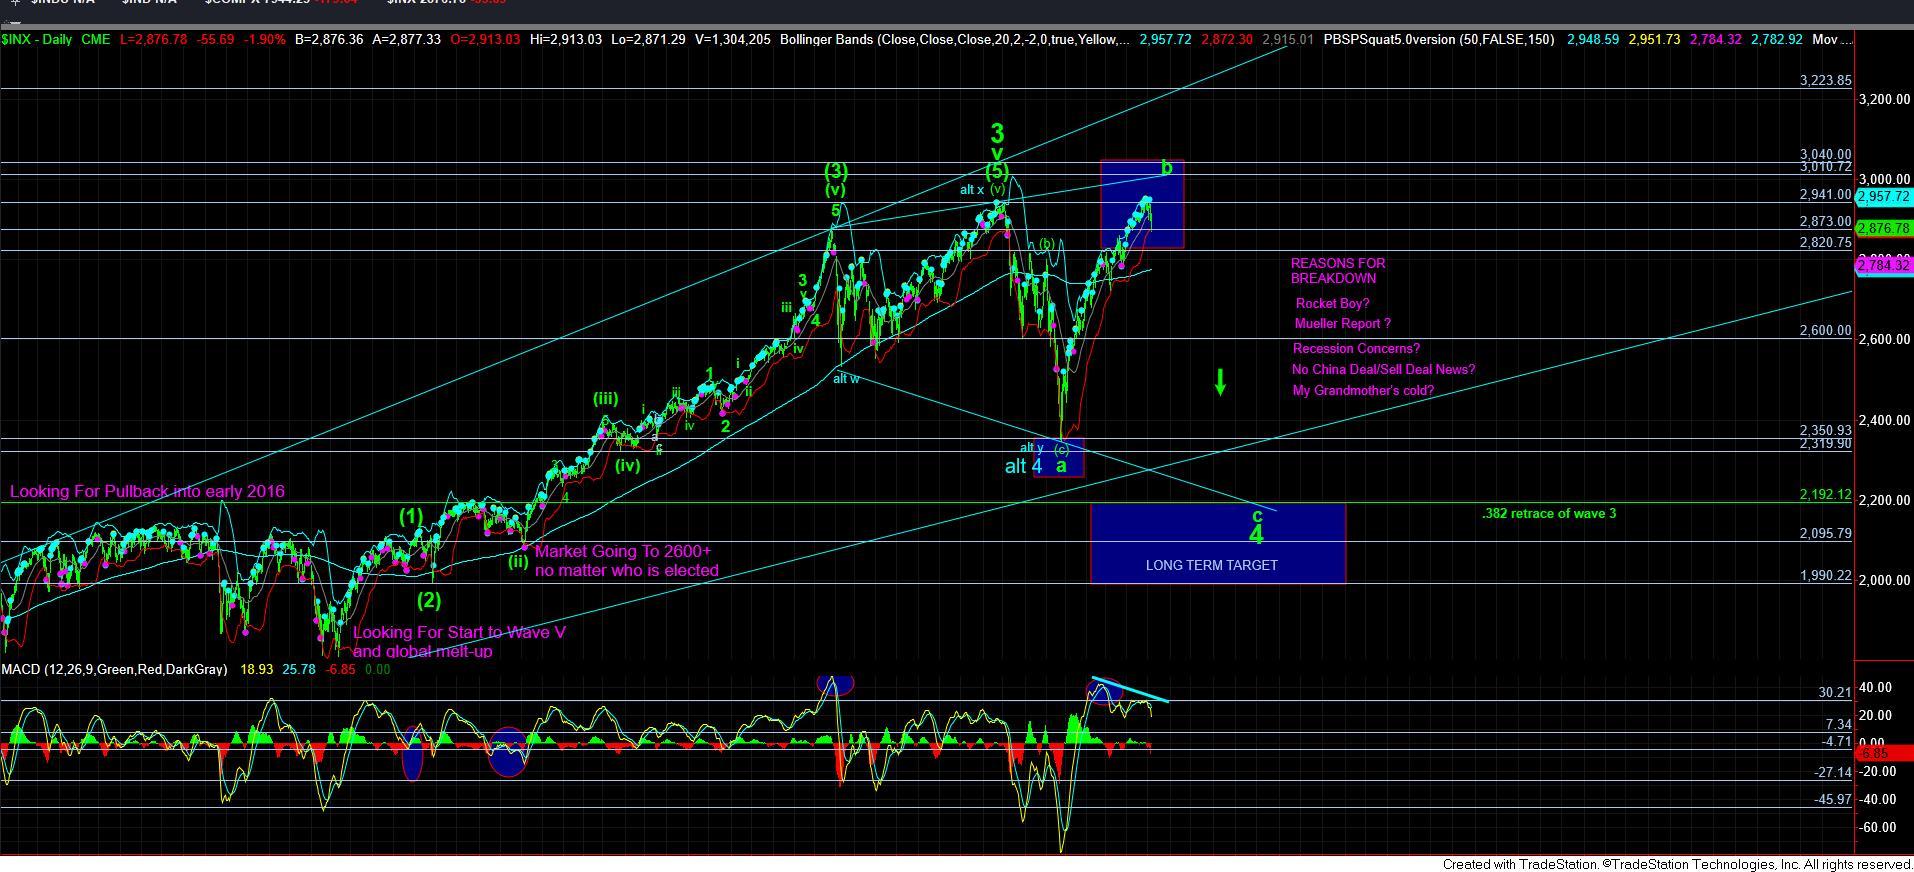
The other issue with which I am still struggling is that I do not have a clear impulsive structure down off the highs yet. This leaves me wanting for clear direction in the near term as to whether we have indeed topped. But, please do take note of the MACD on the 60 minute SPX and daily charts, as neither are suggestive of bottoming, but of the initiation of a bigger decline.
In our bigger picture, I am still of the perspective that the downside potential presented by our primary count is significantly higher than any potential upside, even if the market is able to prove itself to want to still strike those levels. But, I will warn in a similar way I did back in the fall of 2018 that the break of 2880SPX makes any further upside much higher risk. Should the market be able to prove otherwise with a CLEAR 5-waves up towards the 2920SPX region, then I will consider adopting the bullish count to the higher targets presented on the 5-minute chart. Until such time, I will keep it in the back of my mind.
However, if we can continue below 2850SPX in the coming days, it would certainly lend itself to the higher probability that the b-wave has topped, and we have begun the c-wave. The structure of the initial 5 waves down will likely clear itself up by then, and we can begin to analyze the market for a shorting set up as we develop that 1-2 down in the c-wave lower.