FINALLY, A Pullback - Market Analysis for Feb 7th, 2019
With the market finally breaking below upper support, we have now likely begun the pullback for which we have been eagerly waiting.
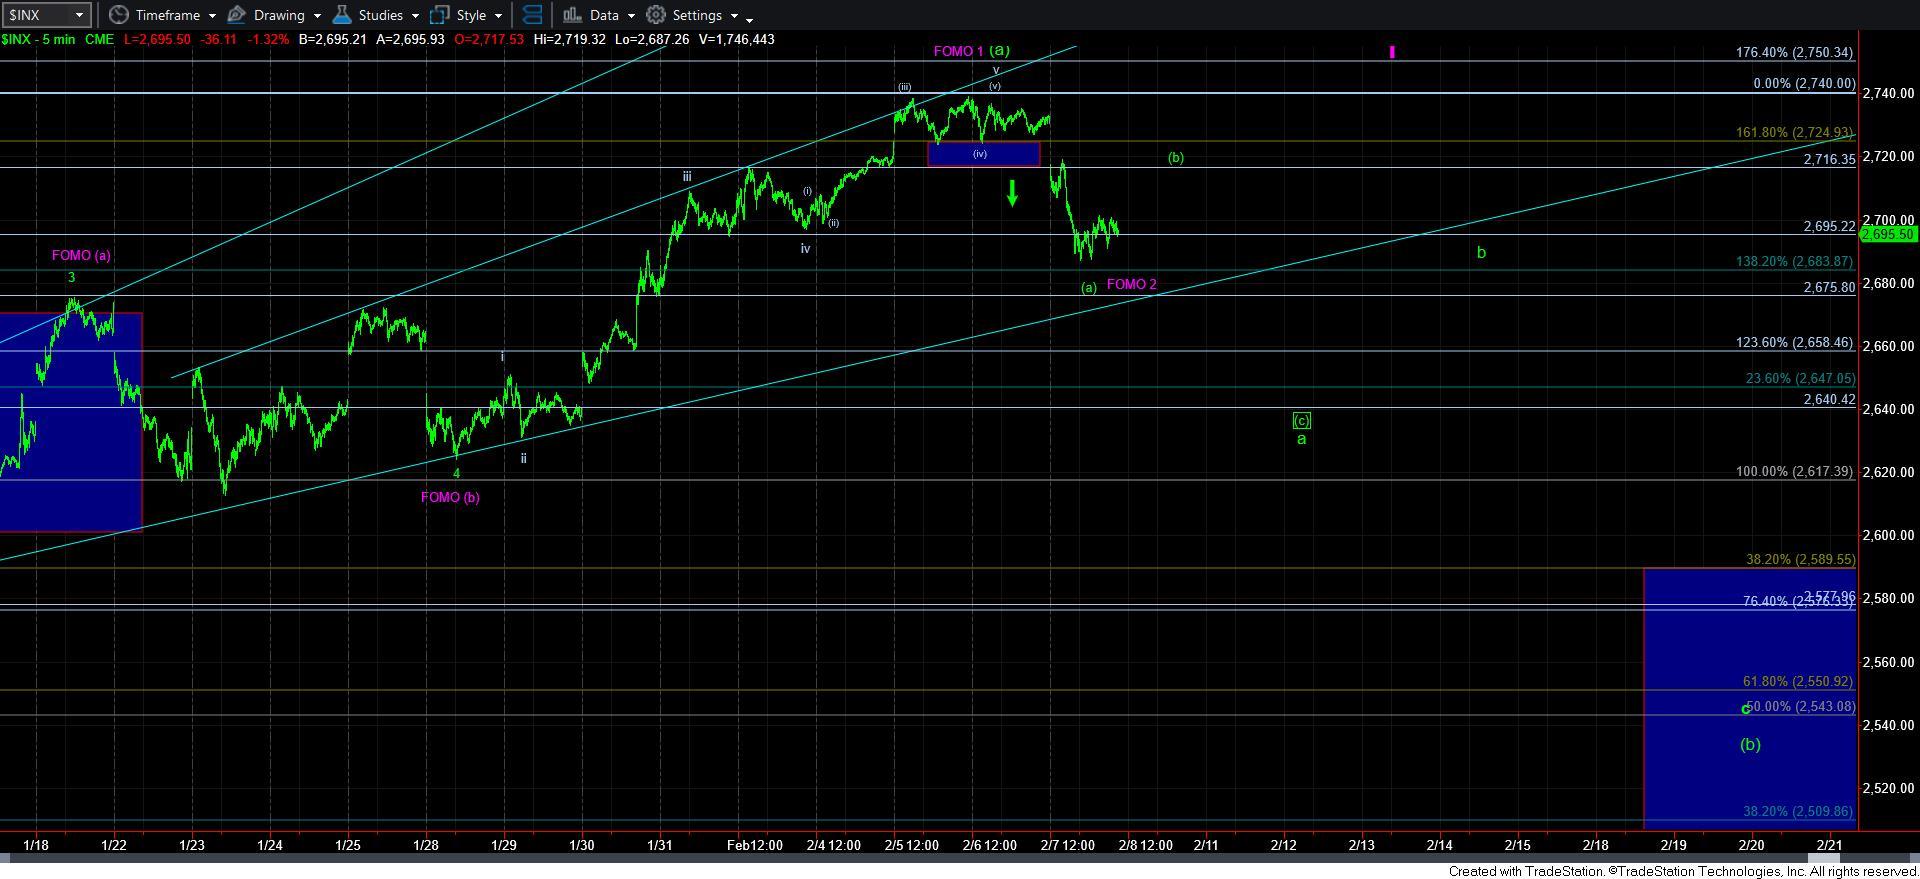
As noted yesterday, when the market broke 2715, it was our initial signal that the [b] wave pullback has begun. And, the micro structure suggests that today was the [a] wave within the a-wave of the [b] wave pullback, as you can see from the attached 5-minute SPX chart.
So, for now, my perspective remains unchanged.
As far as the bigger picture perspective, I am going to slightly modify my minimum target for the b-wave. I presented my thinking earlier today in an update, which I am reprinting below:
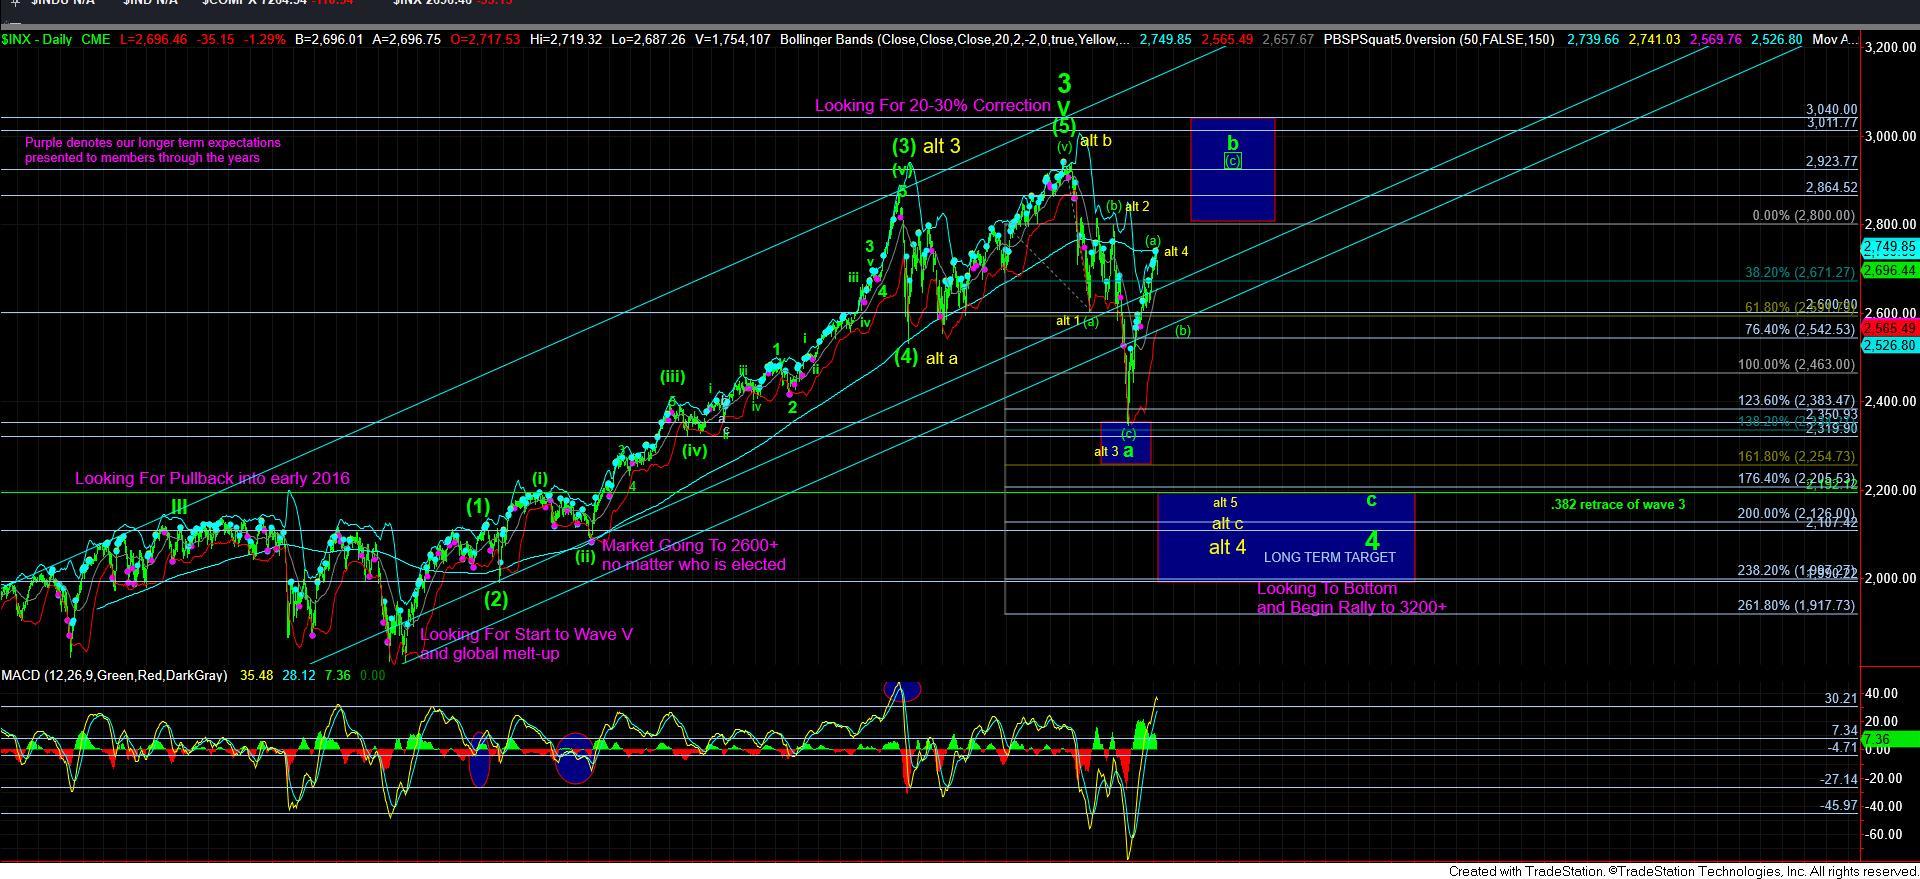
For those that have read my work for the last several months, I have remains rather steadfast in expecting a larger b-wave rally. My ideal minimum target was the 2800 region, with the potential to see the 3011-3040 region in that b-wave. And, I have explained my reasoning in many prior updates.
At this point in time, I have good reason to assume we will rally to at least the 2900 region, and we still retain the potential to rally as high as the 3011-3040 region. What will tell us the best target point will be how the (b) wave develops and the 1-2 set up in the c-wave.
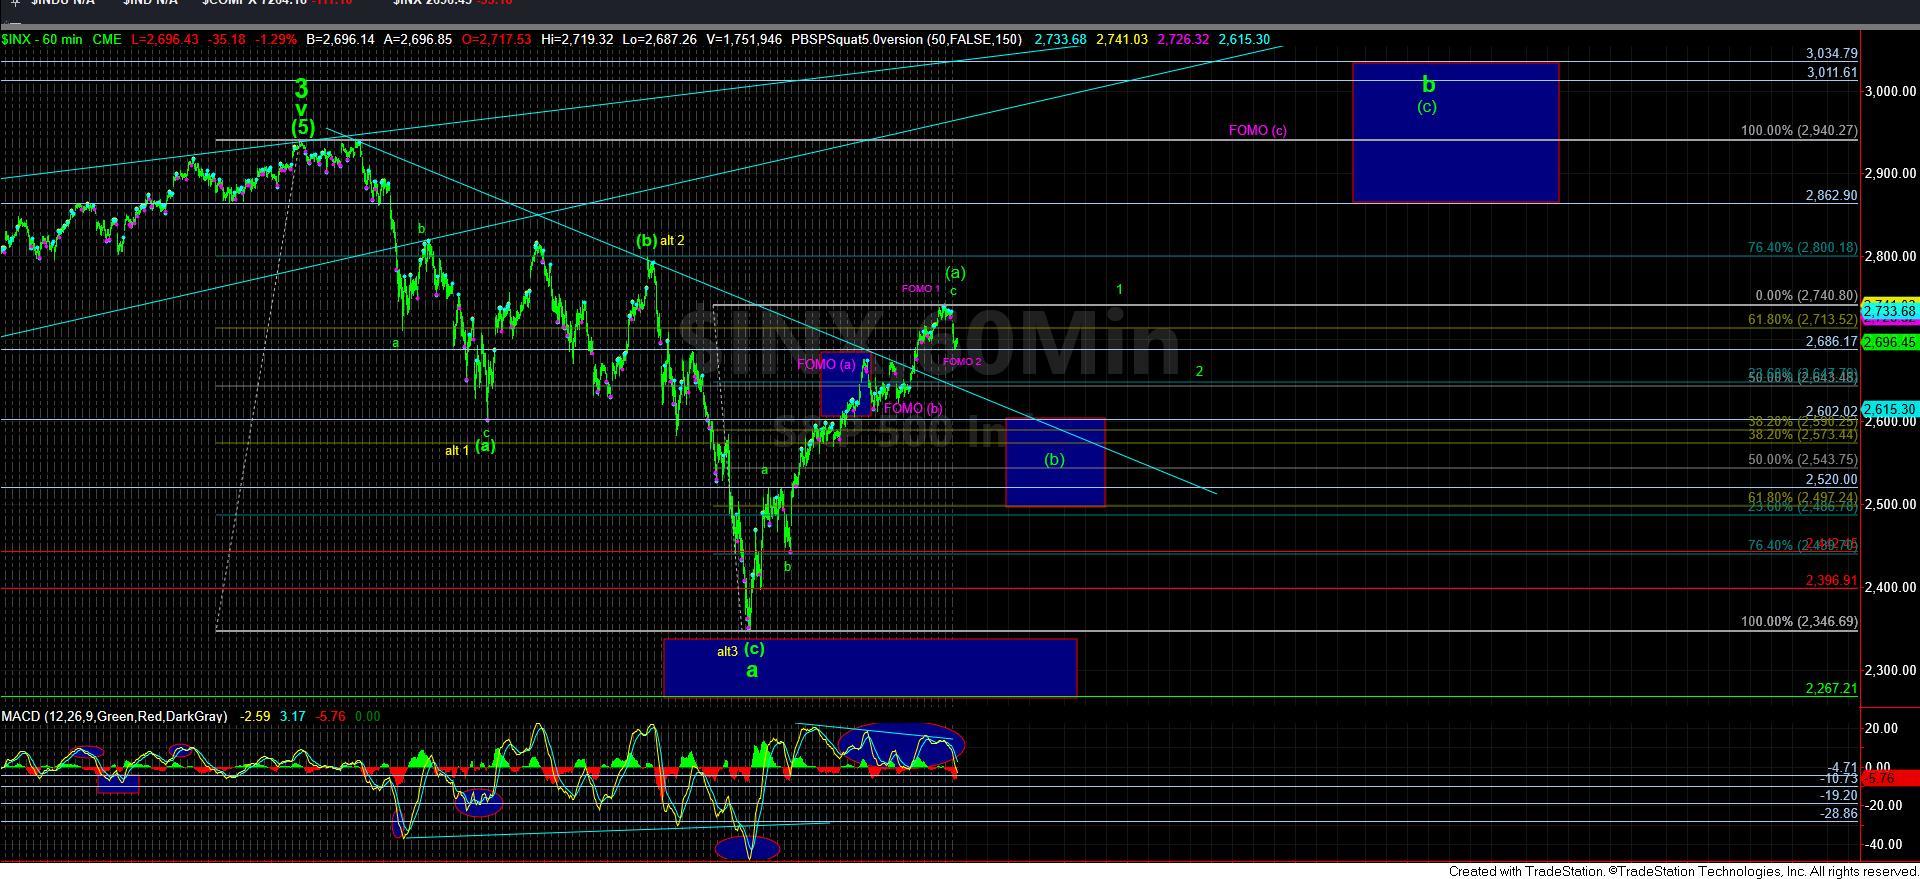
For example, if the FOMO count is operative (for now, it is an alternative), then the 1-2 in purple suggest we are pointing up to the 2940 region, wherein (a)=(c) as well.
However, in the green count, if the market holds the 2590SPX region (.382 retracement of the (a) wave), then we are projecting an (a)=(c) into that 3000 region target. And, once waves 1 and 2 are in place, we will be able to identify the 2.00 extension of that set up to define the confluence points to the top to the b-wave.
These are the factors I will be considering in the coming weeks. But, the commonality between patterns suggest that 2900 region should be a minimum target at this time. A break down on this pullback below 2500 would make me reconsider this potential.
So, the primary point I was attempting to make in that intra-day update is that, based upon how high this rally has taken us, I think we will see the 2900+ region before this b-wave tops. Should something occur that would change that expectation, I will be sure to alert you.
I also want to take a moment to provide a bit more clarity to the “FOMO” count presented with my purple count. First, I want to stress again that this is simply an alternative count at this time. Second, I want to stress again that this is simply an alternative count at this time. I am sorry for being so repetitive, but some of the questions I was getting about it seemed to be assuming this was my primary expectation.
So, third, the ONLY way I can even consider this potential is if we break out over the high struck this week. That would suggest this drop is a wave 2 pullback in the [c] wave, and point us to the 2940 region for all 5 waves for that [c] wave. In fact, holding support at 2690 for that wave 2 provides excellent confluence at the 2940 region which is the 2.00 extension for waves 1 and 2, which coincides with the [a]=[c] in the FOMO count to that same region. But, again, just because there is confluence does not force me to adopt it as my primary. This potential MUST be proven by a break out over this week’s high. Until then, it will remain an alternative.
That leaves me expecting the market to drop down to at least the 2600 region for the [b] wave pullback, with the potential to drop as low as the 2500 region if we see a deep [b] wave. But, again recognize that this would project us up to the 2900-3000 region wherein [a]=[c] from those regions.