Expecting Further Whipsaw - Market Analysis for Jun 29th, 2016
As I am sure you are all well aware, the analysts at EWT expect that this bull market has not likely ended. Rather, we are expecting much higher levels to be seen when this correction has run its course. The only question is when the correction will have run its course.
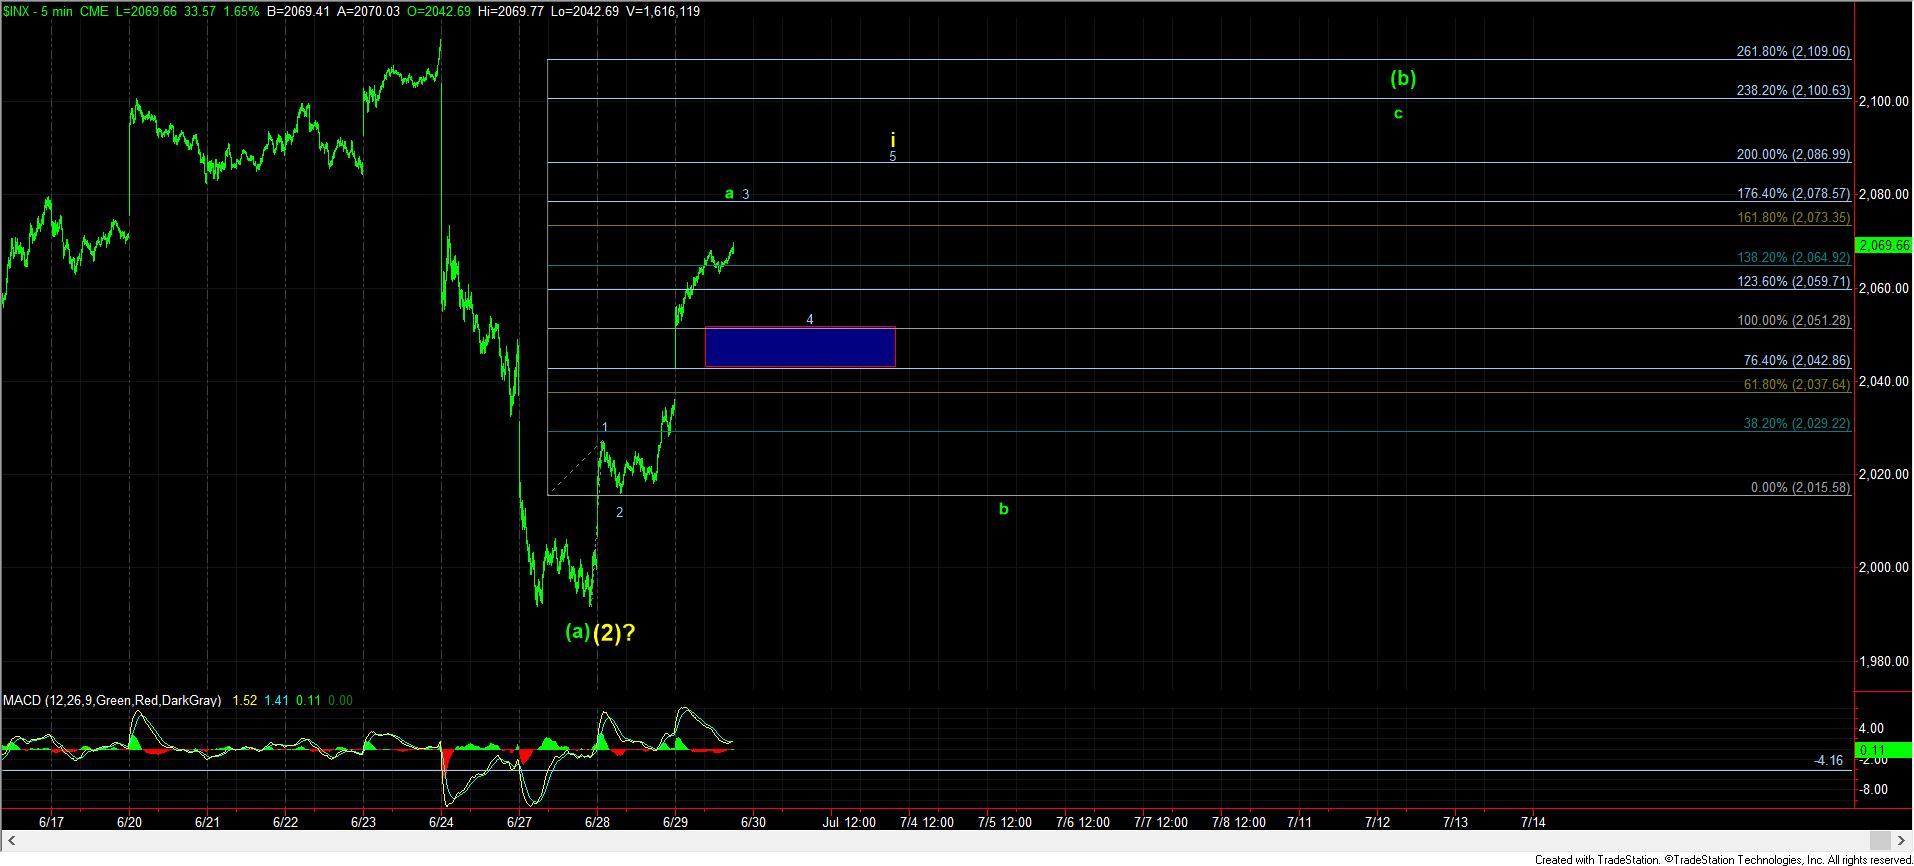
As some of our analysts have noted, it is quite possible that all of wave (2) has been completed at this past week’s lows. However, for me to adopt that perspective as my primary, I would need to see all 5 waves higher filled out, as shown on the attached 5 minute chart, followed by a corrective pullback and break over the high of this 5 wave move. Until such time, my primary count will maintain its corrective perspective.
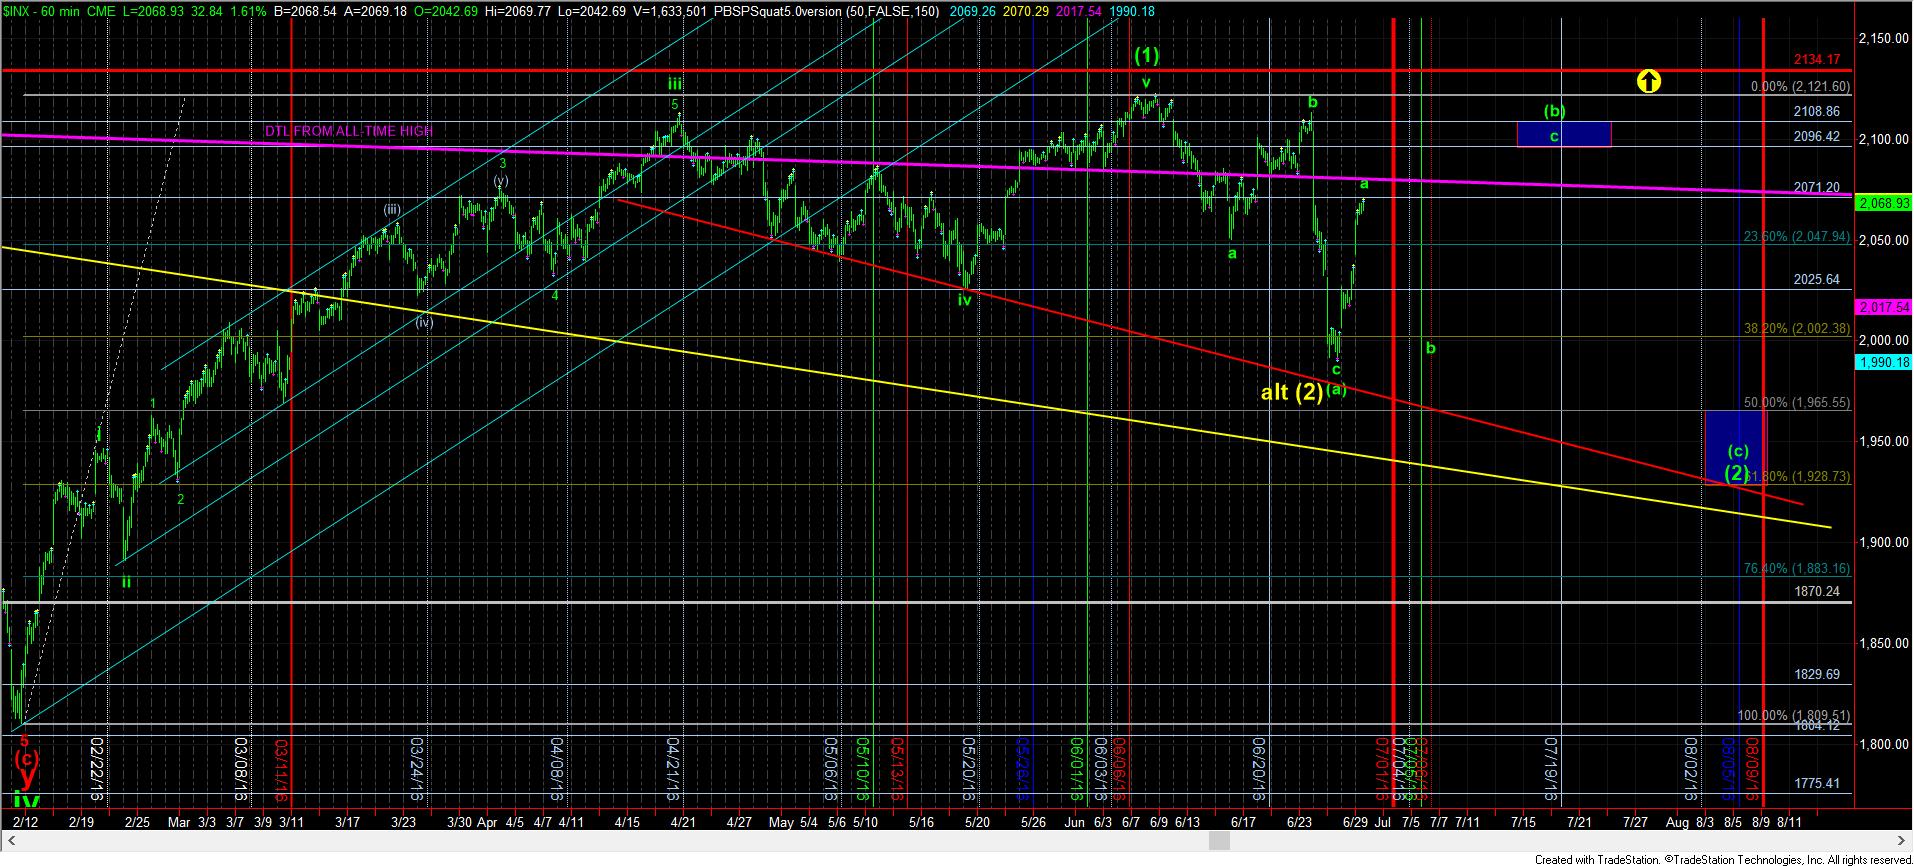
That being the case, today’s action has provided strong evidence that the (a) wave has likely bottomed. However, (b) waves are not often as straight forward as a simple rally. Moreover, since the (a) wave took almost 3 weeks, I do not think that a two day (b) wave would normally suffice. For this reason, I expect a much more complex (b) wave, as shown on the charts.
Also, the market may even want to take us as high as the 2096-2108SPX region to complete this (b) wave. At 2096SPX, we would have an (a)=(c) into the .500 retracement at 1965SPX, whereas a drop from the 2108SPX level to the .618 retracement at 1928SPX represents a (c)=1.382*(a). This type of confluence forces me to maintain an open mind that the market can still see higher levels, but, ideally, with a bigger b-wave pullback to be seen first.
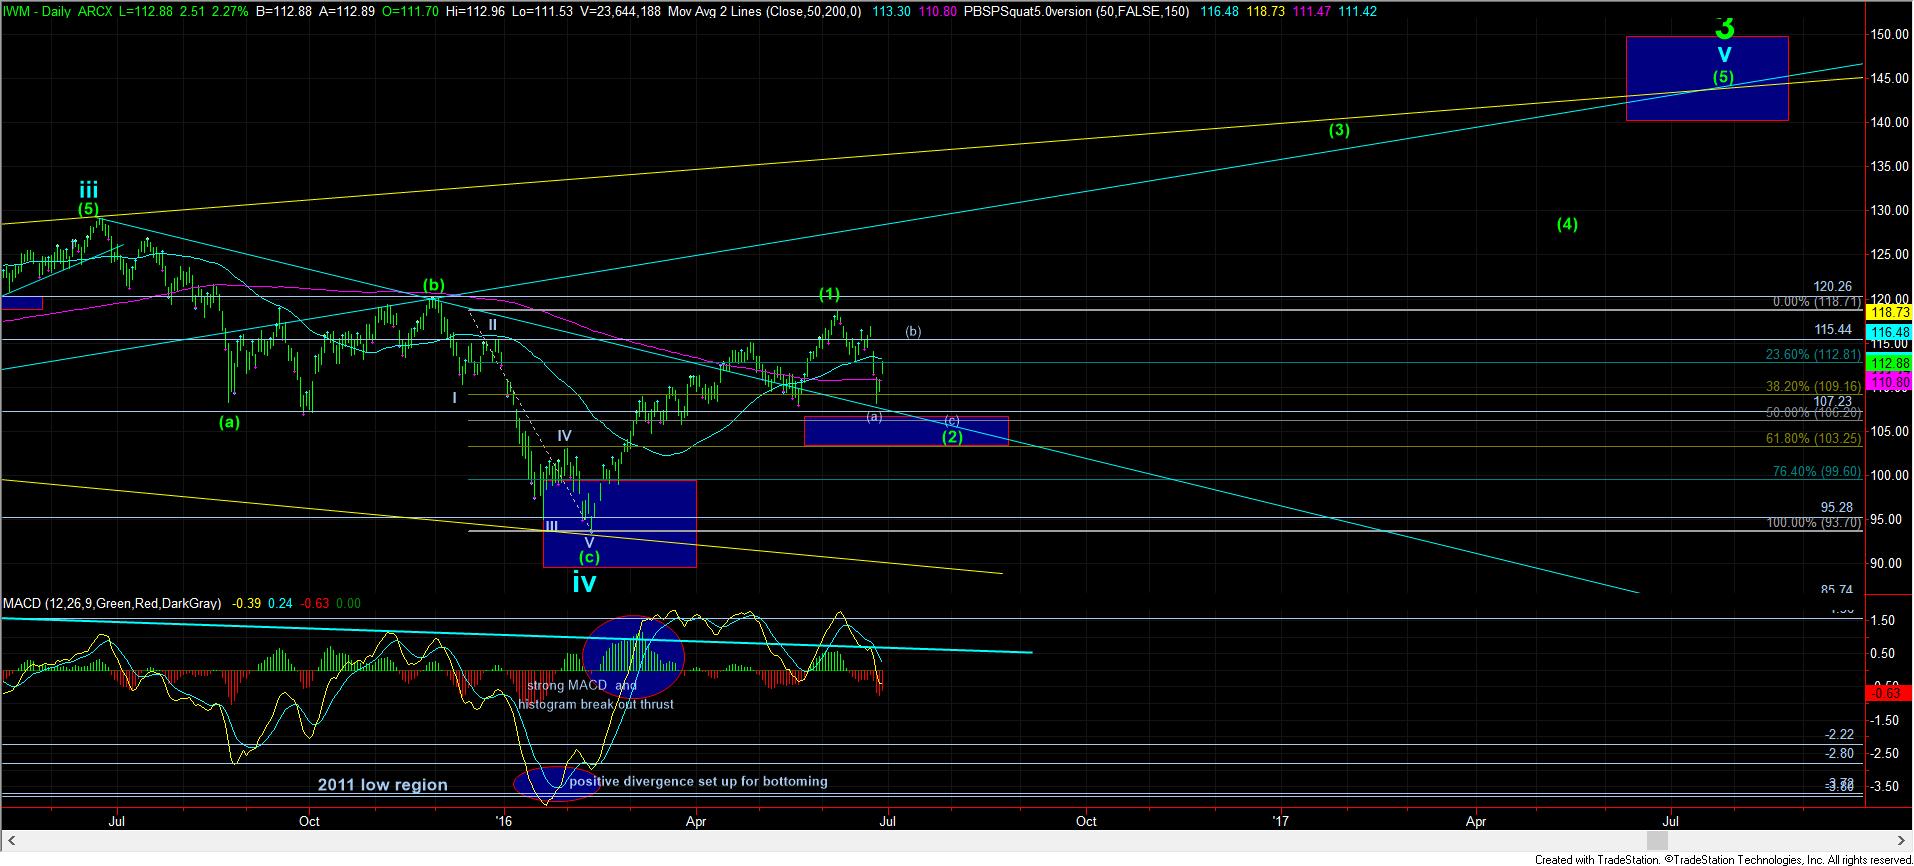
In going back to the chart that has been the cleanest of all, we are now just about hitting the 50DMA on the IWM in this rally. What would set up the bearishness needed for a 3rd wave break out higher would be a “clear” heads and shoulders pattern that a b-wave rally back to the 115 region which everyone would undoubtedly see, and likely short. But, even that set up would likely take the same path as the green one represented on the SPX charts, and needing a b-wave pullback within that (b) wave.
Alternatively, if the market can prove that wave (2) has bottomed by filling in all 5 waves noted on the attached 5 minute chart, then it pushes me to take the potential that wave (2) has bottomed much more seriously.