Expected Rally Seen, Do We Turn Down Now?
 By
Avi Gilburt
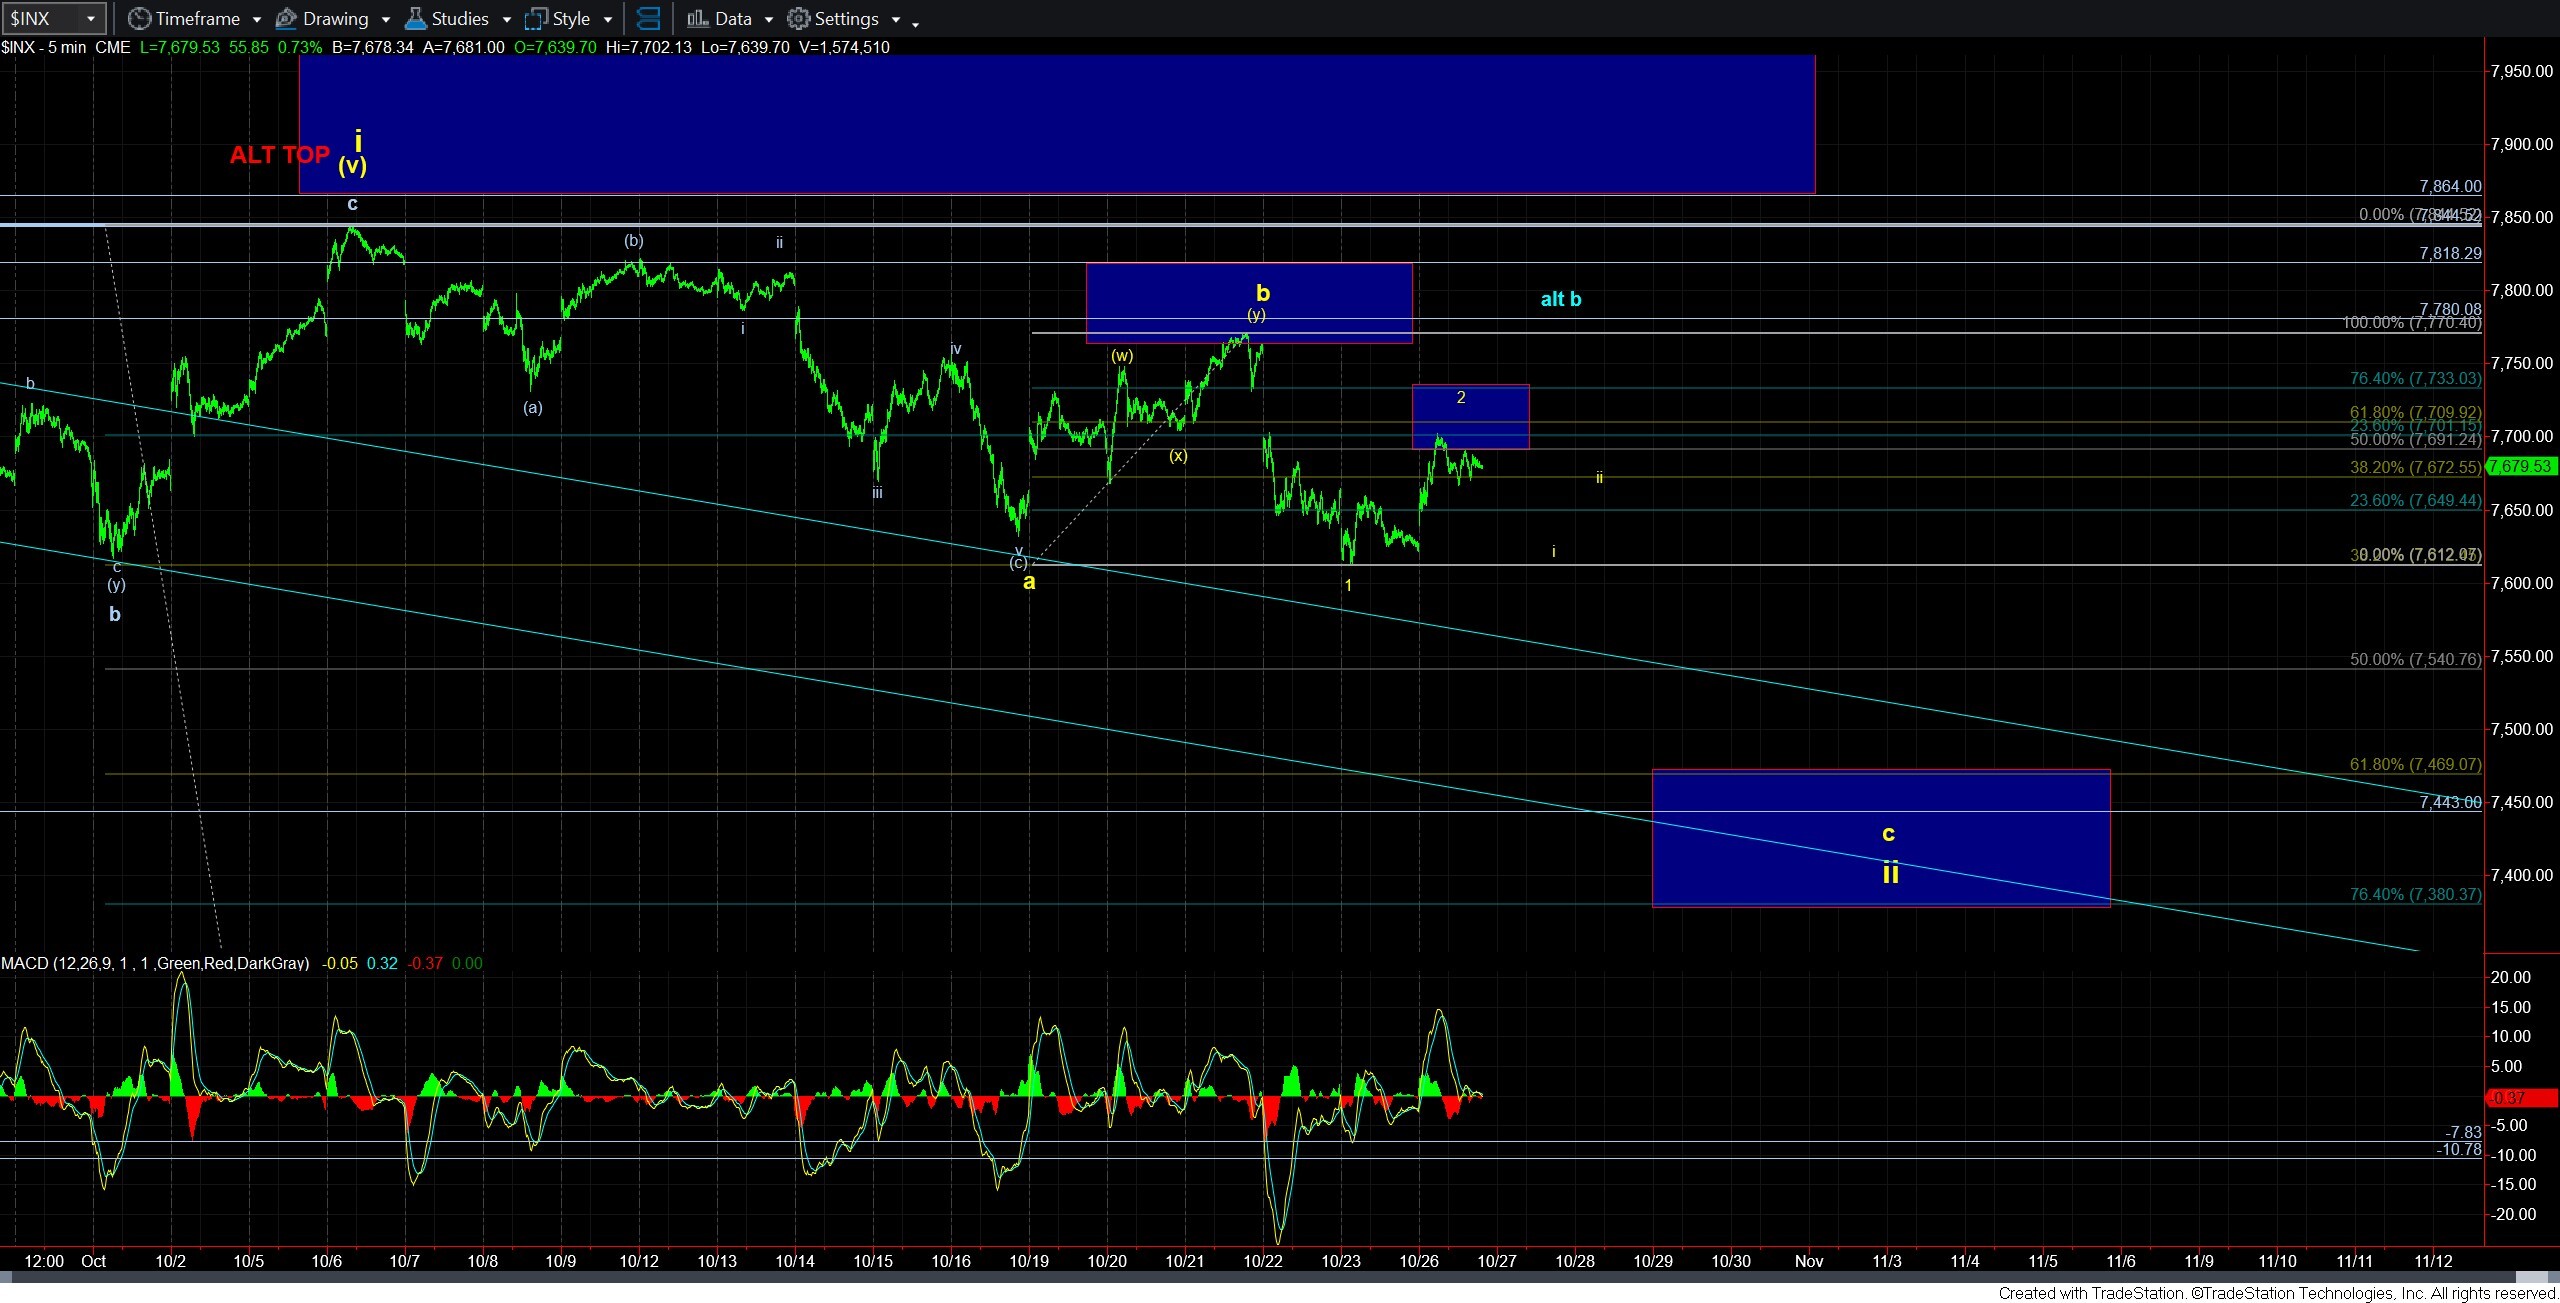
In my weekend update, I outlined my reasonable expectation for a rally to be seen this week, which should provide us with a 1-2 downside structure in our primary wave count. As I write this update, we have struck our wave 2 target/resistance box.
The question now is if we begin another smaller degree 5-wave structure to fill in wave i of wave 3 (as outlined on the 5-minute SPX chart), or does the market push a bit higher into the resistance box?
Well, I can make out a small 5-wave decline off today’s high. So, there is some potential for the wave i of 3 decline to have begun. But, in truth, due to how convoluted this market has been for some time, I think it is wise to await a completed 5-wave decline for wave i of 3 to increase the probability that we have begun the wave 3 decline that we ideally expect in the c-wave to our target/support box below us on the 5-minute SPX chart.
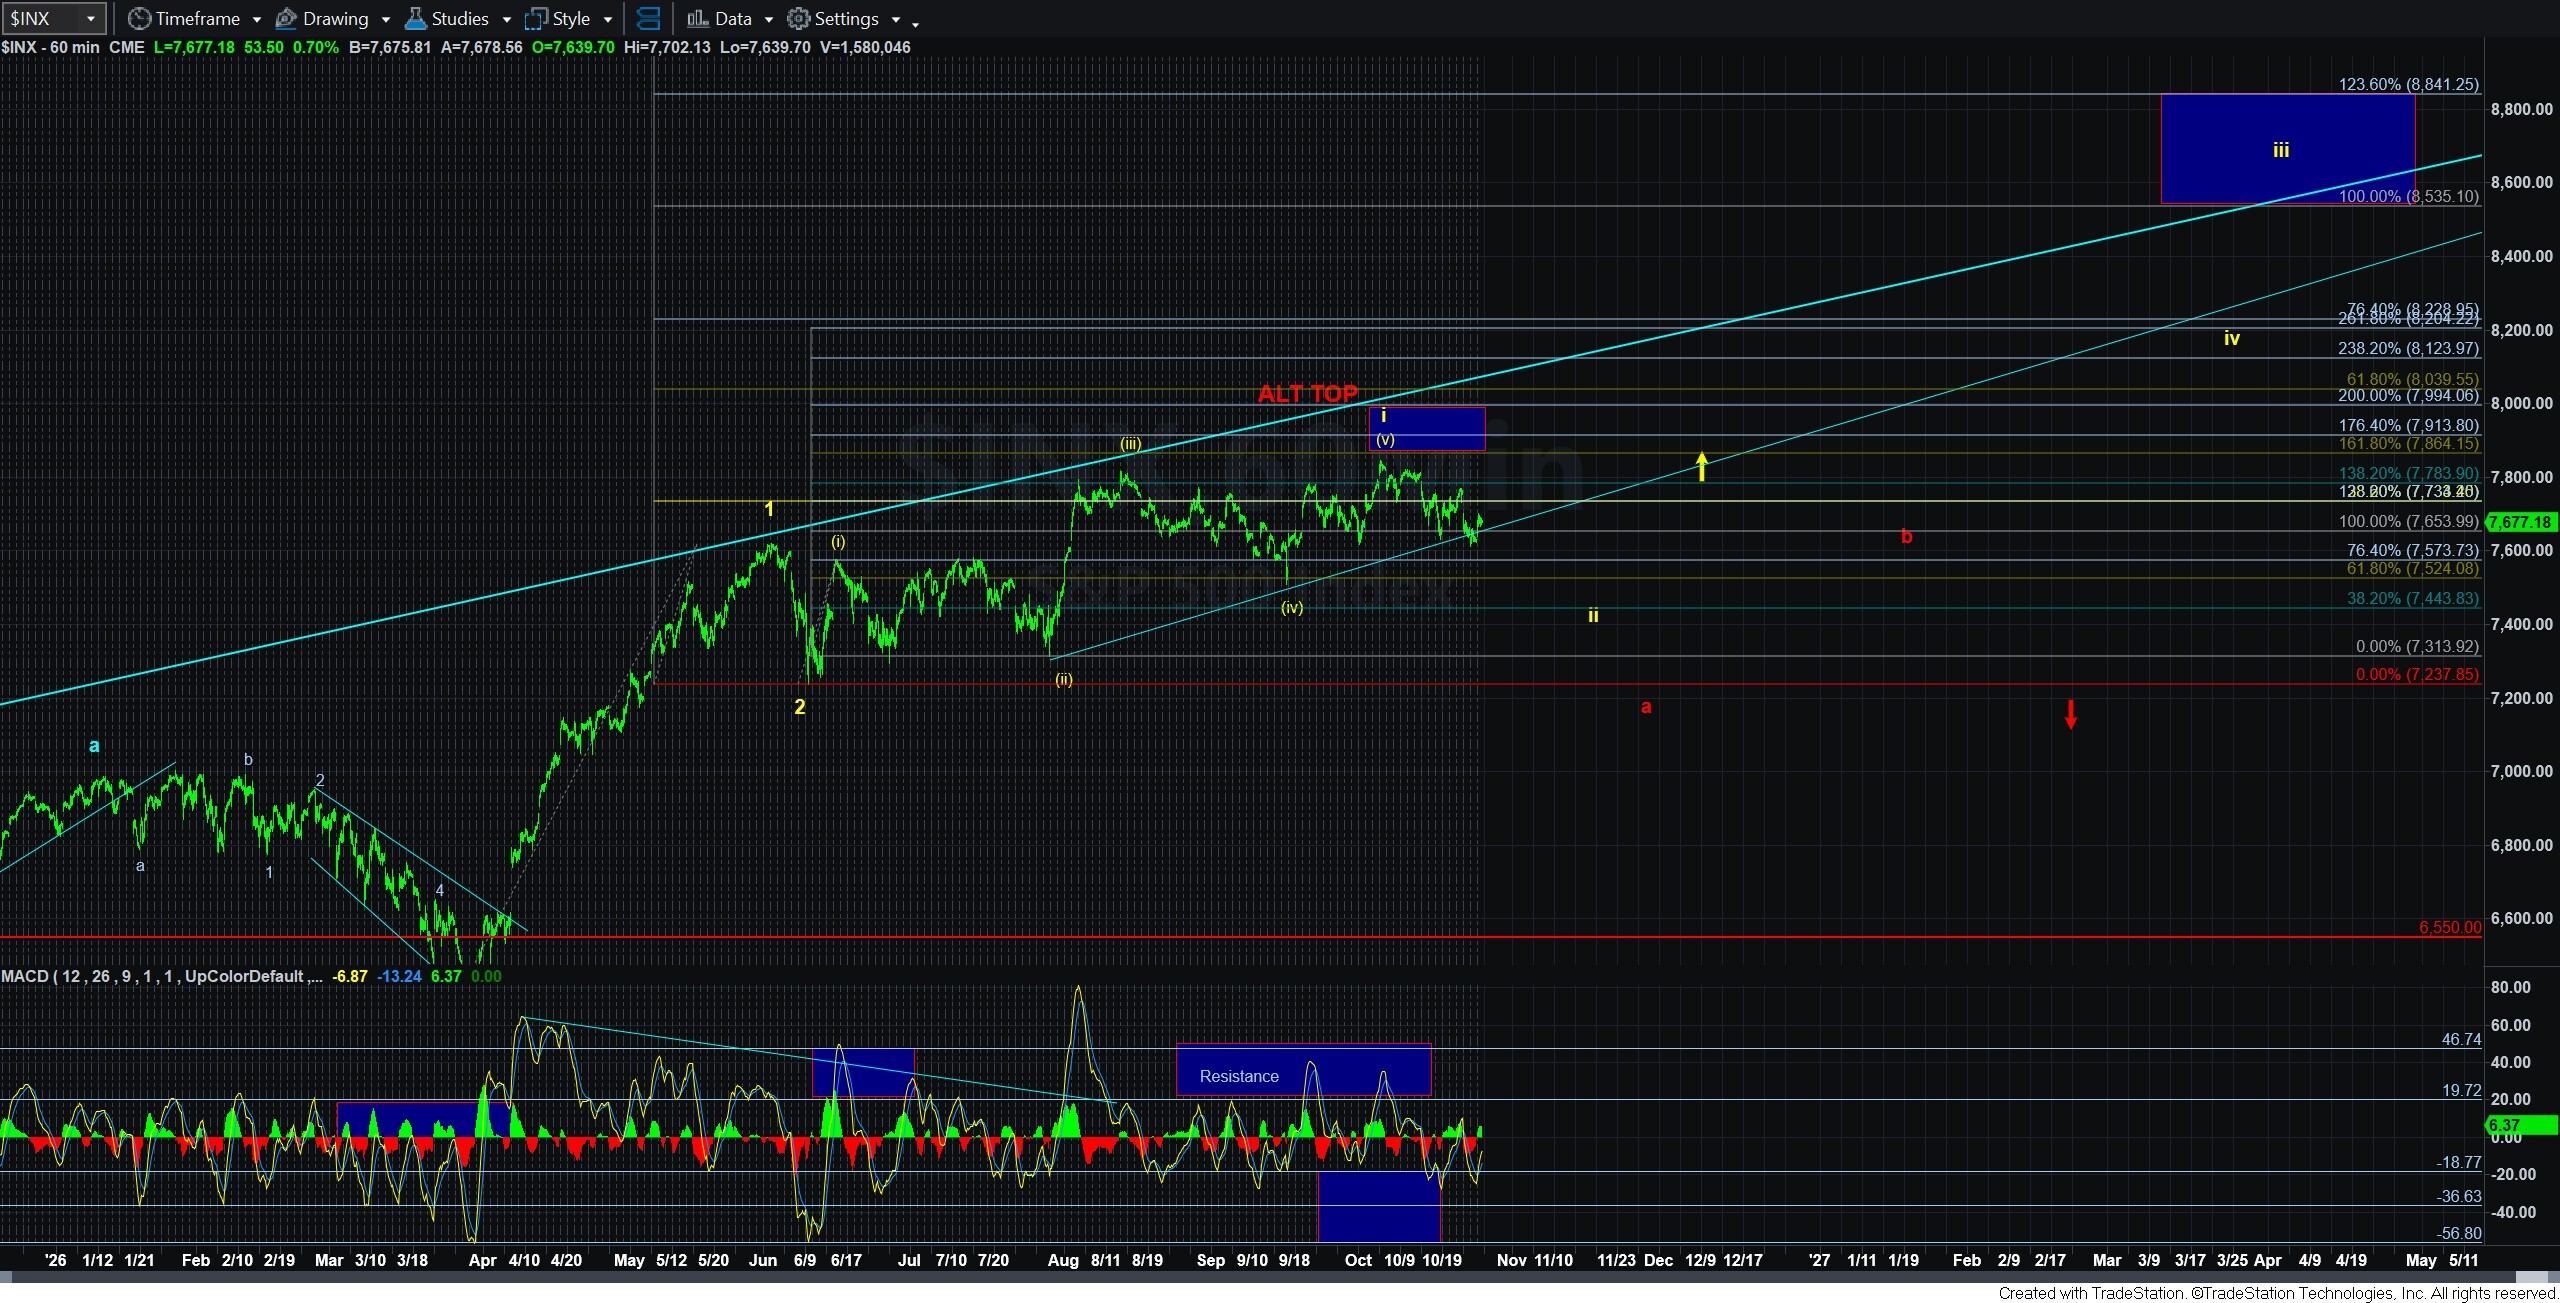
As you can also see on the chart, I have taken off the alternative 1-2 I had over the weekend, and have added an alternative b-wave in blue as our alternative count for now. However, I view the 1-2 downside as the more likely path at this time. But, we will need to respect the resistance box and complete 5 waves down for wave i of 3 to increase the probability of the expected downside follow through. The one factor that may have me leaning towards this path is that the 60-minute MACD does seem as though it has room to bounce a bit higher. And, should we break out over the resistance box in the coming day or two, then will then view the alt-b alternative as a higher probability. For now, I am looking down more immediately.