Everyone Loves Jello - Market Analysis for Jun 25th, 2020
As I so often say during corrective structures, trying to track the micro count within a corrective structure is like trying to throw Jello for distance. Yet, we seem to be doing pretty well of late.
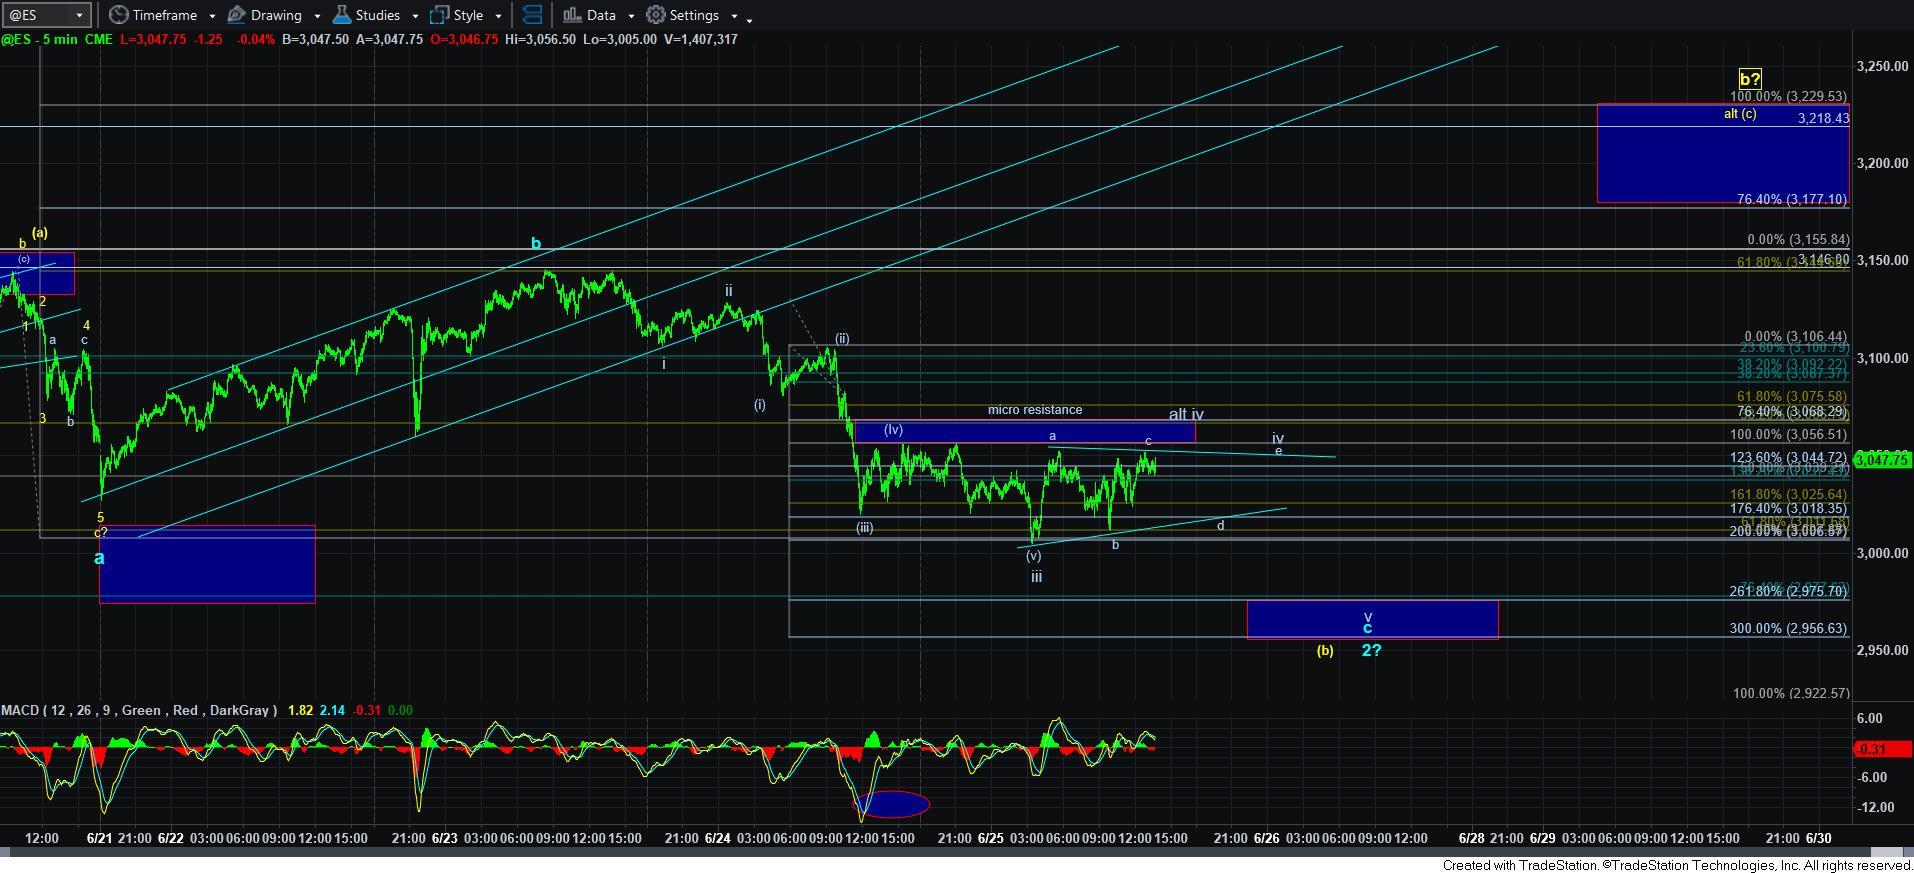
In the last half of the day yesterday and through the overnight session, the market played out in an almost perfect Fibonacci Pinball pattern by rallying back to the 3055ES resistance region, and then dropping to the target we had for wave [v] of iii in the 3006ES region. Thereafter, the market bounced right back to the wave iv resistance, and we have been consolidating below it all day long today.
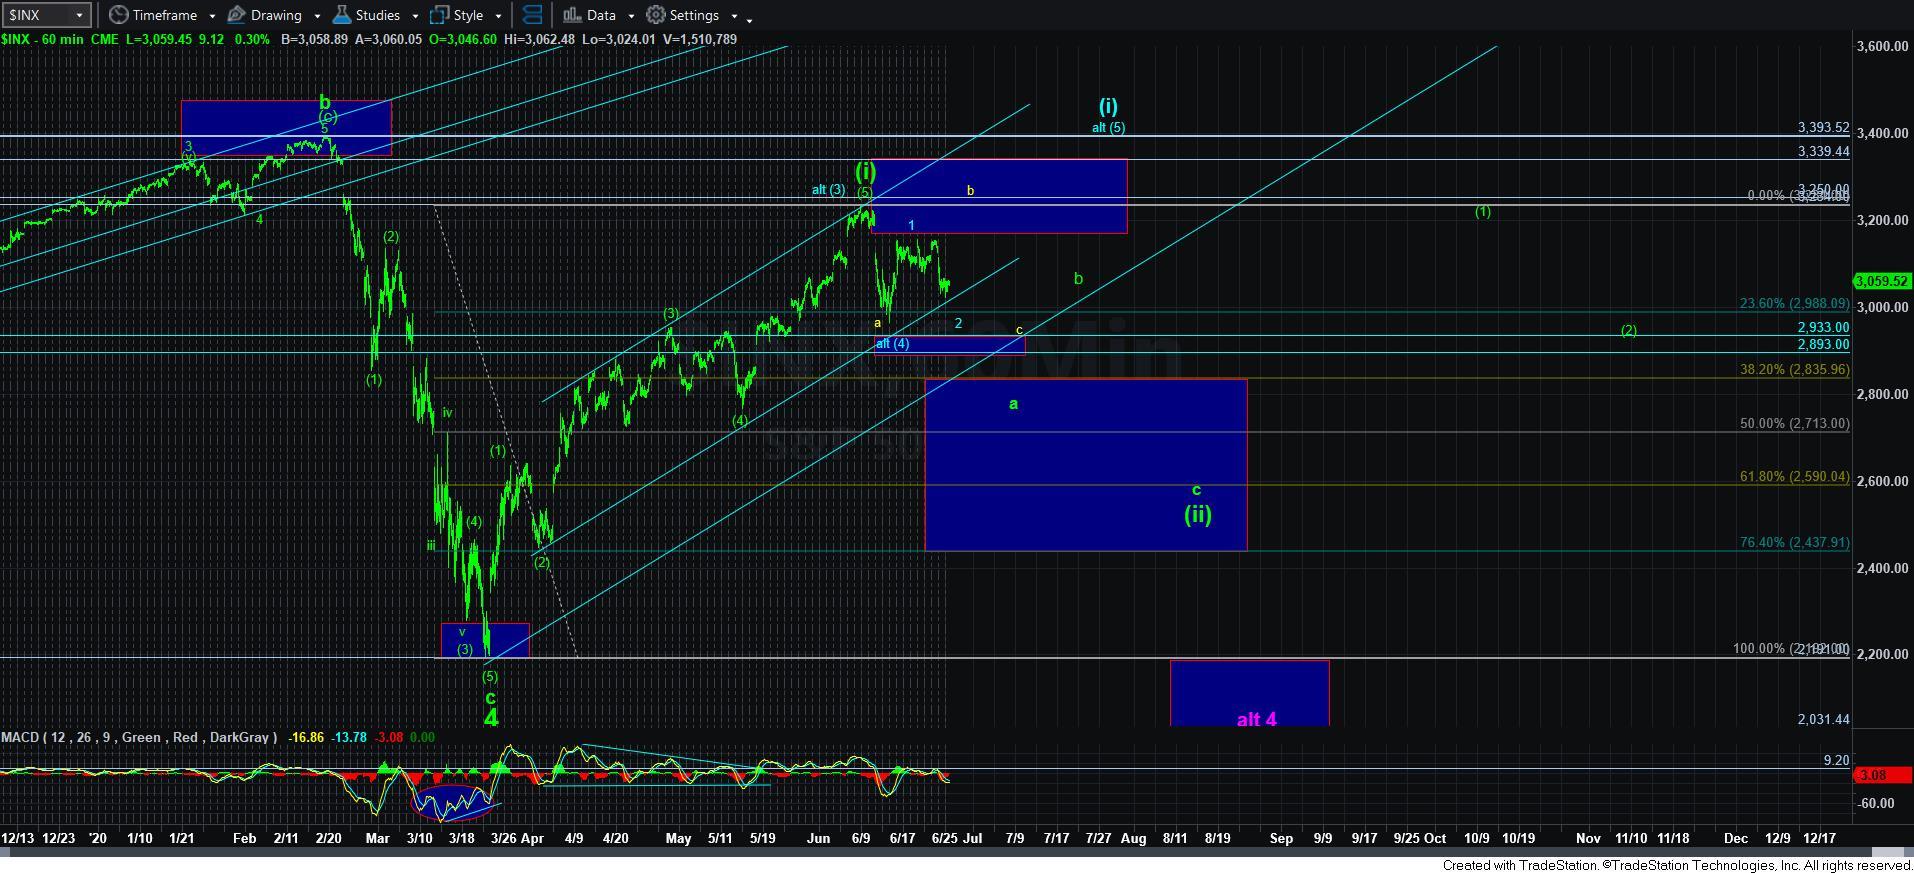
In the bigger perspective, I have noted over the last day or so that as long as the market remains over the 2956/75ES support, the pattern is pointing us back up towards this week’s high. In fact, if we are able to drop down into the 2956/75ES support region, that could support the blue wave 1-2 structure for blue wave [5], and point us back up towards the all-time highs.
However, we are going to have to take this one step at a time should we indeed rally into next week. And, that is where our Fibonacci Pinball methodology will come in very handy. However, we will need to confirm a bottom to this decline before we can set up the projections for that Fibonacci Pinball structure. So, I will leave that discussion for next week.
In the meantime, the micro structure suggests that as long as the market remains under the micro resistance, we are pointing down to the 2956-75ES region. Moreover, as long as we remain below today’s a-wave rally high, the market seems to be tracing out a wave iv triangle, as you can see in the 5-minute ES chart. If we should move over the a-wave high, then it means the alt iv structure it taking shape, which presents us with a more complex wave iv structure, but with resistance in the 3063-68ES region.
But, in the end, it really comes down to whether we remain below 3068ES or not. As long as we remain below that micro resistance region, I will expect one more decline to the next lower target box. Over it, and we may have begun the [c] wave rally in yellow.
So, again, allow me to try to simplify this overall perspective. As long as the market remains over the 2956-75ES support region, I am going to be looking for AT LEAST a [c] wave rally, outlined in yellow. However, depending upon how the market structure develops off the 2956-75ES support, we may be looking at attacking the prior all-time high to complete the blue wave [5].
Lastly, until we confirm the bottom to this yellow [b] wave or blue wave 2, I am unable to make any further determinations within this Jello region. And, even though I learned as a child that everyone loves Jello, this type of Jello can be quite frustrating, at least until the market makes its intentions better know. But, once we do complete this decline, we will be able to set up very clear parameters as to how to track the next rally I expect into next week. Finally, it would take a break of 2956ES, with follow through below 2885SPX to suggest that we are in the a-wave of the green wave [ii]. For now, that is a long way off.