Elliott Wave Intro Series - Part 5
Elliott Wave Intro Series: Part 1 | Part 2 | Part 3 | Part 4 | Part 5 | Part 6
In my last article, I presented the basics of Elliott Wave analysis. And, for those that have spent time working with me, they have learned that it is based upon a logical progression of if/then propositions.
You see, based upon the structure of the market action, we gain insight into where it will move next, in a probabilistic sense. Moreover, if the market begins to move in a manner that is inconsistent with that structure, then it provides us early warning signs so we can stop out and re-adjust our positions.
In this article, I will try to explain how we do this through the use of the Fibonacci Pinball method we developed.
I am going to start by repeating some of the lessons we learned in the prior articles, upon which we will now build:
“Since the market is “fractal” in nature, it means that these movements are variably self-similar at different degrees of trend. In other words, these impulsive and corrective movements of the market are occurring at all degrees and in all time frames. That means that the smaller components, or sub-waves, have the same basic shape, form, and pattern as the larger components . . . So, waves 1, 3 and 5 all have to develop as 5-wave structures. . .
As I said in my last article, Phi, when used appropriately in conjunction with Elliott Wave, can be an incredibly powerful predictive market tool. But, the internal wave structure within an Elliott Wave analysis must display relationships based upon Phi in order to be able to appropriately predict the next move within a market with any form of accuracy. In fact, after you identify the appropriate Elliott Wave pattern within a market, you are often able to then identify the next move of the market with shocking accuracy based upon a Phi-based target.”
First, we will start with the assumption that you are tracking a market or stock that you view as “bottoming.” And, if you are using Elliott Wave analysis, you recognize it is coming to the completion of a 5-wave c-wave structure, which means you are on alert for a reversal in price.
Moreover, since not everyone is willing to part with their hard-earned money until the market actually provides us with that reversal, in my example, I am going to assume you want to wait for the reversal to occur.
So, let’s look at a standard Fibonacci Pinball structure and please continually view the chart below as we go through the narrative for the path of a 5-wave structure within our Fibonacci Pinball perspective.
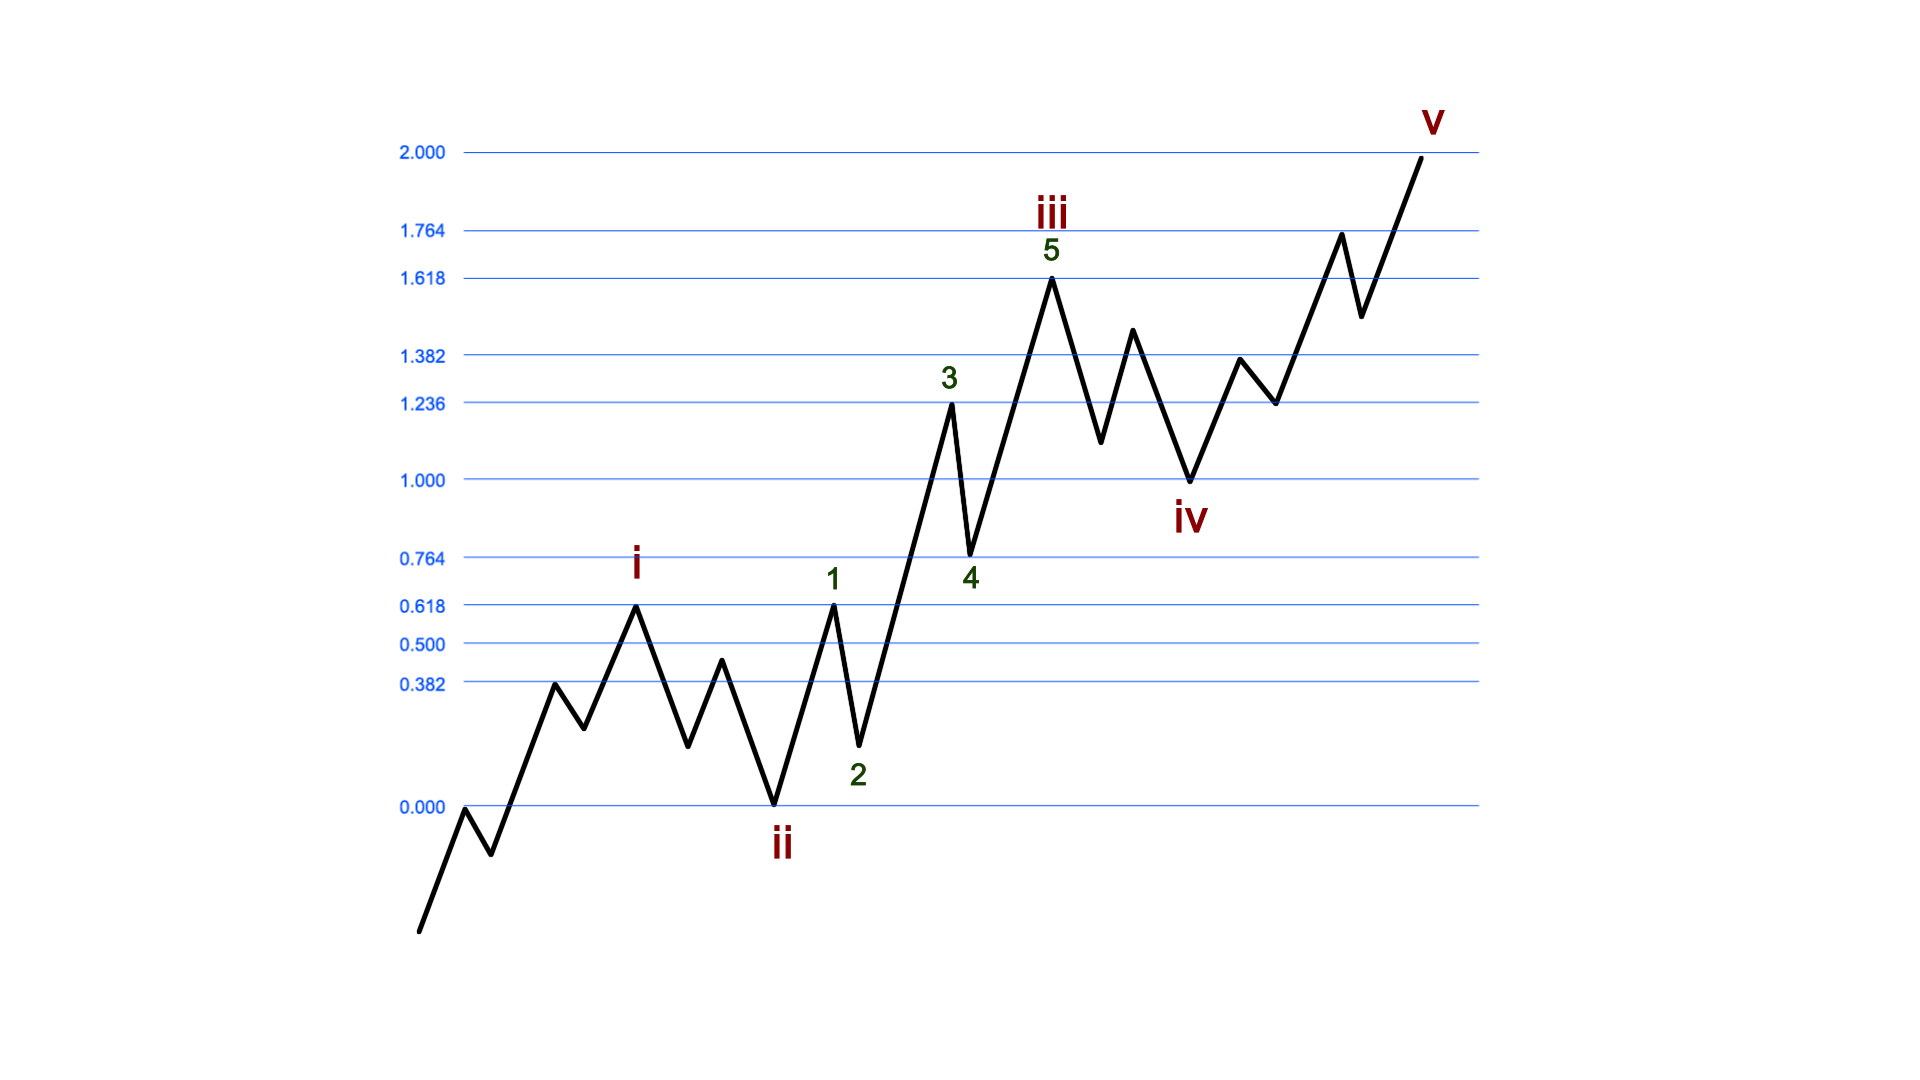
We will begin by assuming you are waiting for the initial 5 wave structure to develop off a bottoming expectation. That would be the point at which wave i on the attached chart completes. At that point in time, you are looking for a corrective 3-wave pullback in wave ii, which often targets the .618 retrace of wave i. Once you have waves i and ii in place, you then set up your projections based upon three points – the bottom of the chart where the turn up began, the top of wave i, and the bottom of wave ii. As you can see, this sets up our Fibonacci Pinball structure, which will then guide you in the expected path for the upcoming rally.
Now, let’s move through how wave iii subdivides into 5 waves.
Wave 1 of wave iii will often target the .382-.618 extension of waves i and ii, and then provide another corrective pullback for wave 2. We now have a i-ii, 1-2 structure, which is the typical structure that any trader/investor should be looking for in any chart you follow.
You see, once wave 2 completes its pullback, the market embarks on what we call the heart of the 3rd wave, which is usually the most powerful part of the rally structure, wherein we see a strong and fast rally to the 1.236 extension of waves i and ii, as we complete wave 3 of iii. So, the ideal entry point would be as wave 2 nears completion, with your natural stop being the bottom of wave 1. (Remember that an impulsive structure will be invalidated if wave 2 retraces more than 100% of wave 1).
After striking the 1.236 extension in wave 3 of iii, we usually see a corrective pullback towards the .764 extension for wave 4 of iii, which then sets up the next segment of the rally to the 1.618 extension for wave 5 of iii. As you can see from the chart, we then see a pullback from the 1.618 extension back towards the 1.00 extension for wave iv, which then sets up wave v towards the 2.00 extension of waves i and ii.
As far as trading guidelines, once we strike the 1.236 extension you can move your stops up from the bottom of wave 1 of iii to just under the .764 extension, and you may then choose to exit your position once the market strikes its completed 5 wave structure for wave 5 of iii. Since 4th waves are often “premium killers,” most traders will take their profits at this point, and look for a re-entry once wave 4 nears its completion. Many traders do not even trade the 5th wave, as catching a 3rd wave is what most traders are really focused upon.
This is how Fibonacci Pinball works in its simplest form. Of course, there are often small adjustments we make along the way in real time based upon how the market develops within the sub-waves, but this is the general structure.
The other path we see most commonly is posted on the chart below.
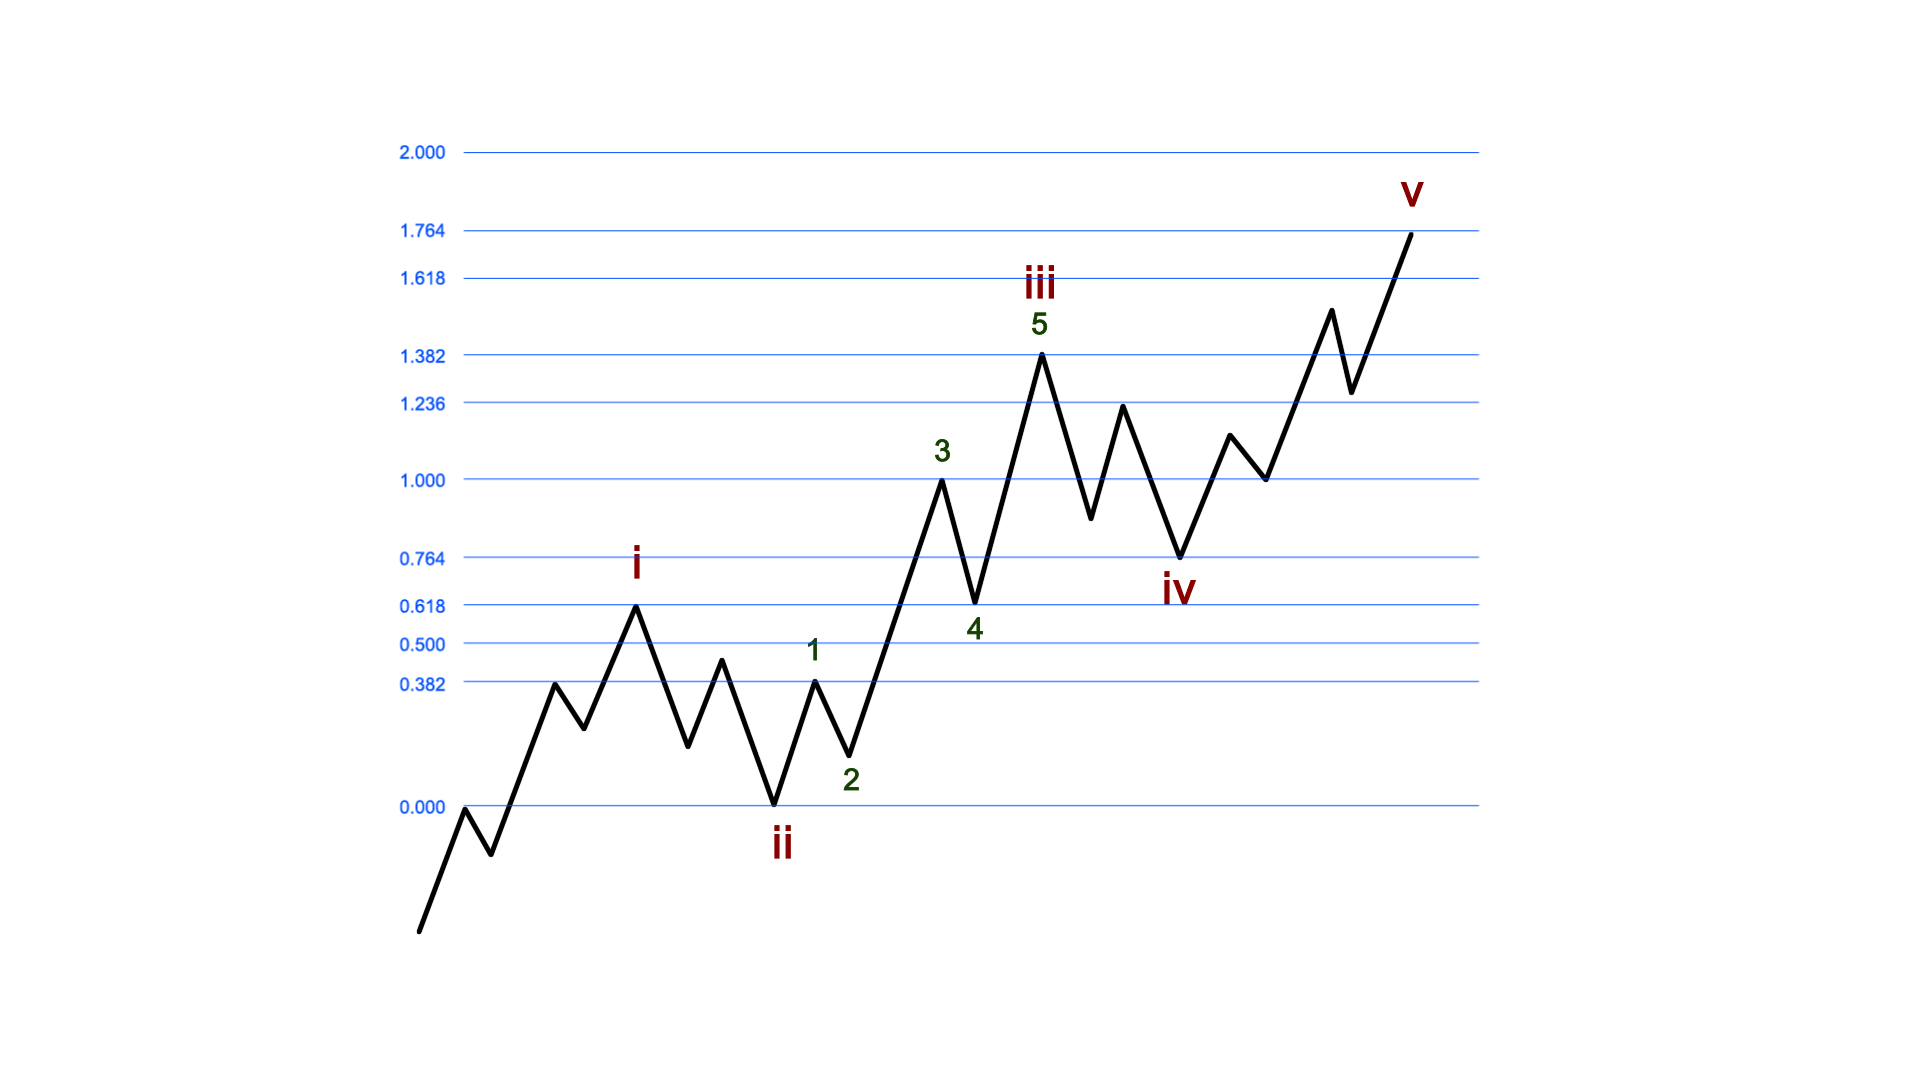
Within this structure, we see wave 3 of iii targeting the 1.00 extension.
Remember, since wave 3 of iii is also supposed to be 5 waves and must adhere to the same Fibonacci Pinball structure in its 5-wave structure, its 2.00 extension would be targeting the larger degree 1.00 extension of waves i and ii. This is how we know in advance that this structure is more likely than the one outlined above.
Now, this structure is of utmost importance in determining the difference between a standard 5-wave structure which will target much higher levels, and a corrective structure which will ultimately break down and point us to levels below the starting point of what we identified as the start of wave i. Allow me to explain.
This is a good time to review the standard ratios within a corrective structure. We have noted before that corrective structures are 3-wave structures, and are labeled a-b-c, as compared to the 1-2-3 in the impulsive structure.
The most common ratio within these corrective structures is where the third wave (the c-wave) is equal to the size of the first wave (the a-wave). When we apply this within out Fibonacci Pinball structure, it gives us early warning that a pattern will fail, even though we initially thought it would follow through as an impulsive rally to the 2.00 extension. Allow me to explain how we get that early warning.
As before, we have the initial rally off the turning point low, initially labeled as wave i. We then see a corrective pullback, initially labeled as wave ii, which is then followed by the next rally which we initially believe will be a 3rd wave.
Should that next rally target the 1.00 extension for wave 3 of iii (as presented in the second chart above), the wave 4 pullback will most often target the .618 extension. However, should the market break down below the .618 extension with its own impulsive sub-wave structure off the 1.00 extension, it provides us early warning that the rally we have been tracking is likely only a corrective structure, and the market is likely setting up to break below the turning point from which began wave i.
However, as long as the market pulls back correctively and holds the .618 extension as support, then we are likely pointing up towards the 1.382 extension in the resumption of the impulsive structure in the 3rd wave. That is why we usually place our stops just under the .618 extension once the market strikes the 1.00 extension. This is how we lock in profits from our entry below, and even if the market reverses, we get stopped out with profit since our stop out is above our entry.
I know this type of analysis is quite technical in nature, and is not easy to initially understand by most of you who are only used to fundamental analysis. But, as my long-time members have noted, it will open your eyes as to how the market works based upon Fibonacci mathematics. As some of them have specifically stated:
“Fibonacci Pinball is one of the most profound discoveries in EW analysis, as well as one of the most useful practical tools. . . there is simply no better system of applying EW analysis, period. It is that good. There is no sentient life form or computer software that could explain this chart pattern without using Avi’s Fibonacci Pinball!”
“I will say for a fact that EWT with Fibonacci can map out the way up or down through these waves more precise then anything on earth.”
“Avi, Your FibPinball is mind blowing . . . the most useful tool I have ever traded with”
So, while this methodology may be completely foreign to many of you at this time, I urge you to consider something that may very well open your eyes to an entirely different side of the market you may not have known exists.
Our next article will conclude this series, and will provide a brief explanation as to how we use technical indicators to assist in our Elliott Wave analysis.
