Easy Part Of Decline Is Done
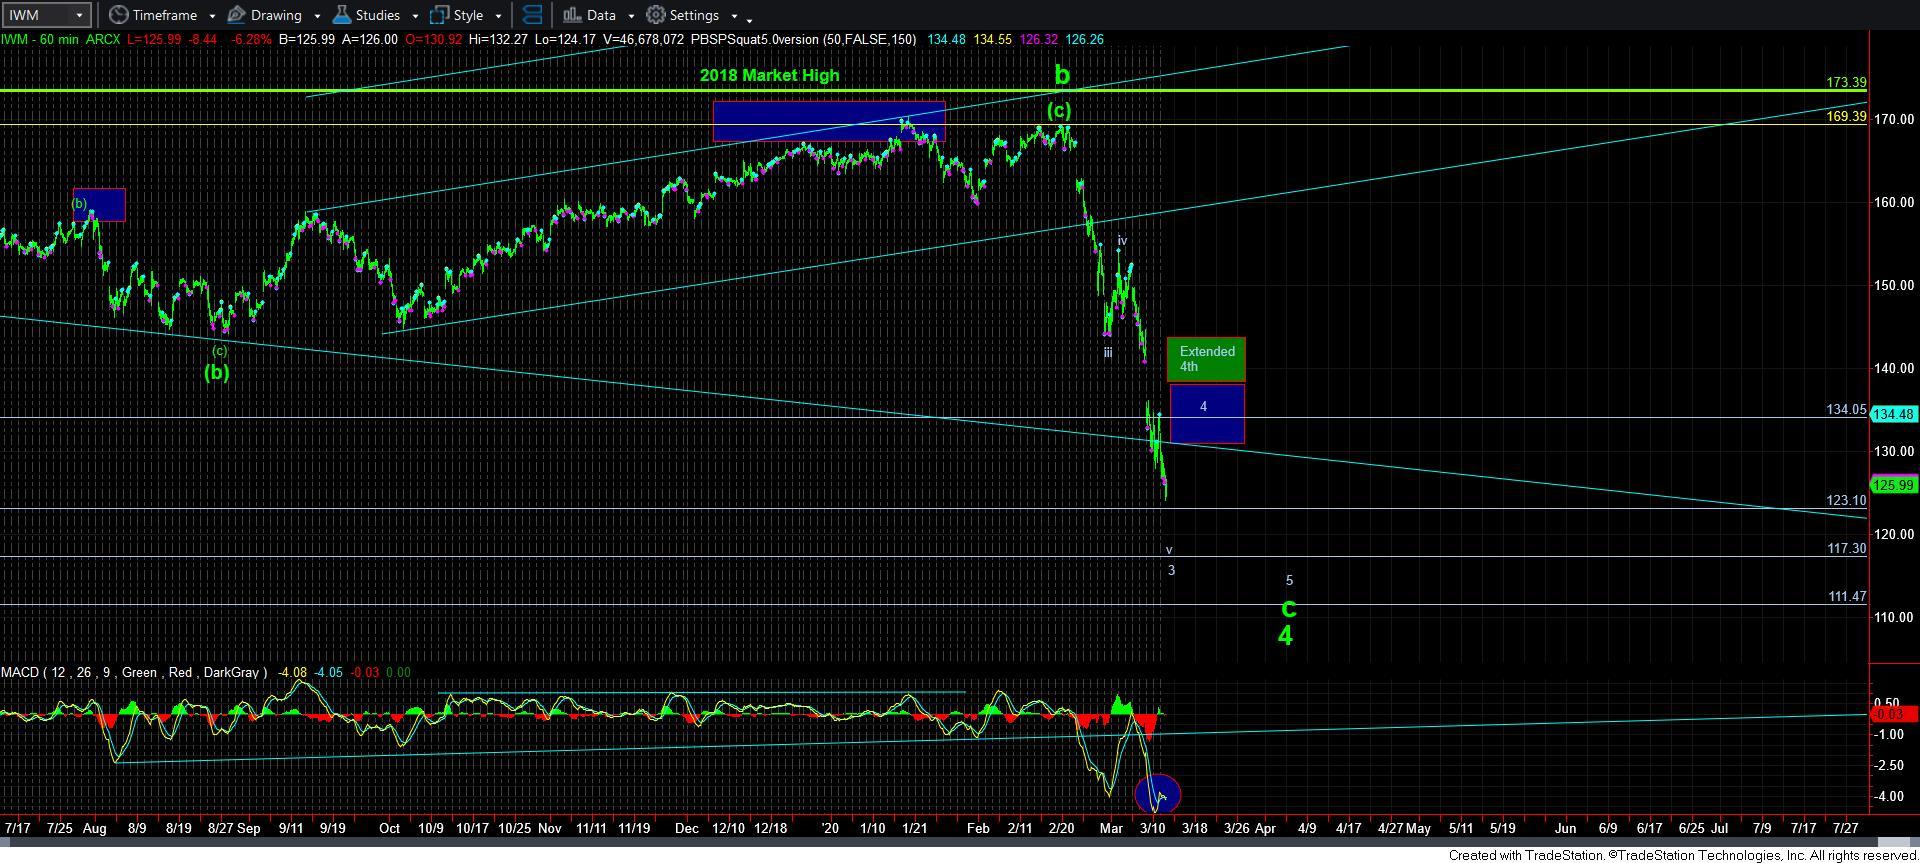
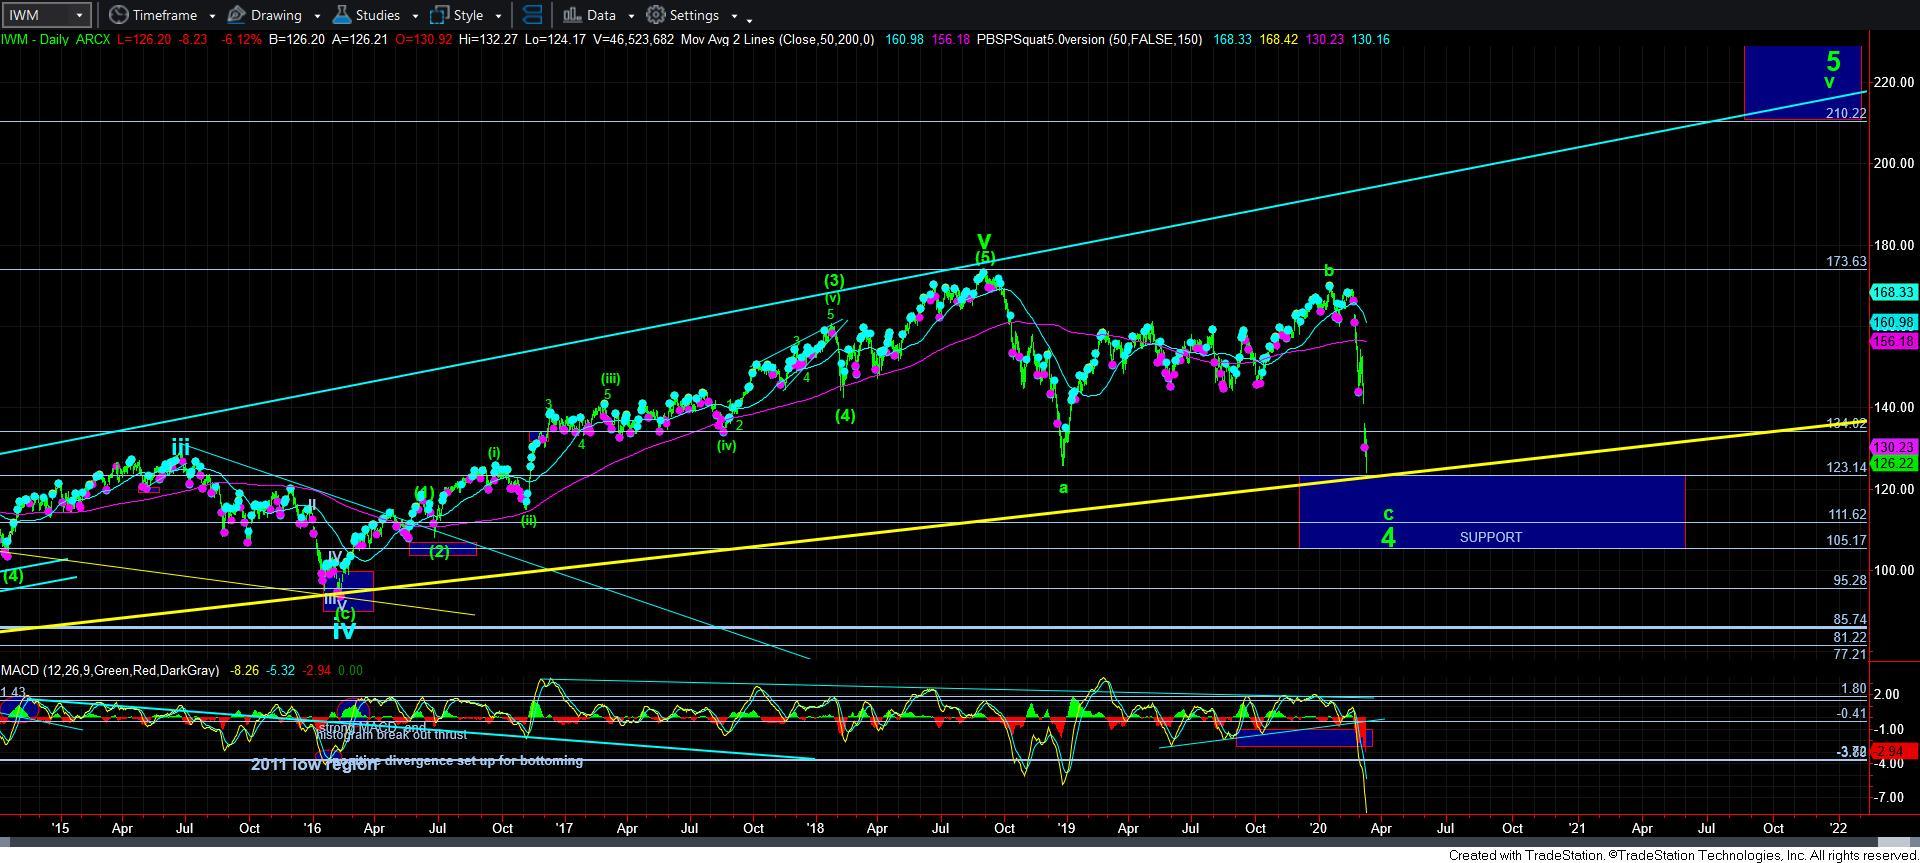
Yesterday, I highlighted how important it was for the market to provide us an imminent bounce or else it can open up a much bigger downside pathway, especially in the IWM. We are seeing signs of that today without any real bounce of which to speak - YET.
But, as I was noting time and again throughout the day in the chat of the trading room, the easy part of this decline is now completed, at least until we see a bigger bounce or retracement. You see, we are still trying to determine where the bottom to the wave 3 is in the IWM, and until we see a sizeable bounce/retracement that takes us several days to complete, I do not have a strong indication that this has yet completed.
Most specifically, the IWM has attempted a break down below 125 today. And, unless we see a move back over 128 post haste, it could continue to extend wave 3 down to the 117/118 region. The main reason I question this right now is because the decline we have been experiencing since the overnight rally on Monday night is overlapping and corrective looking. So, either we see an extension in wave 3 taking us to the 117/118 as an ending diagonal off the overnight high struck Monday into Tuesday, or the market can break back over 128, and suggest we are in wave 4 now with the low being an expanded b-wave. I really cannot say which is more likely at this time, as neither count is terribly clean. But, clearly, below 128 keeps immediate pressure to the downside.
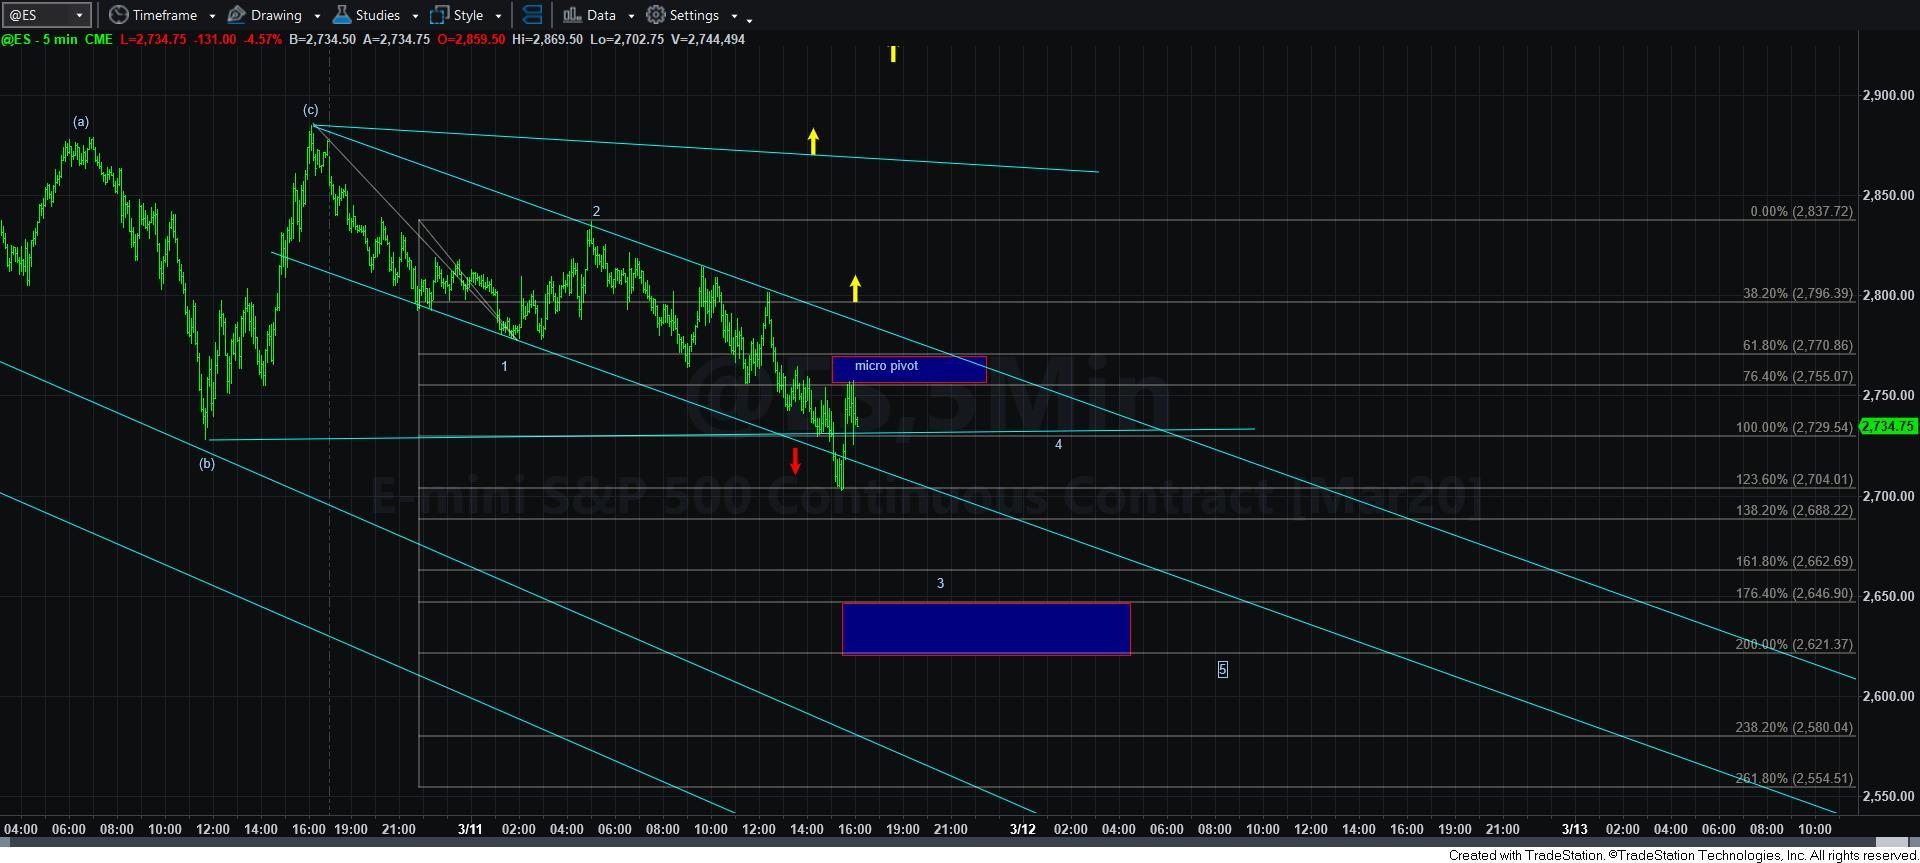
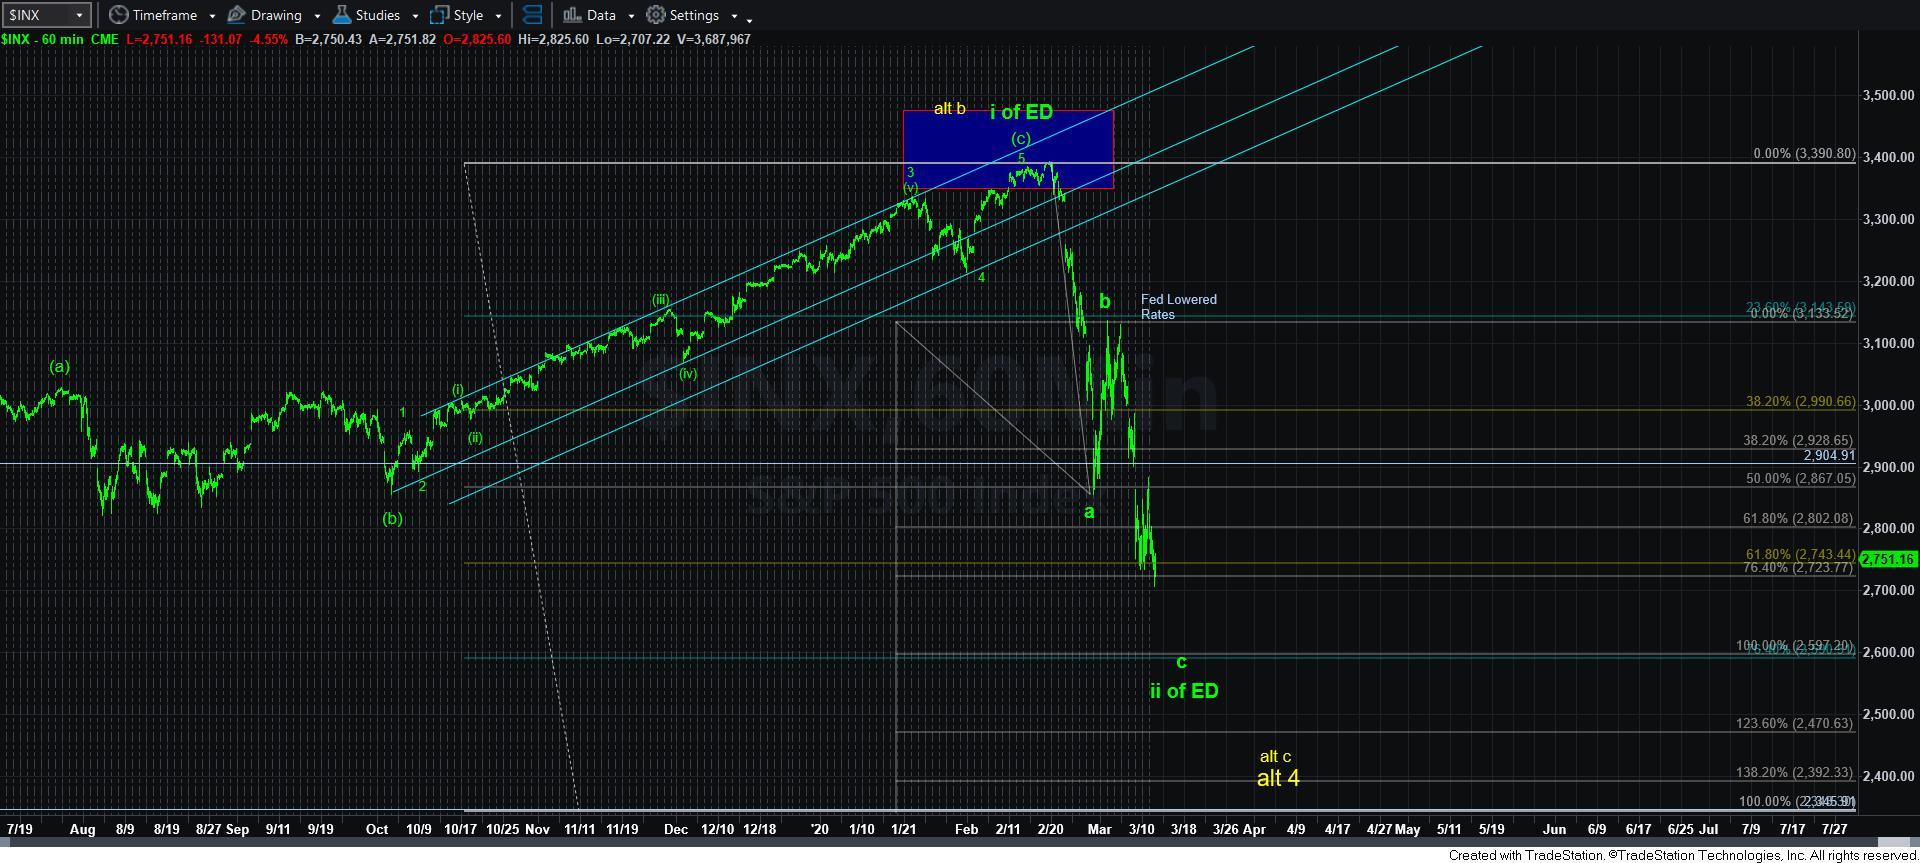
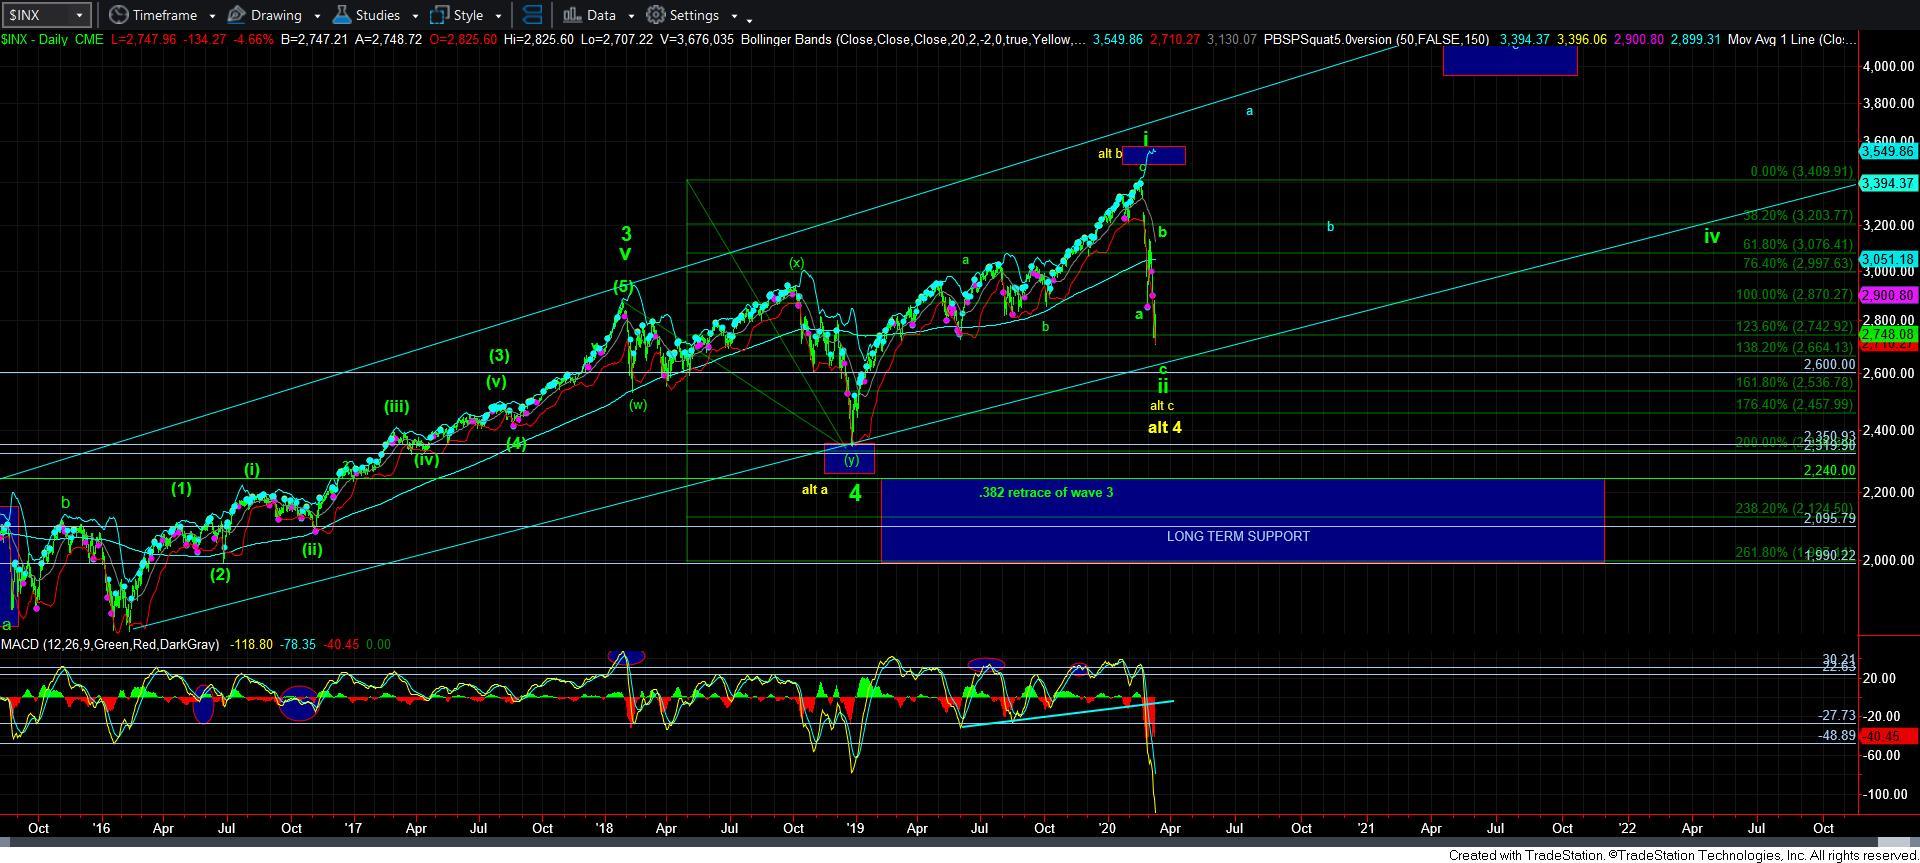
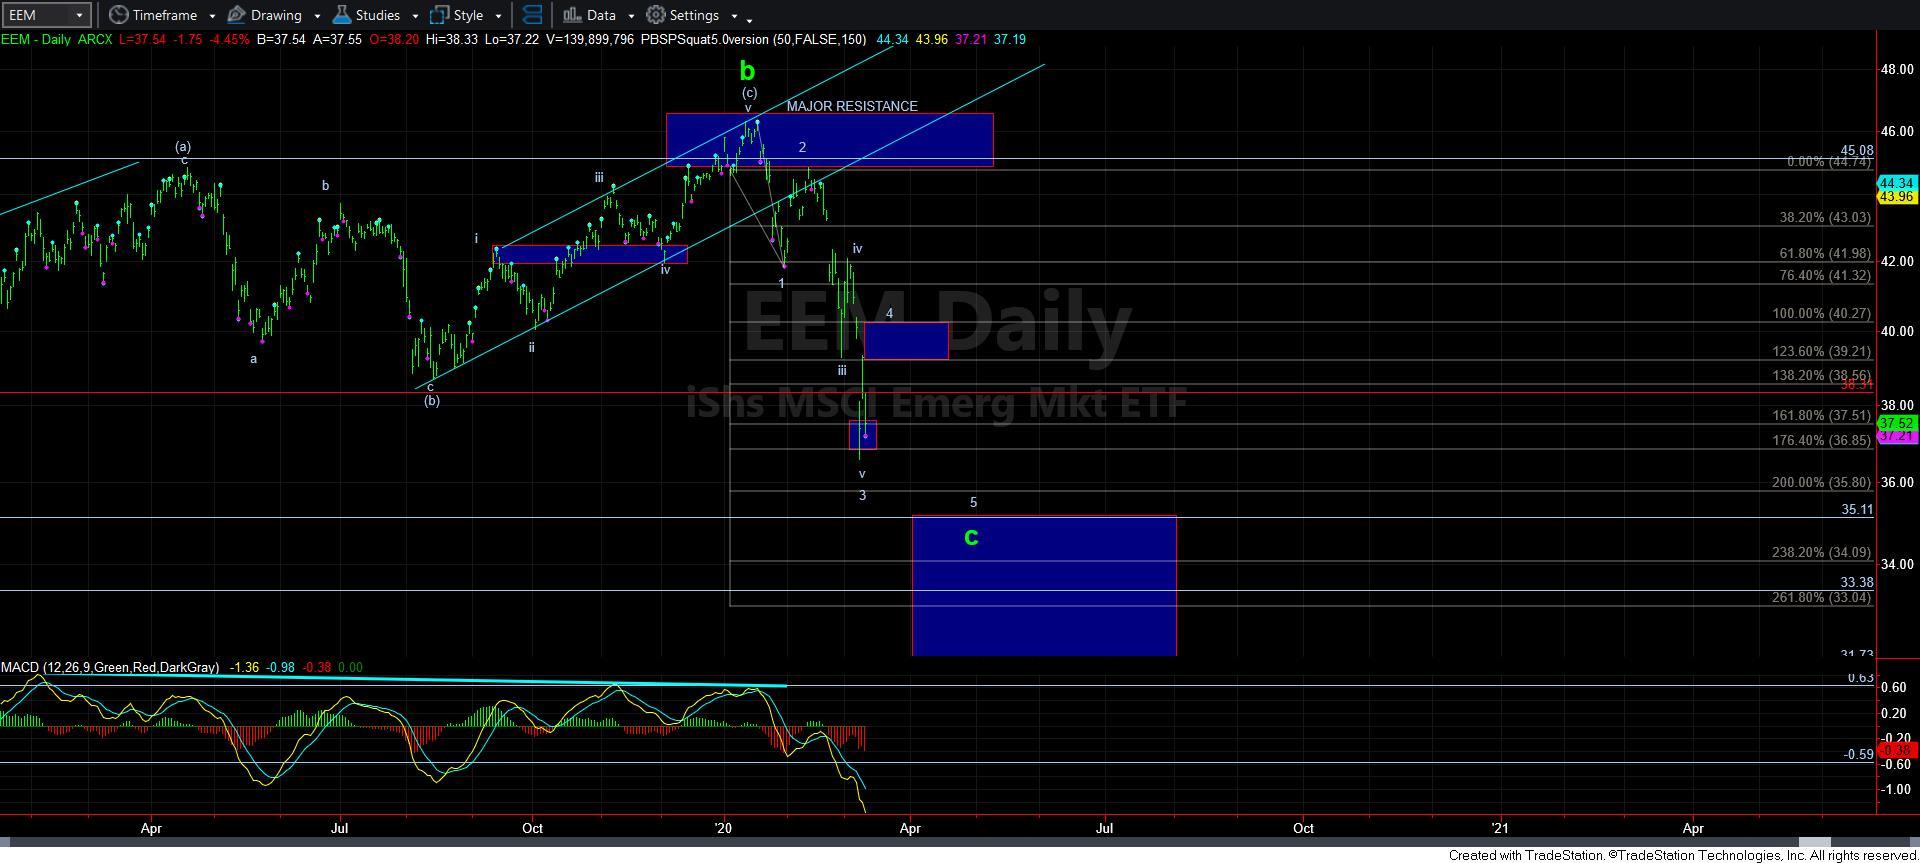
In the SPX, as long as the ES remains below the micro pivot I have on my attached 5-minute chart, we have a path lower towards the low 2600 region. As you may remember, 2600 is my maximum expectation for a wave ii in the wave ii potential. And, since I view the rally into the February high off the December 2018 low as a 3-wave rally, I only have two interpretations for this decline. I have outlined this at length and in detail in my prior weekend updates, but I simply cannot view the rally into the February high as a 5-wave structure. And, if we break below 2600, then it makes it clearly a b-wave high, even though the proportions make that a very unusual b-wave high. Yet, it would fit the structure of the EEM and IWM extraordinarily well.
Tomorrow will likely be quite important to the smaller degree count. And, yes, I still view the current action as quite dangerous, as I see it almost as likely to break down further as it is to break up and provide us with a bigger retracement. Yet, the edge goes to a continuation move lower as long as ES remains below the pivot. So, we do not exactly have high probability trading cues down here.
But, as I said, the easy part is now done until we see a bigger retracement to conclude that wave 3 is likely done in the IWM. We need the next bounce to get our bearings on the micro count. But, the overall perspective remains that we will still likely see lower levels in the coming weeks before this correction completes.
Lastly, if I were to use the EEM as the tie breaker, it would seem to suggest this is a b-wave pullback in a bigger wave 4 bounce. But, again, as long as the other charts remain below resistance, we must be careful of extensions lower.
As a side note, I will put out the metals update later tonight, and will be available tomorrow after 6PM for at least 2-3 hours to answer questions, as I know this action is not easy right now. Once we get a sizeable bounce, it should make things a lot easier.