Dreaming Of December 2018
When the market provided us with a rally off Friday’s low, many market participants seem to be dreaming of a replay of the action seen off the December 2018 low. While I cannot say that it is impossible that this can be repeated, I want to remind you again that the bottom struck in December 2018 was a non-standard completion of that drop. And, when you build a base in a very incomplete and weak manner, then you ultimately see moves like we saw last week as their culmination.
Over the weekend, I outlined why I still do not think this correction is done, yet, I did expect this “bounce.” For now, that is all I am seeing it as – a corrective bounce. And, for me to assume that an unusual bottoming structure will take hold for a second time in a little over a year is not something I am willing to do as a primary expectation. As I have said many times before, the standards we follow keep us out of trouble, and unless the market can prove otherwise, I think the more likely stance is to view this as a corrective bounce.
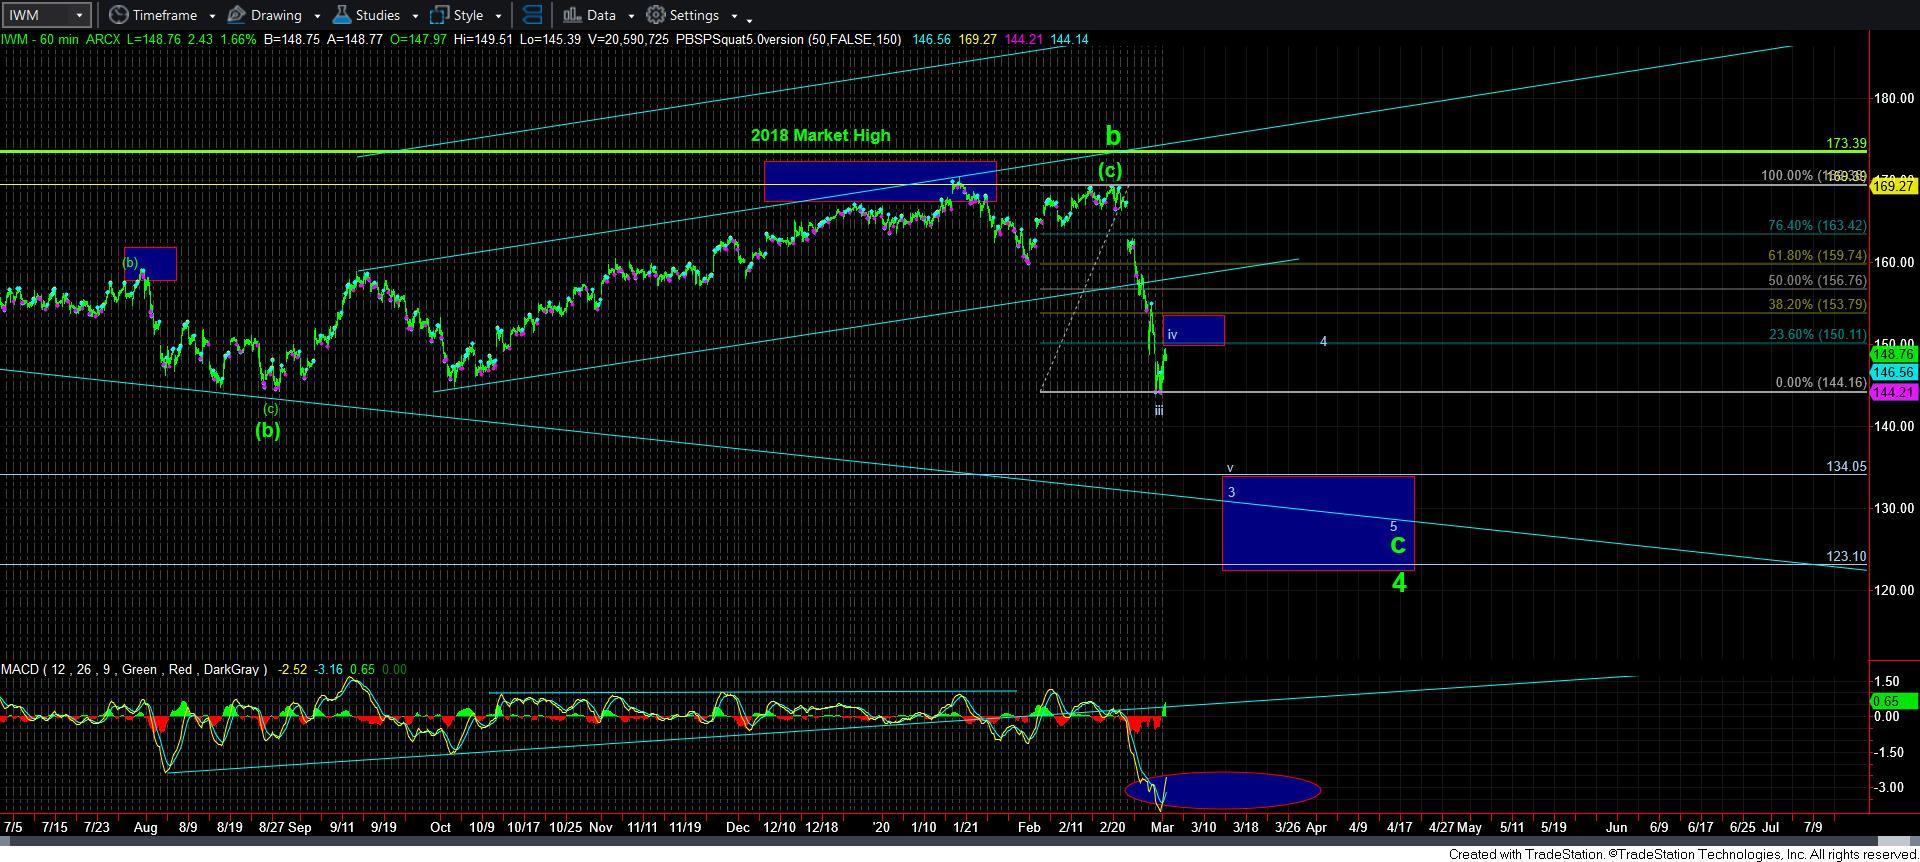
So, let’s look at the charts that have been telling us the “truth” over the last year. I have been presenting the IWM as expecting a wave iv of 3 rally, which seems to be what we are seeing today. And, as long as the IWM remains below 154, I am maintaining this count, with the expectation of seeing a wave v of 3 over the coming week or two.
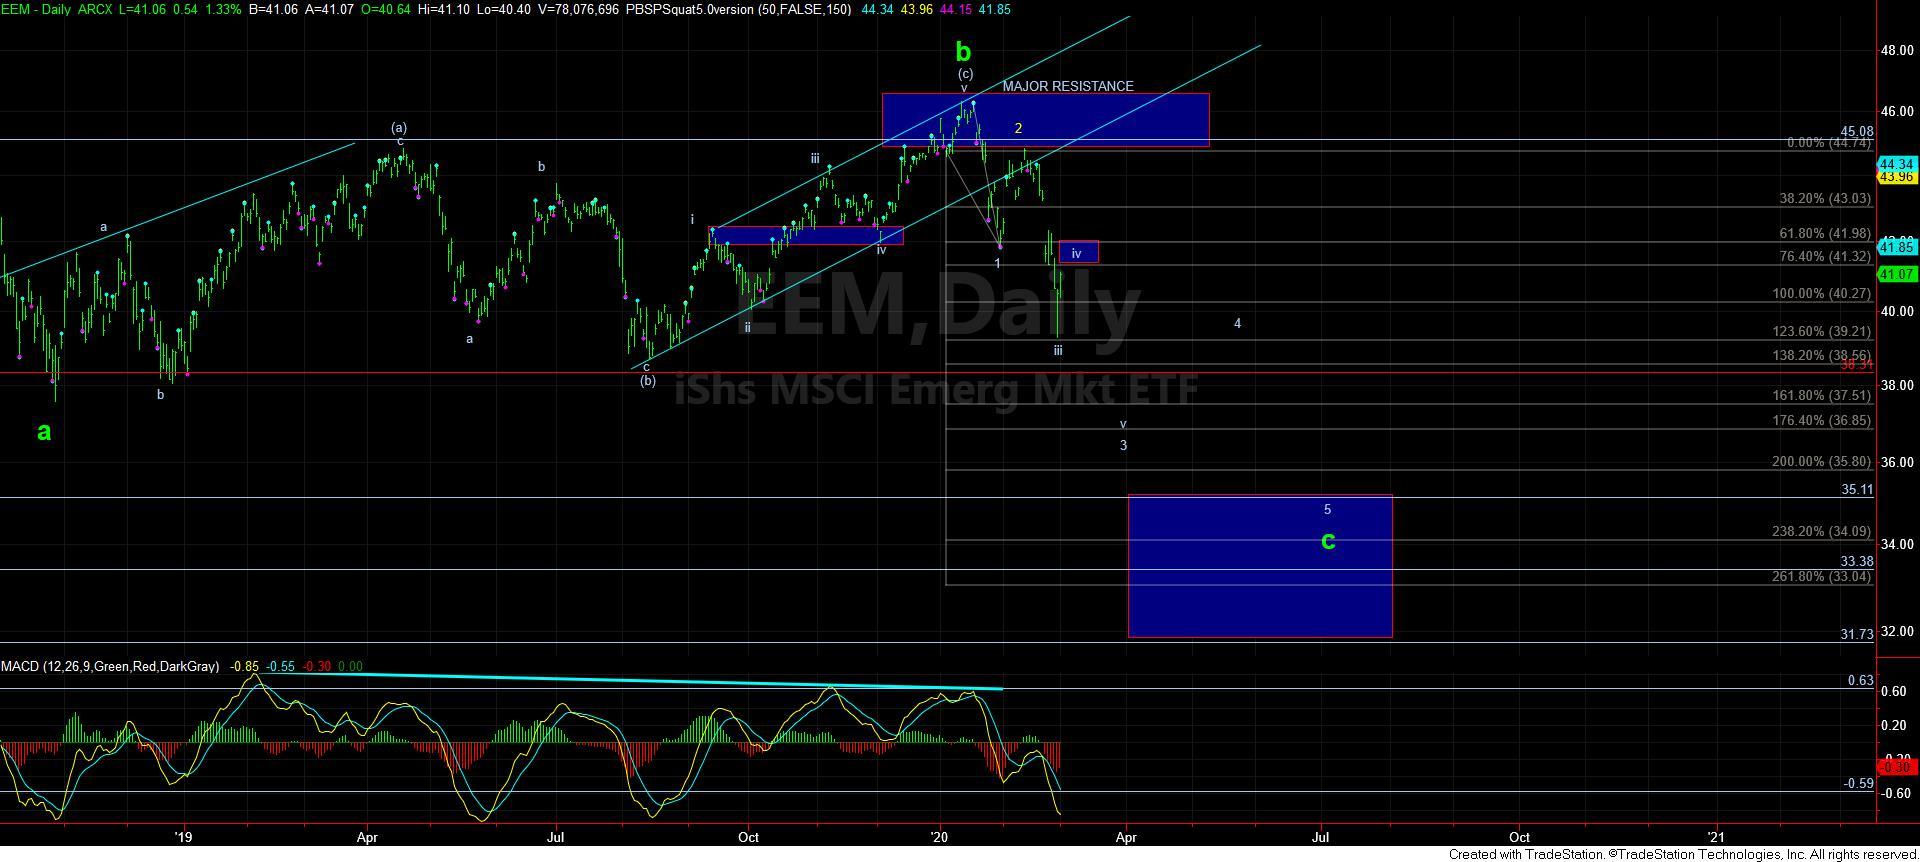
When reviewing the EEM, resistance for wave iv of 3 resides between 41.30-42. And, as long as we remain below that resistance, I am also expecting a wave v of 3 down. Now, I do want to add a note based upon a “suspicion” I have about the EEM. There is some potential that the EEM may try to complete as an ending diagonal for this c-wave down, which means a break of 42 is not as determinantal to the overall downside I continue to expect in the equity markets as a break over 154 in IWM would suggest.
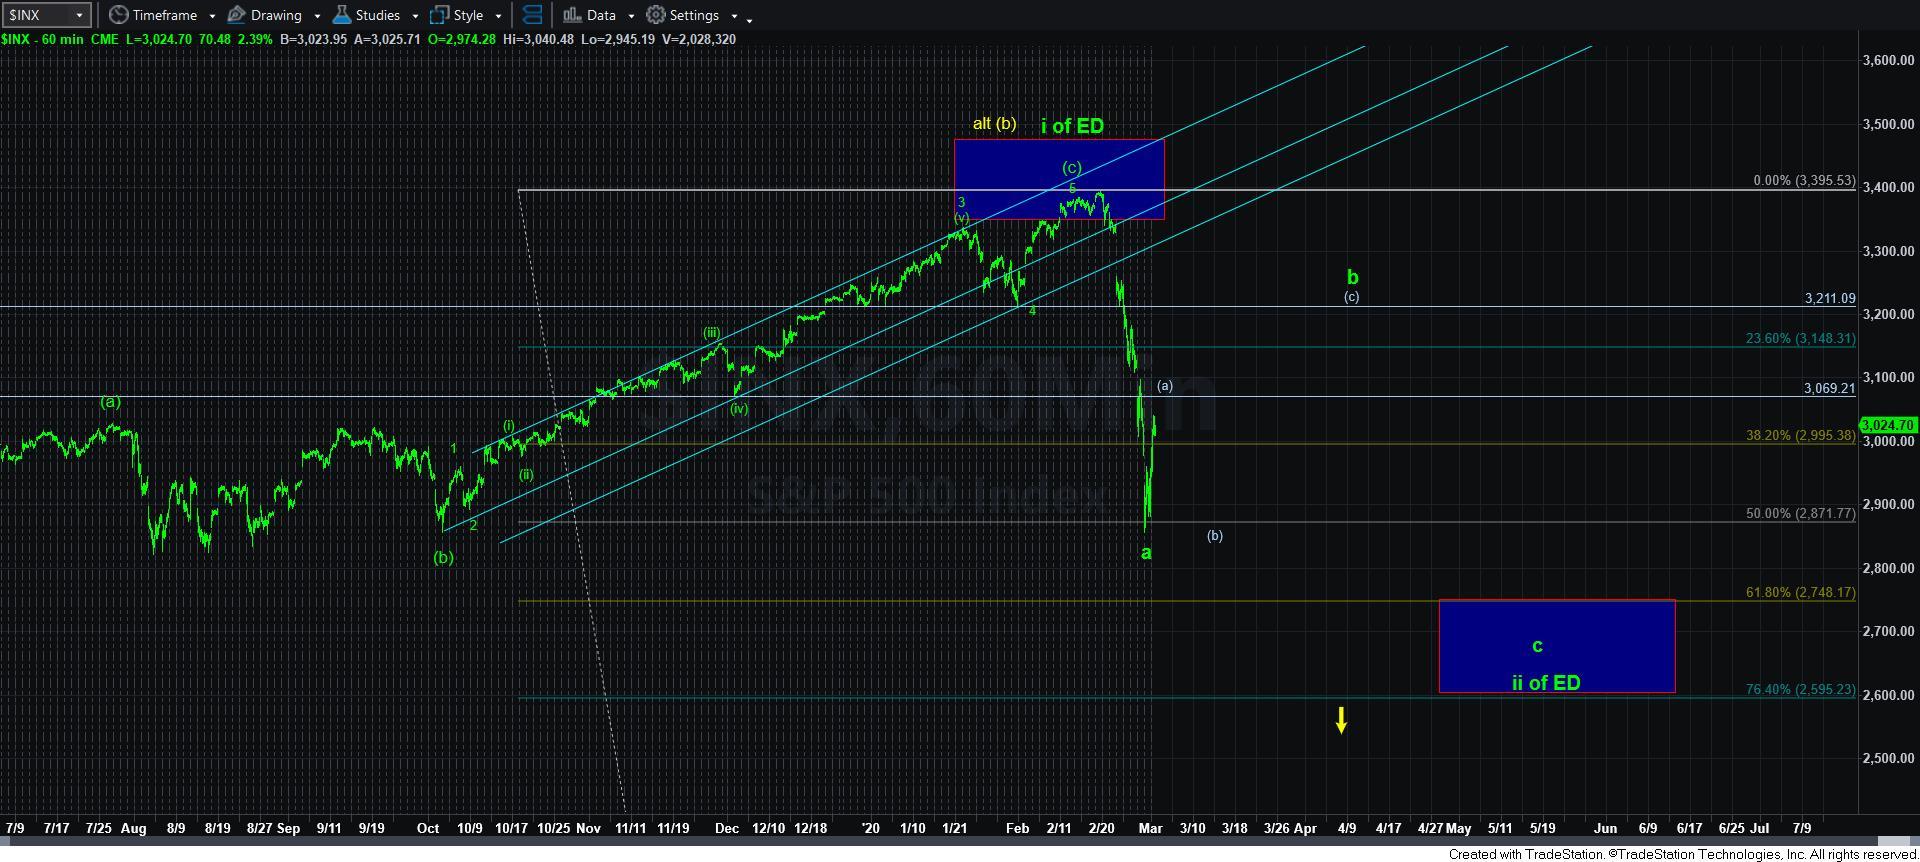
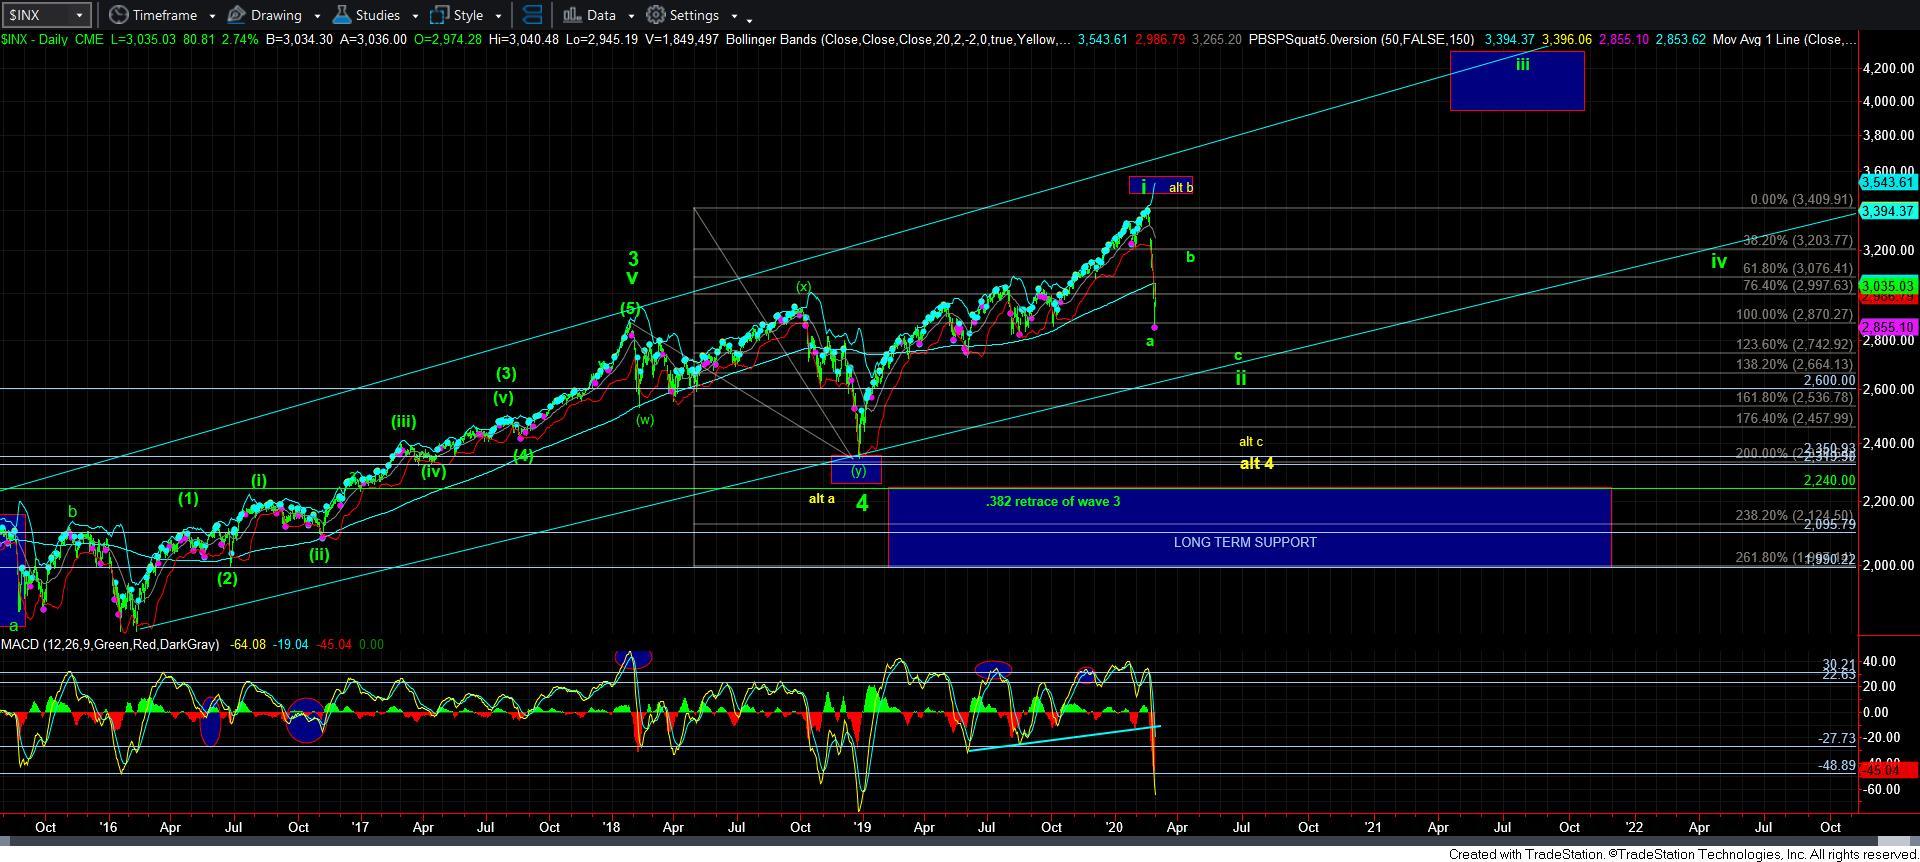
There is also a point I want to make relating to the different potentials in SPX and IWM. My primary count in SPX suggests that this is a wave 2. And the great majority of the time, the initial move down in the market provides us with a very strong break down in the technicals. It is then followed by a b-wave bounce to bring the technicals up off the floor, which is then followed by a c-wave to complete the a-b-c wave ii structure. And, that c-wave will often provide us with a positive divergence relative to the a-wave.
If we are really seeing a wave ii in SPX, then this is the standard and most reasonable expectation. But, if the IWM is going to see a lower low to complete wave v of 3, it could mean that the SPX can present as a stronger chart than the IWM, where it would only strike a double bottom in a [b] wave of the b-wave rally. While this is also based upon a certain amount of conjecture, but it is quite reasonable to expect if the primary count for a wave ii in SPX is correct. If it is not, then odds begin to shift towards the yellow count a bit more.
So, while there are still some questions in the micro structures between the various chart, I am going to maintain the IWM as my primary expectation and go-to chart. This suggests that as long as we remain below 154, I am looking down for AT LEAST one more lower low, and, as it stands right now, two more lower lows to complete the c-wave down.
And, if you are still wondering why I am maintaining this expectation, please re-read my weekend update, as I think I outlined it rather well in that write-up.