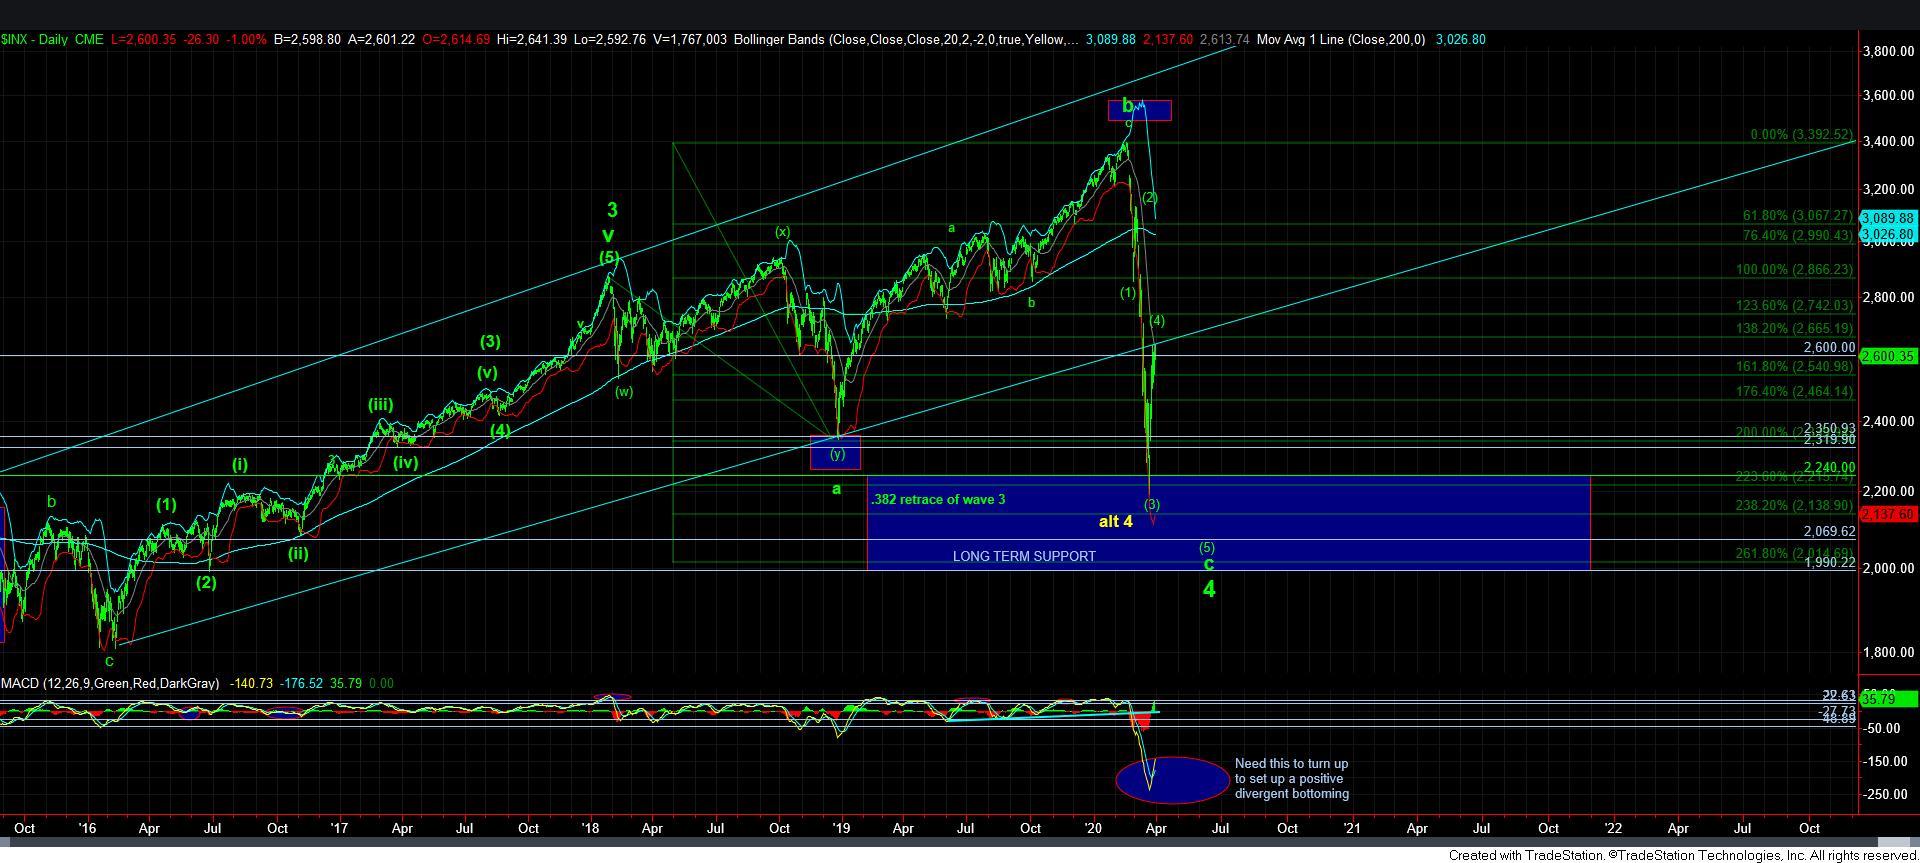
Downside Target Has Not Changed
There are times when the market provides clarity in its micro structure, and there are times it does not. While we were dropping in wave [3] over the past two weeks, the market provided us so much clarity that we were able to call almost every twist and turn we saw during that time. However, if my expectations are correct, and we are in wave [4] now, then it would be expectation that we would see a lack of clarity in the structure.
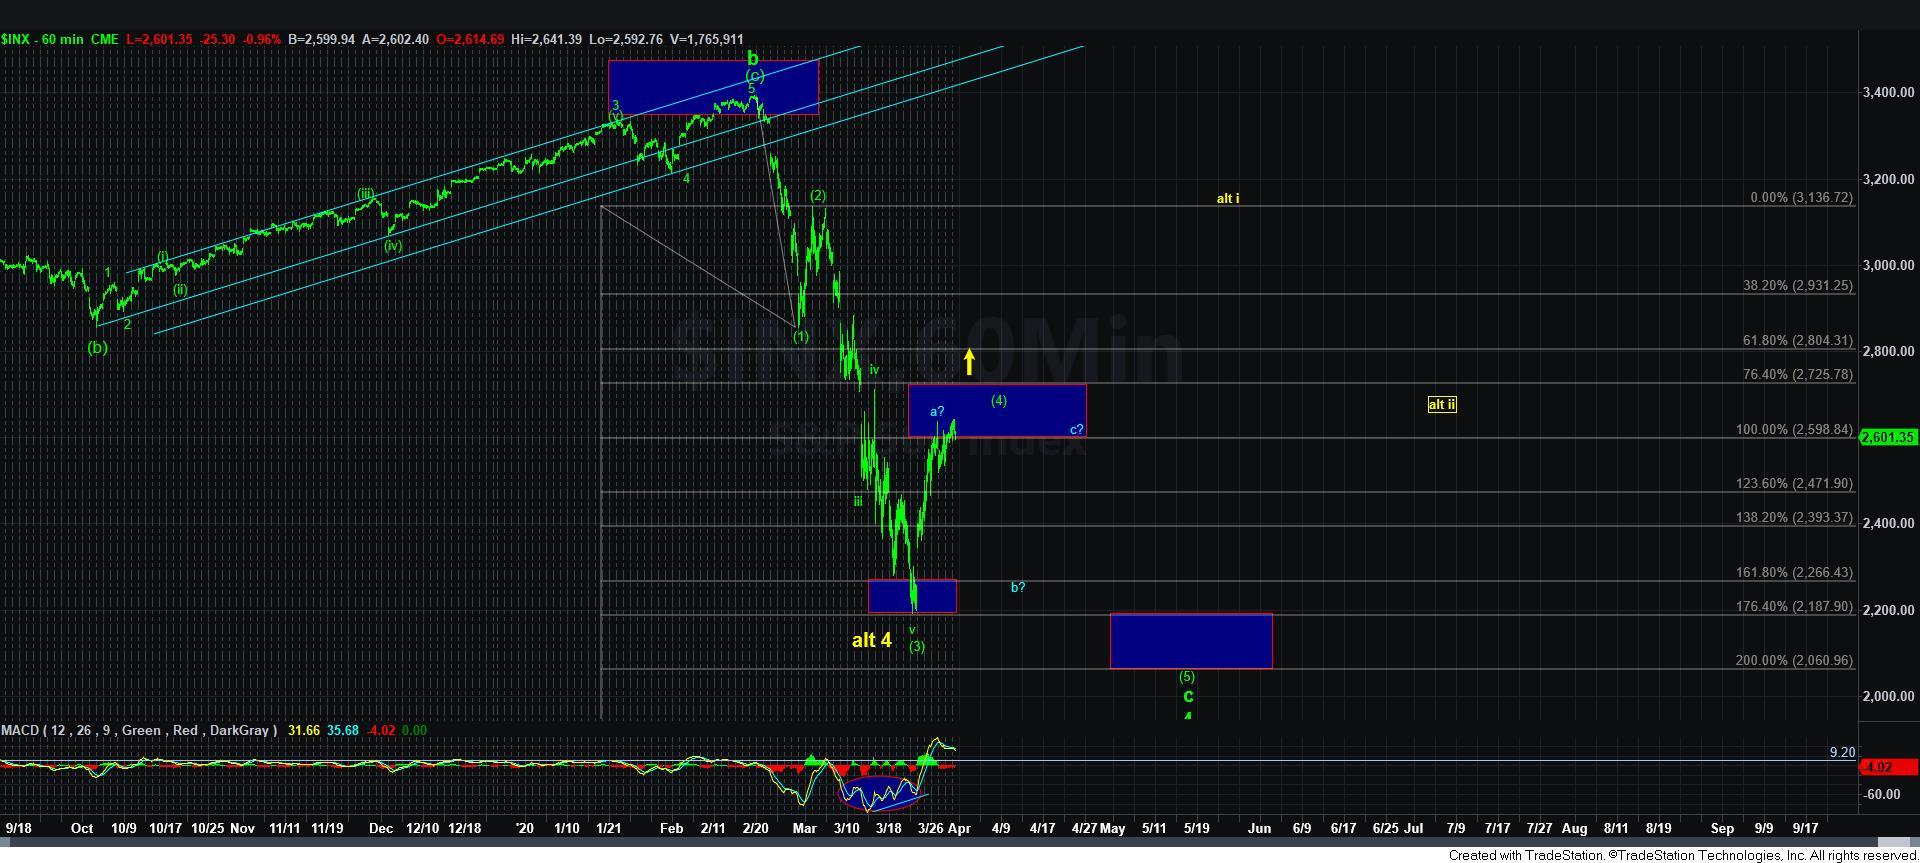
I will continue to remind you that a 4th wave is the most variable of the 5-wave Elliott structure. That often means we need to expect whipsaw and a significant amount of grinding. And, that certainly seems to be what we are seeing of late. You see, 4th waves are consolidation phases wherein the market digests the prior move. This allows the technicals to reset, which is what we wanted to see with the daily MACD on the SPX chart. And, thus far, it has been moving up quite nicely out of the basement. This should set us up for a potential lower low in price (ideal target of 2060 for wave [5]), with the MACD providing us with a positive divergence on that lower price.
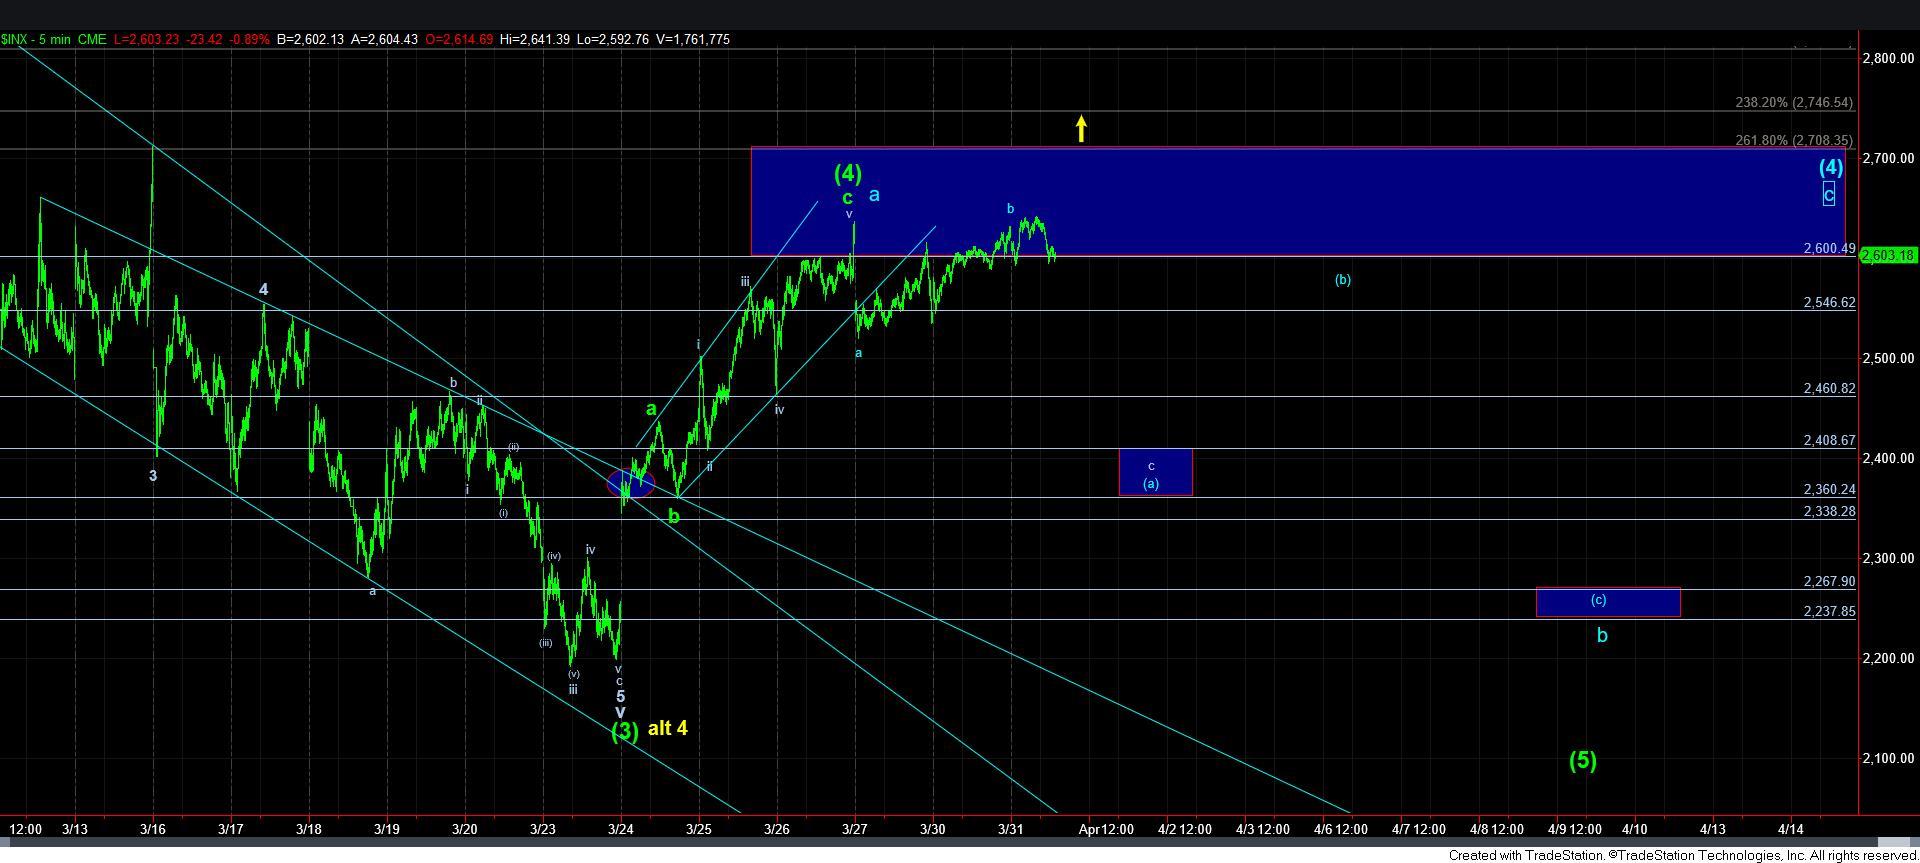
Yet, as the 4th wave takes shape, it often masks its true intentions until most of the b-wave within the a-b-c structure is completed. And, at this point in time, I think we have only begun that b-wave within wave [4] - as presented in the blue count on my charts. So, seeing this grinding and overlapping action was to be expected. In fact, I prepared you for this before we even began the 4th wave. And, I also suggest that trying to outline an exact path during this type of movement is akin to trying to throw Jello for distance.
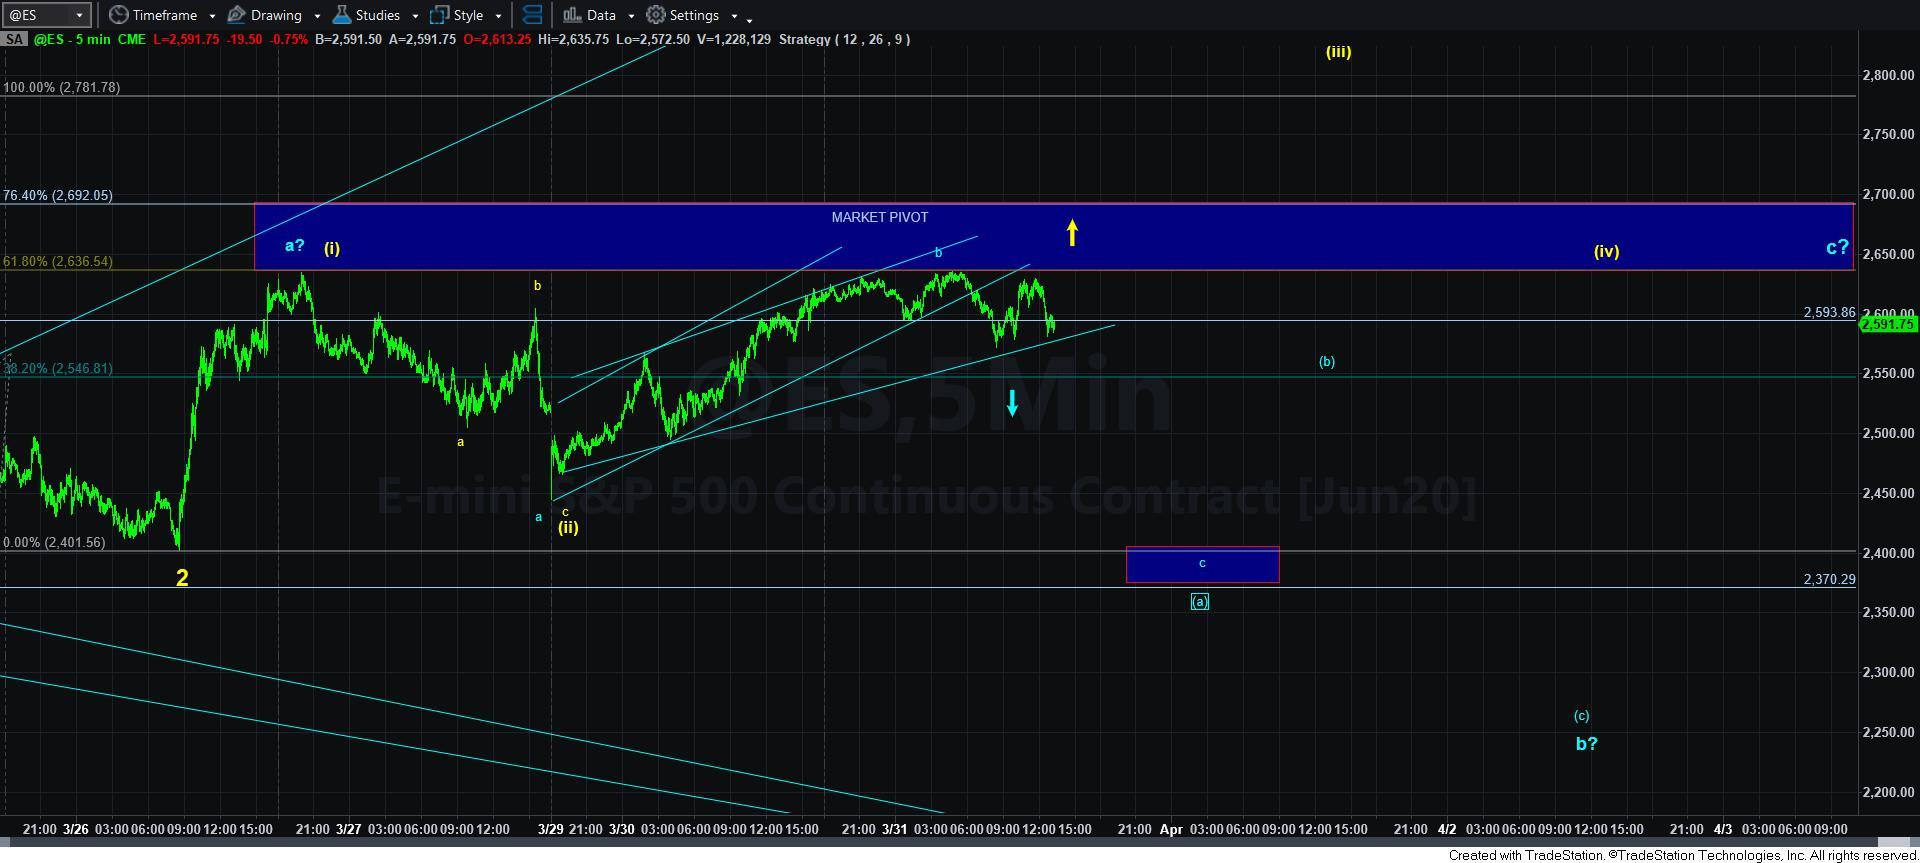
Of course, in order to maintain that expectation of the continuation of the 4th wave, we must not see a break out through the market pivot noted on the attached 5-minute ES chart. A break out through that region opens the door to the alternative wave count wherein wave 4 may have completed at the prior lows. I outlined this in detail in the weekend analysis.
So, as long as we remain below that market pivot, I will continue to expect more whipsaw as we complete wave [4], and especially within the b-wave of wave [4].
In the alternative, should we see a strong move through the market pivot, I would view us as being in wave [iii] of wave i of 5, and you can always buy more long positions on the pullback to the pivot from above, and use a stop just below the pivot.
Ultimately, if the market has truly bottomed already, then I would expect wave i of 5 (in yellow) to take us up towards the 3070-3150SPX region (as shown on the 60-minute chart), with a wave ii pullback thereafter taking us back down towards the region we find ourselves today.
So, in summary, as long as we do not see a strong move through the market pivot on the 5-minute ES chart, then I maintain an expectation for more whipsaw within the b-wave of wave [4]. And, while I have a proposed path placed on the chart, it still can take twists and turns which I am unable to foresee at this time.