Downside Structure Continues To Develop
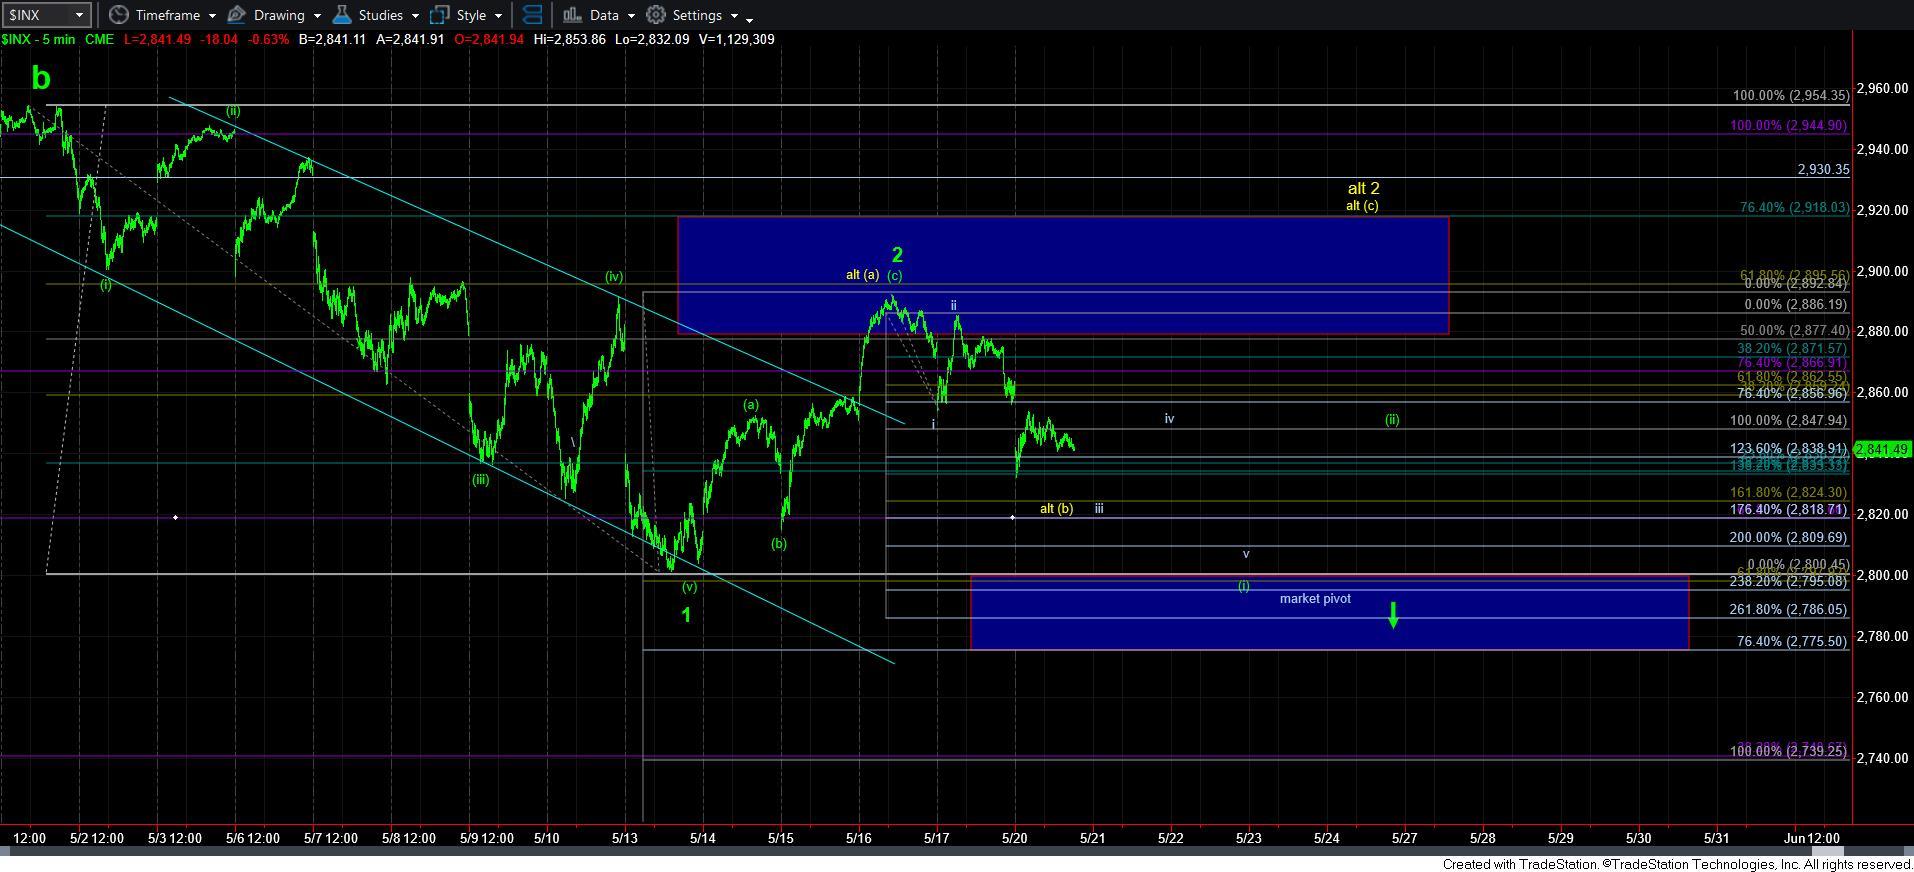
With the downside follow through today, the market is attempting to fill in wave [i] of 3 to the downside. However, until it completes a full 5 waves down, I am leaving the potential for a bigger wave 2 to take shape on the chart as presented in yellow.
As of today, based upon the Fib levels we have struck, I have to assume that we are still only in wave iii of (i) down, with today’s rally representing a 4th wave in wave iii of [i], since it bounced to the .764 extension of waves i and ii. That is the common target for a 4th wave within wave iii down. That means we need to drop down towards the 2824SPX region to complete wave iii down in the 1.618 extension region, followed by a bounce back to the 2845-50SPX region for wave iv, followed by a lower low in the 2810SPX region to complete wave [i] down in a standard fashion.
Until such time we are able to break below 2824SPX with a full 5-waves down, I am going to maintain the yellow count on the chart. Moreover, should we see a move back up through the 2857SPX region before we complete that downside structure, it would open the door to the [c] wave of wave 2 rally, as presented in yellow.
So, as the market continues to subdivide lower, I am patiently waiting for a full 5 waves to the downside to suggest the trap door has opened. And, once waves [i] and [ii] are in place, the market can then step into that trap door, and begin a strong decline in the heart of a potential 3rd wave down, which can present us with a waterfall event. But, until such time we have that set up in place, I am going to remain a bit more patient.