Downside Setup Busted – For Now
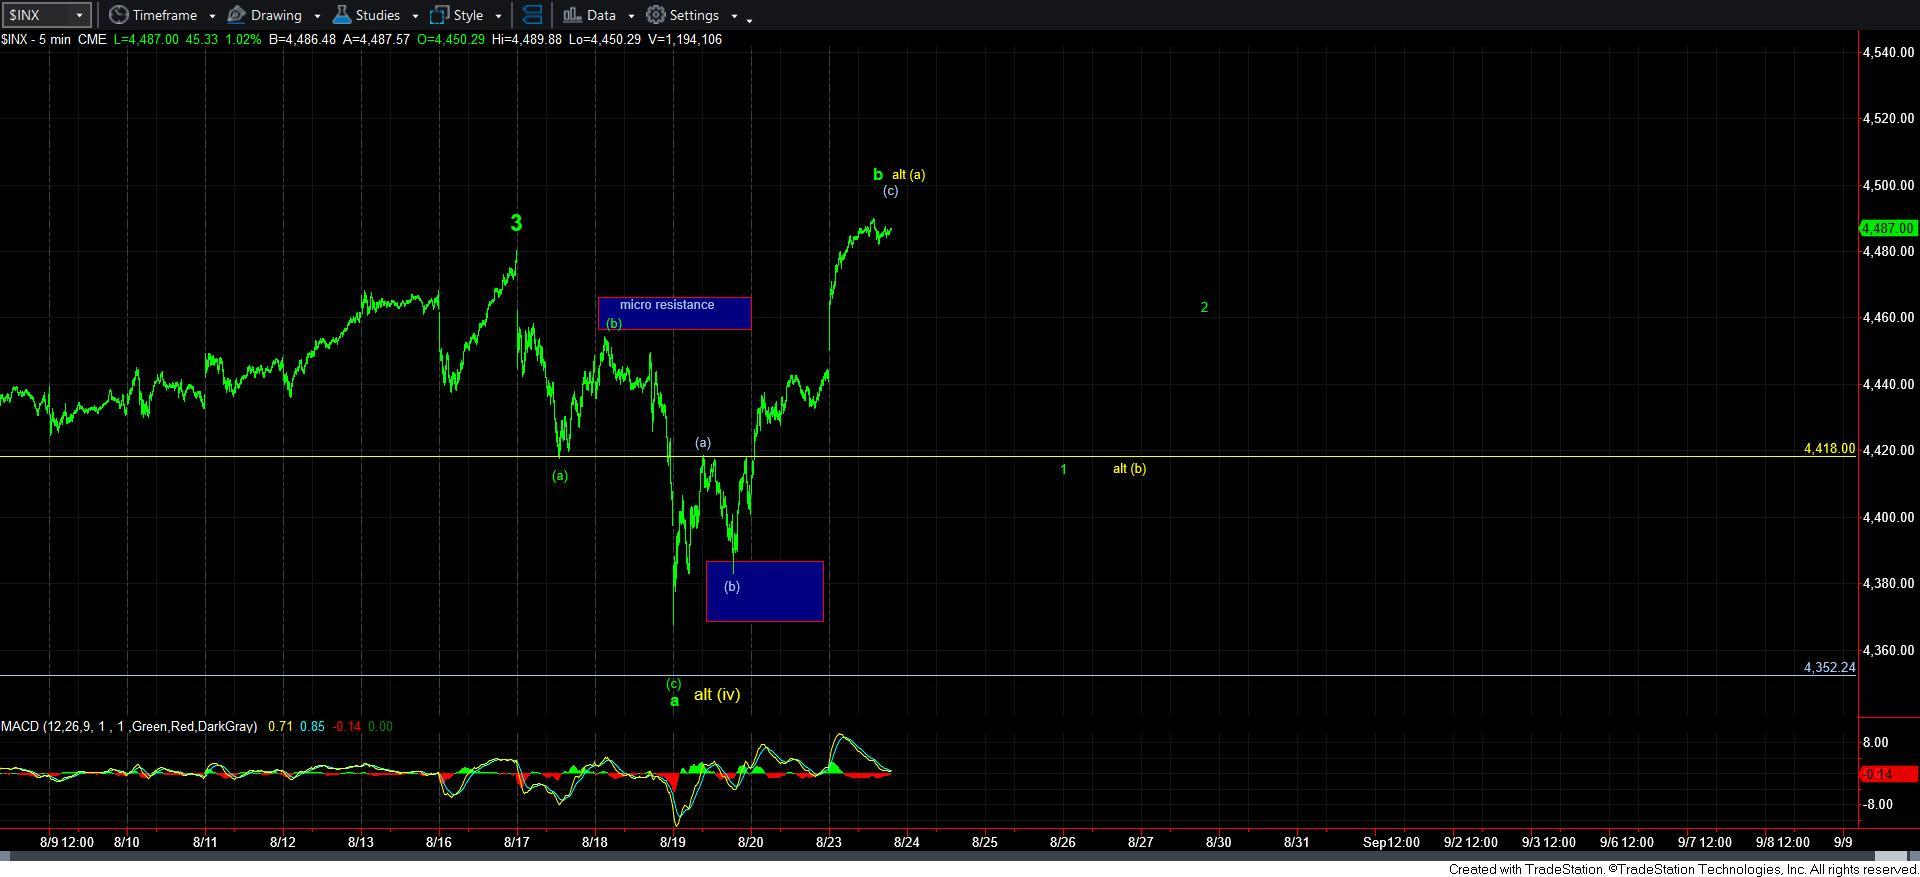
Within a bear market, or even within a bigger corrective structure, when we see the type of a-b-c potential corrective set-up the market provided us into the close on Friday, 70-80% of the time you will see a downside resolution. However, when we are in a strong bull market, it is not advisable to short these types of set-ups, unless they confirm their intentions to the downside.
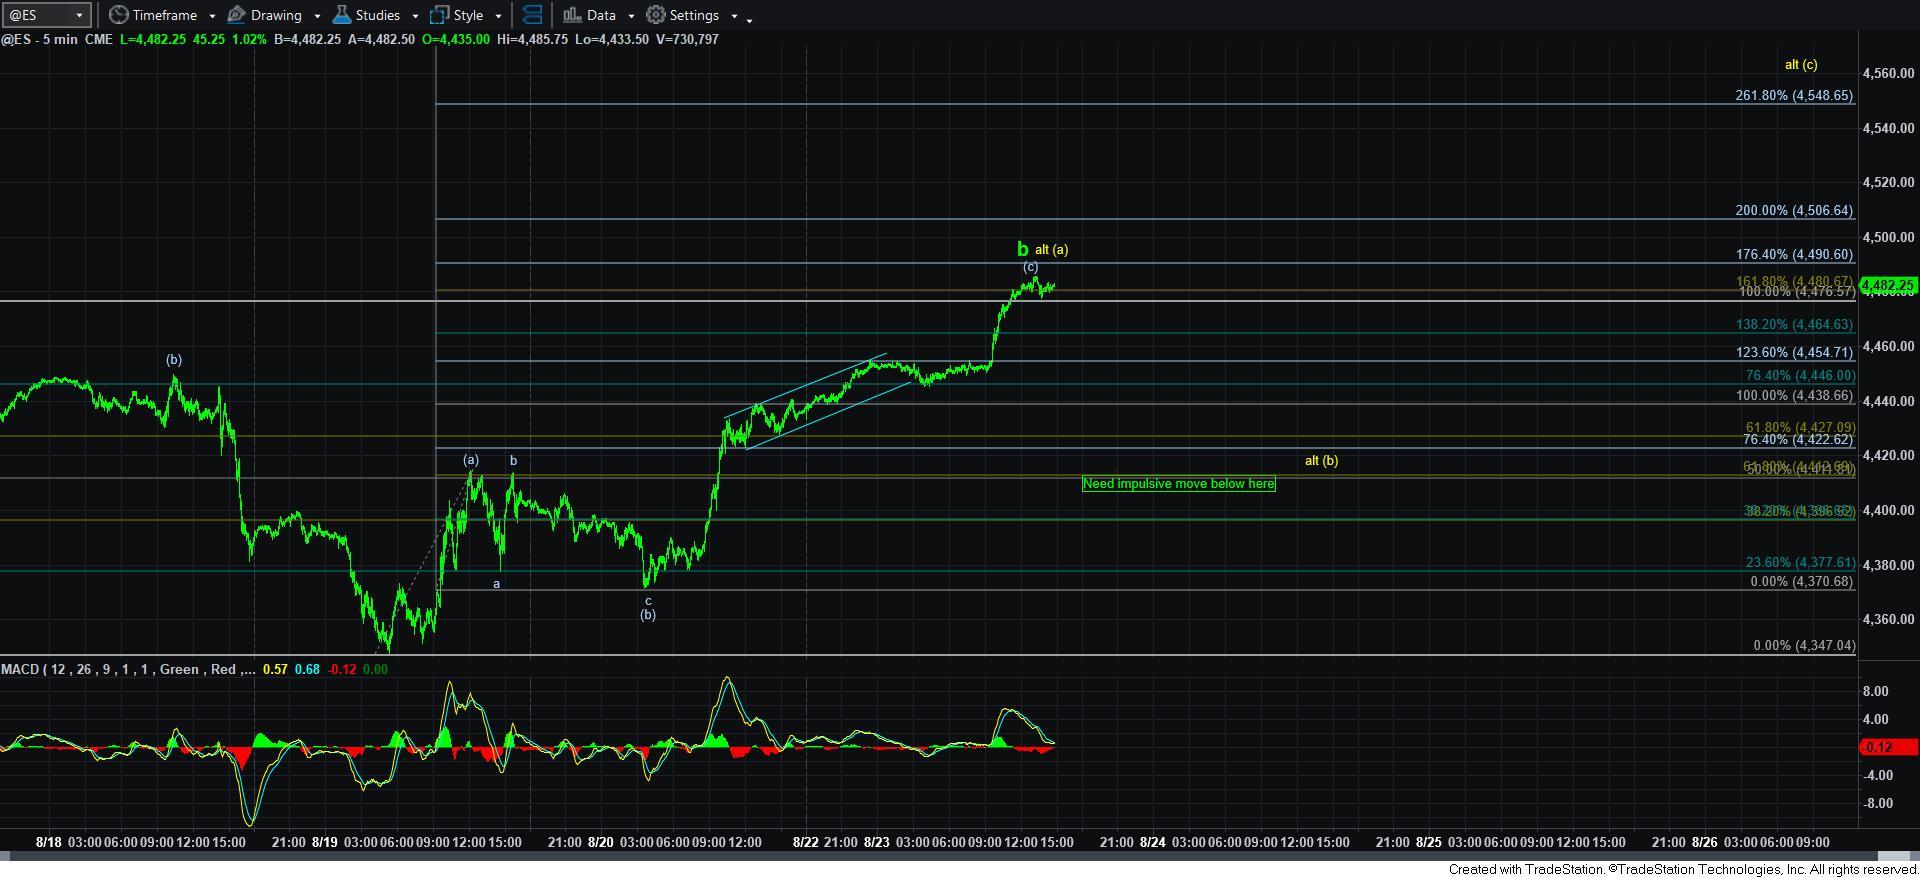
Clearly, the market took the other side of this trade, and broke over resistance and provided us with the marginal higher high I expected if we saw such a break over resistance. And, we still may push even just a bit higher before this tops out.
Yet, that does not completely invalidate the potential for this to be a b-wave rally. Yes, b-wave rallies can make higher highs. While I did not expect one in this instance, it still may be a b-wave rally. But, the question then becomes if you should trade aggressively for the c-wave down right now? At least to me, the answer is a clear “heck no.”
Shorting during a bull market, especially during a larger degree 3rd wave is never advisable. I was trying to explain this towards the end of the week and into the weekend update, especially when I saw a number of members licking their chops at shorting this market and expecting much lower levels to be seen. Pullbacks for most investors are buying opportunities, not shorting opportunities.
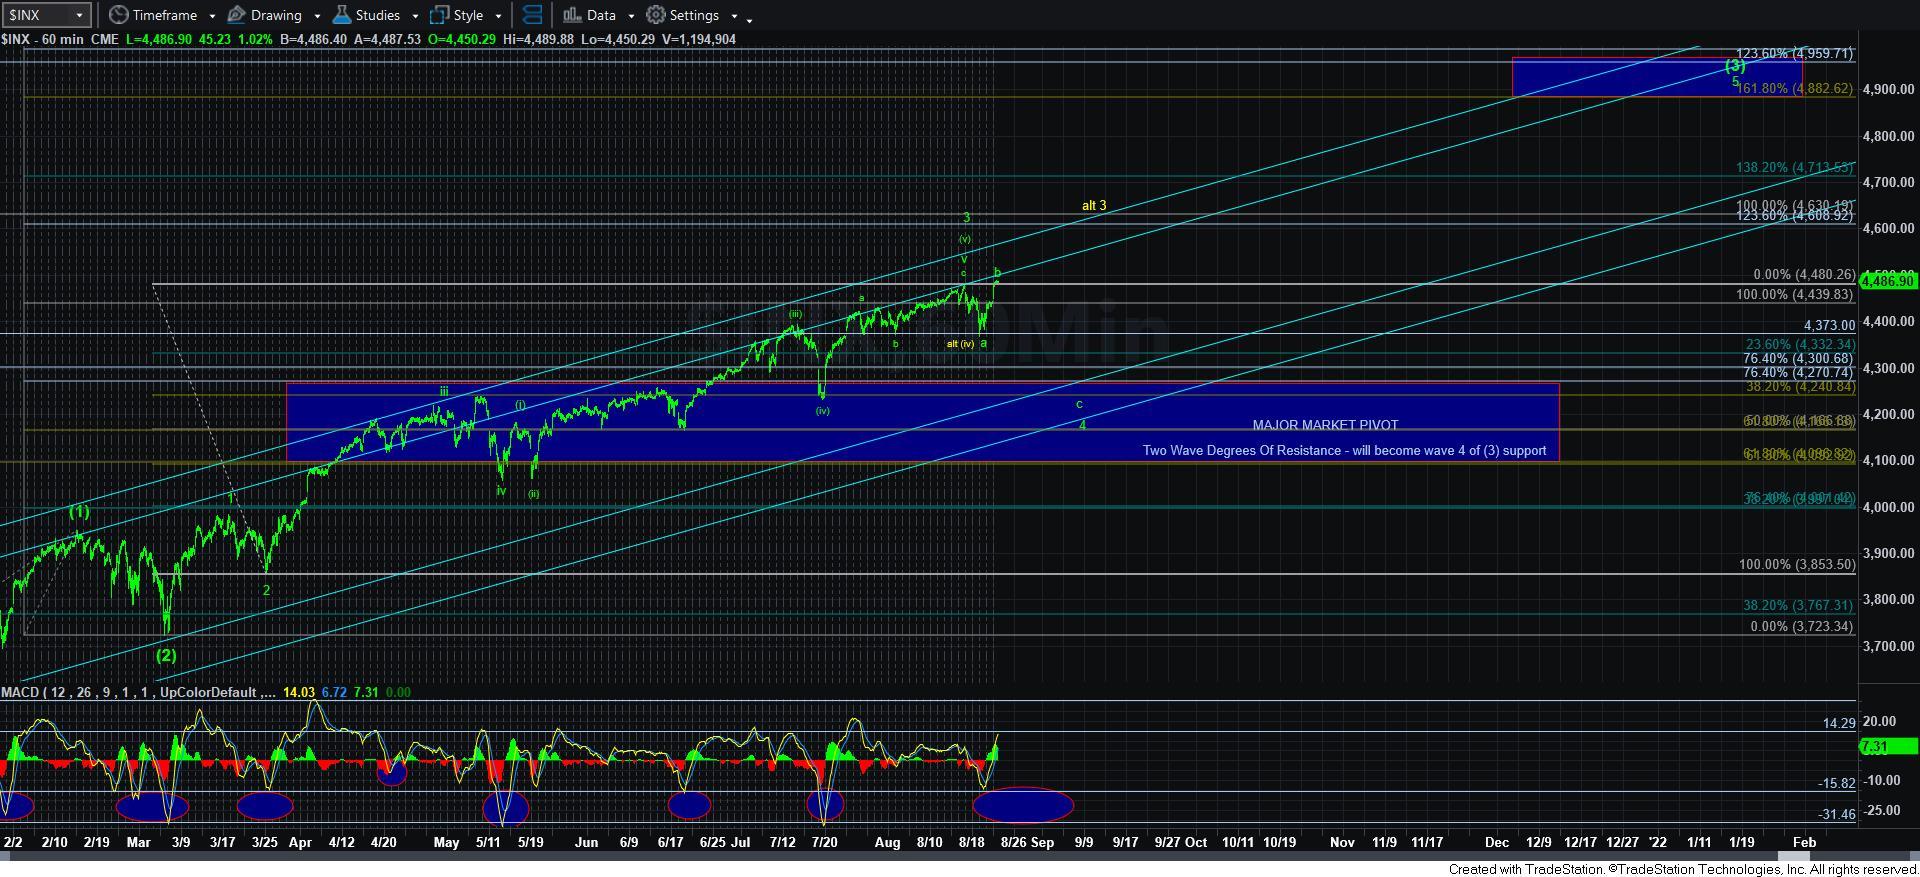
Now, with this push higher, it has opened the door to the alternative potential – as I see it now – that wave 3 has not yet completed, and is still attempting to grind higher towards 4450-4600SPX. However, with the move higher, I cannot say that I have a high probability resolution right now. Rather, I need to see how the next pullback takes shape. If the next drop is clearly a 5-wave impulsive decline, then I will view it as wave 1 of the c-wave down, as shown in green on the 5-minute SPX chart – and will view us as heading lower in wave 4. However, if the market only provides us with a corrective pullback, then I am moving back into the wave 3 pattern, and looking towards 4550-4600SPX again before we complete wave 3.
Now, to add a bit more drama to the current 4th wave potential Luke Millier’s Bayesian analysis (which has been outstanding in 2021), calculates the current wave 4 decline potential at 68% at this time. That is rather significant. Therefore, we “should” be seeing a confirming 5-wave decline over the coming week.
I know this has seemed quite difficult and complex of late as we are attempting to identify where wave 3 can finally end, but the overlapping structure which began in May has made this much more complex than we usually see. Most often, we are simply decline after the conclusion of a 5-wave structure, which makes it relatively easy to identify the top of wave 3 and the start to wave 4. But, not so in our case due to the overlapping structure since May.
Nevertheless, I still think it to be reasonable to expect a 4th wave pullback which can be 200-300 points. And, the next decline will tell if we see that now, or if it gets pushed off again by a few weeks until we complete this structure towards 4550-4600SPX. Based upon Bayesian probability analysis, I am going to be looking for that 5-wave decline structure this week.
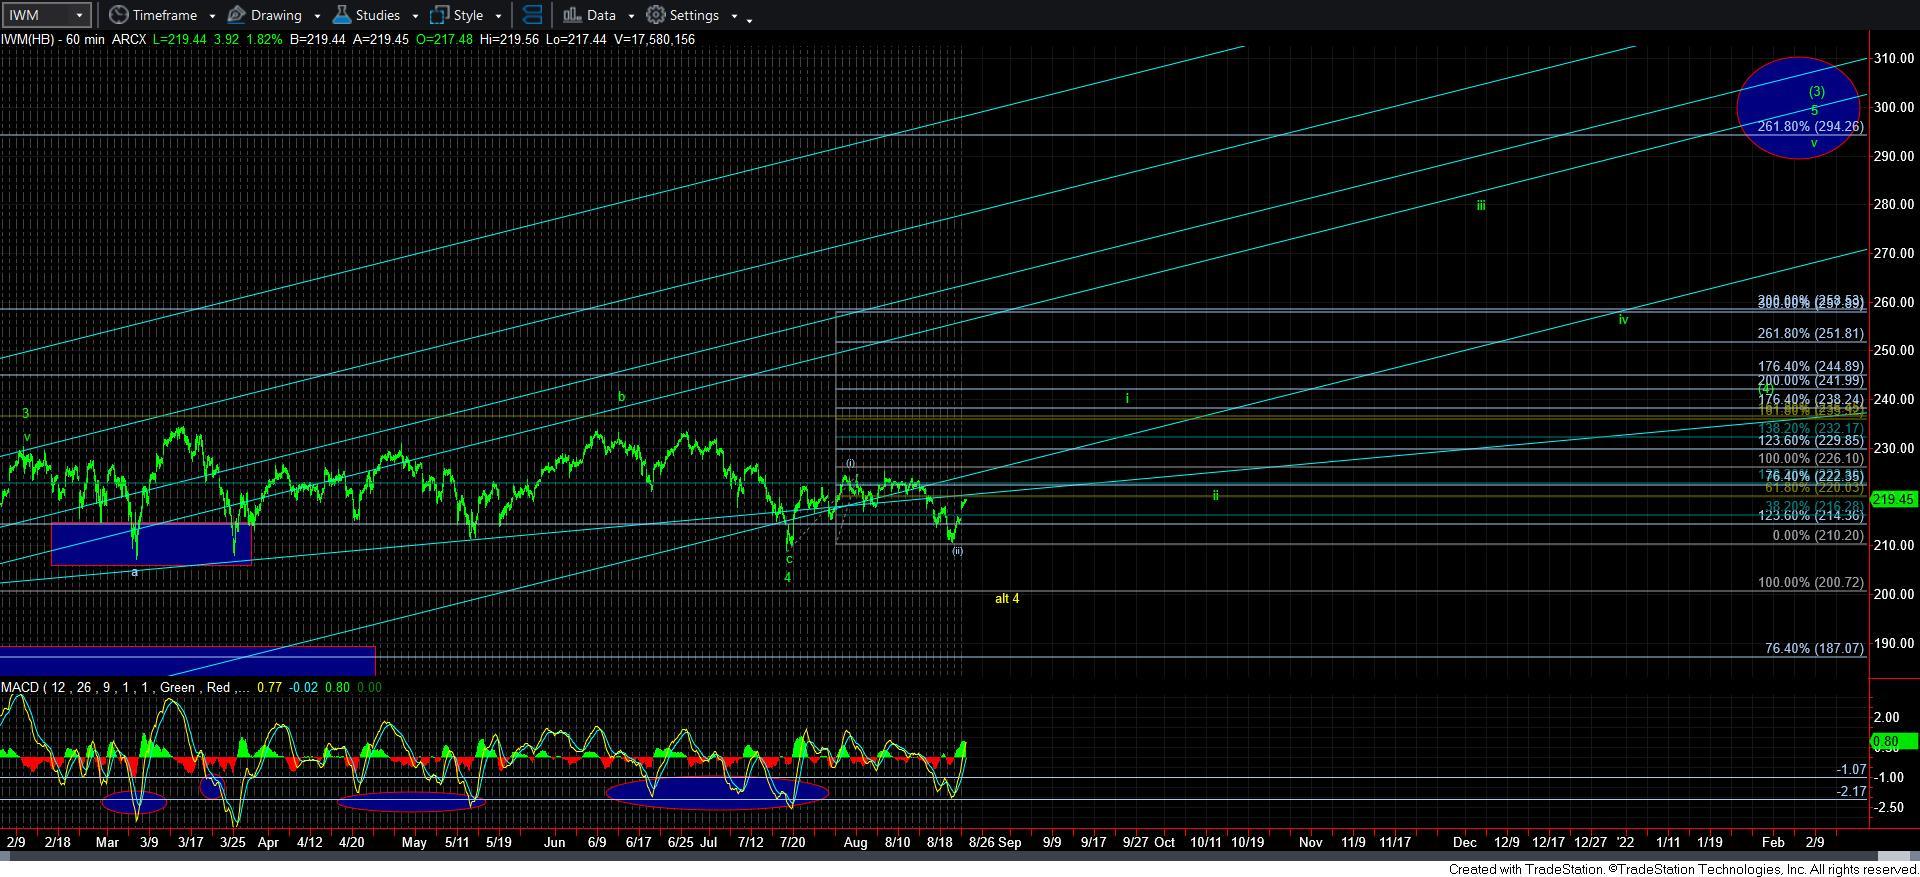
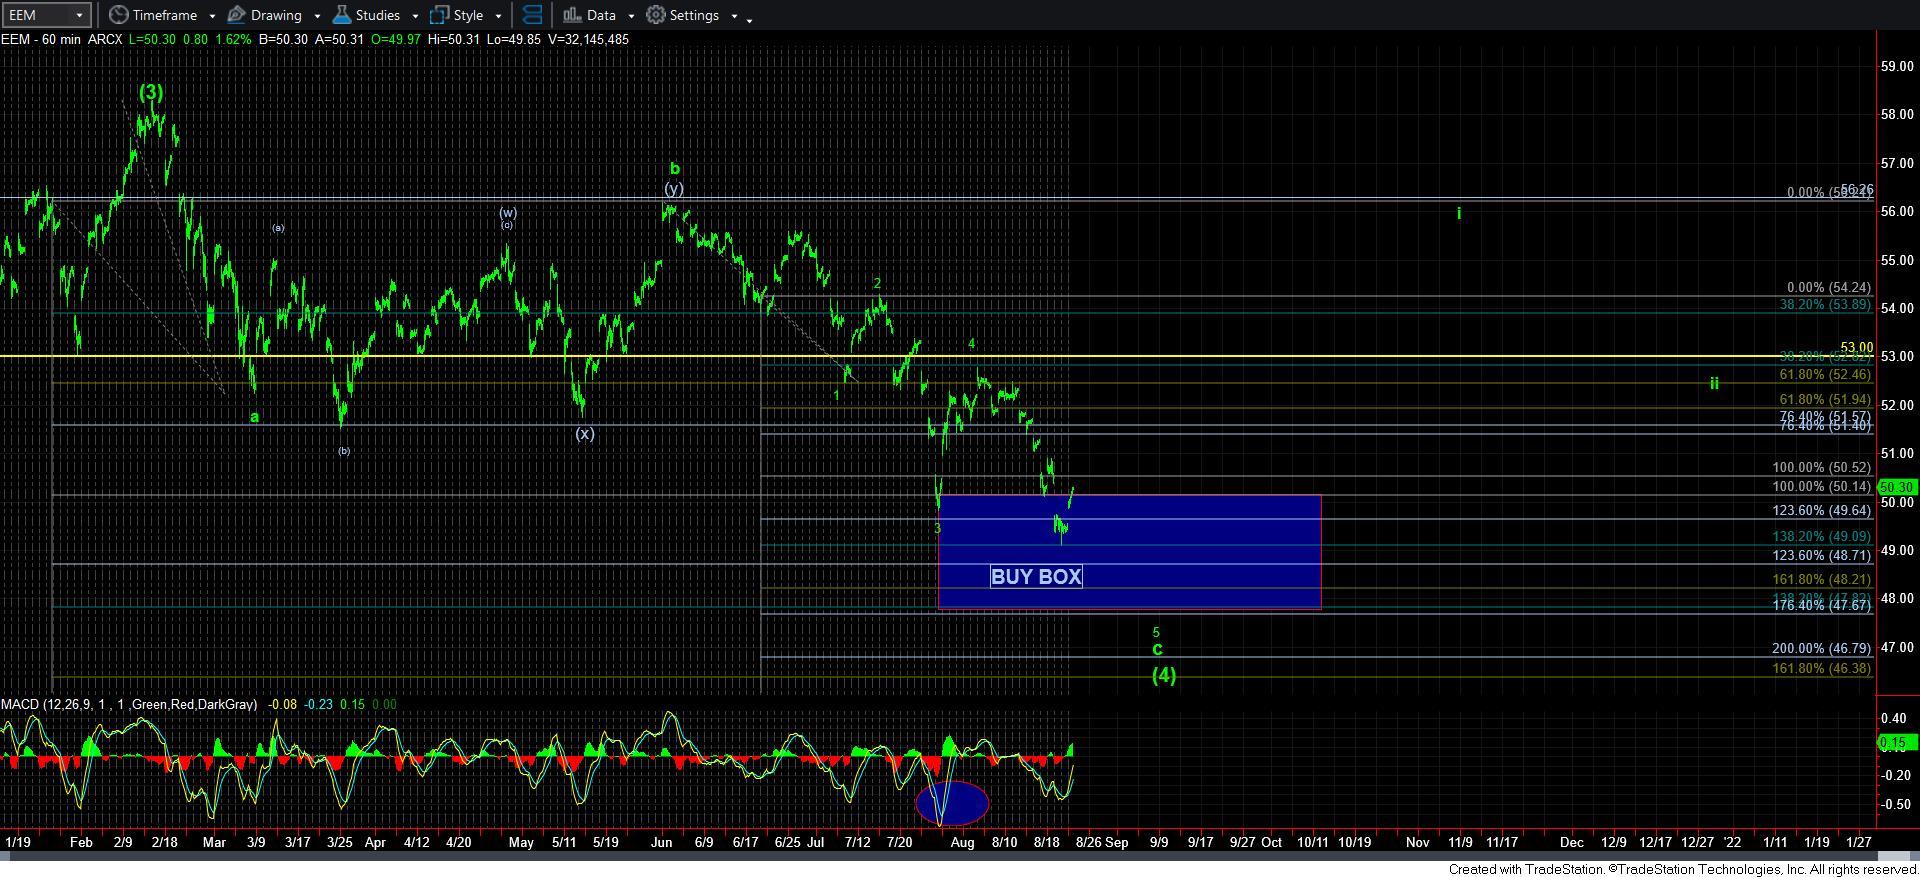
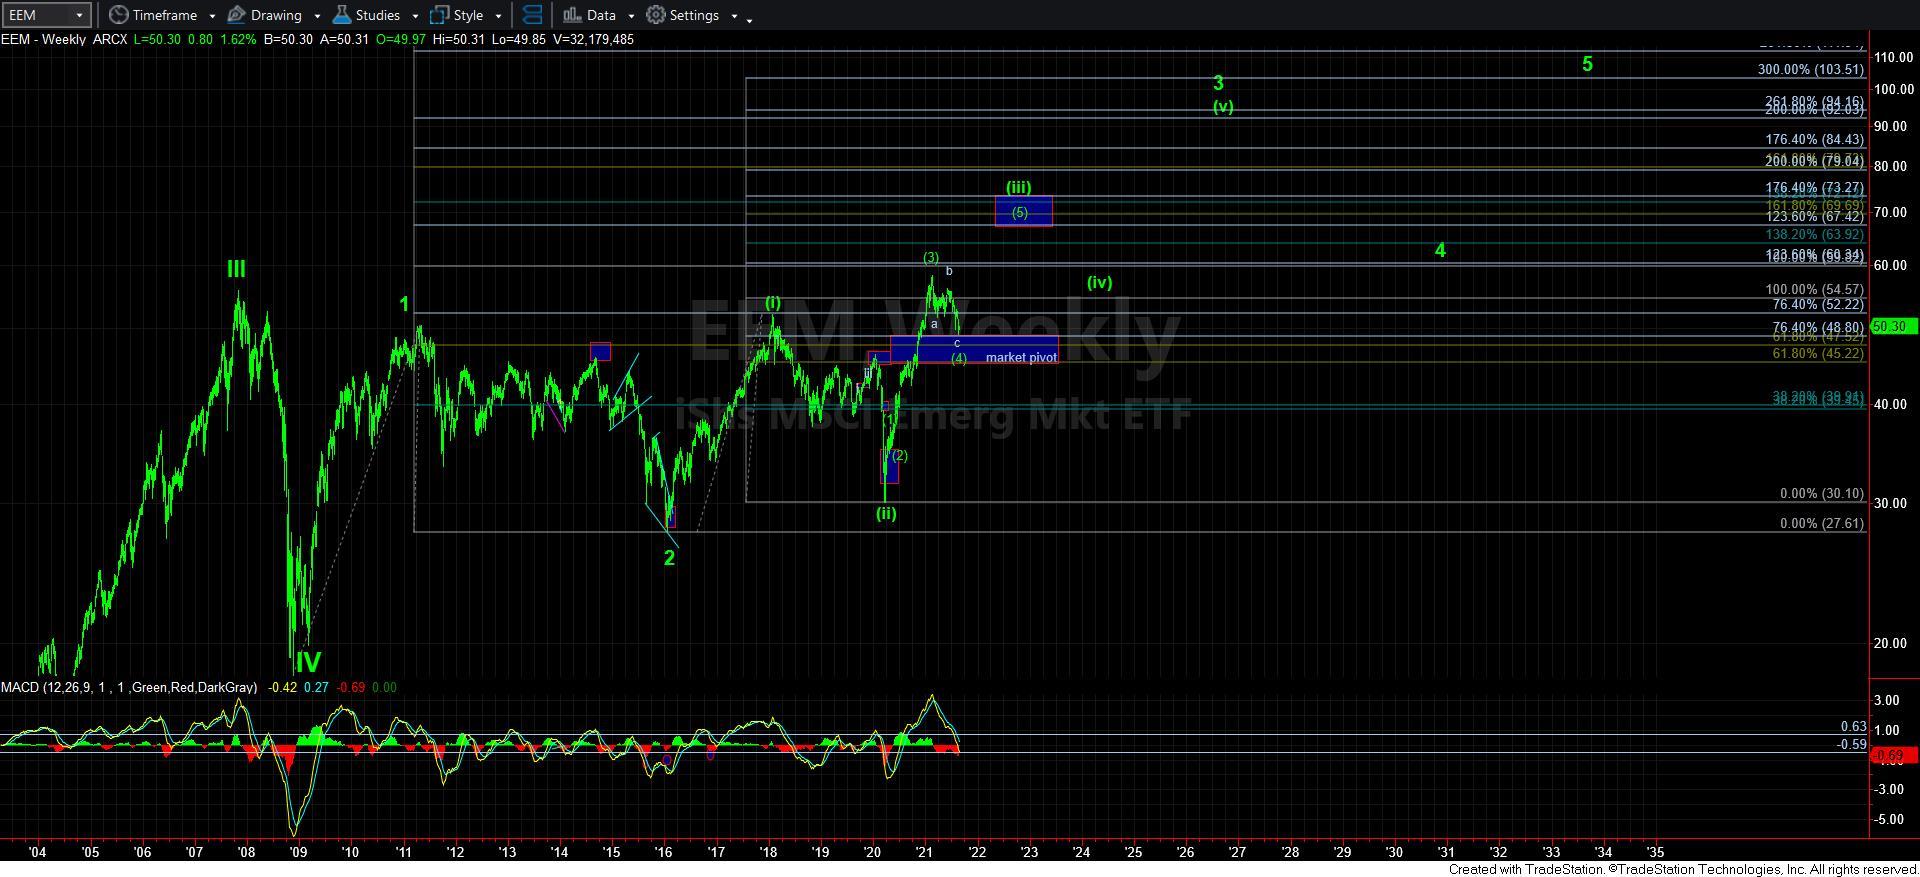
I want to make a couple of points about EEM and IWM at this time. As I have been outlining, and some even say table-pounding, both of those charts have been in 6 months consolidations. To expect further downside as a slam dunk in either of them is a bit of a push. In fact, the upside potential so far exceeds their downside risk that I have been trying to bring this to your attention as often as I can. Ideally, I still think that EEM can see the 47.50 region. But, please view both of these charts within their bigger perspectives rather than trying to micro every penny out of them.
Now, should the SPX continue higher in wave 3, I can easily see this being the start to wave 5 of [3] in the IWM. In fact, such a move could see some significant outperformance in the IWM as it rallies to complete wave i of 5. However, this will not run away without us. I would further expect a sizable wave ii pullback in IWM during the wave 4 pullback I still expect in the SPX.
As far as EEM is concerned, the same rally may only be a [b] wave within this final 5th wave down in EEM. So, for now, nothing has really strongly suggested that EEM has completed its decline in the smaller degree count.
So, in conclusion, with the break out over 4450SPX resistance, the market has again opened the door to another extension in wave 3 towards the 4550-4600SPX region. However, I am unable to walk through that door unless the next decline in the market is clearly corrective. I will be watching that next decline quite carefully, and will clearly be updating you as it develops.
At the end of the day, you must continually remember that this is a bull market with much higher levels to be seen over the coming year or two. And, often, surprises come to the upside in bull markets. So, unless the market provides us with a confirmed downside set up which has triggered in an impulsive c-wave decline, I am again going to caution about aggressively shorting during a bull market.