Downside Set Up In Place
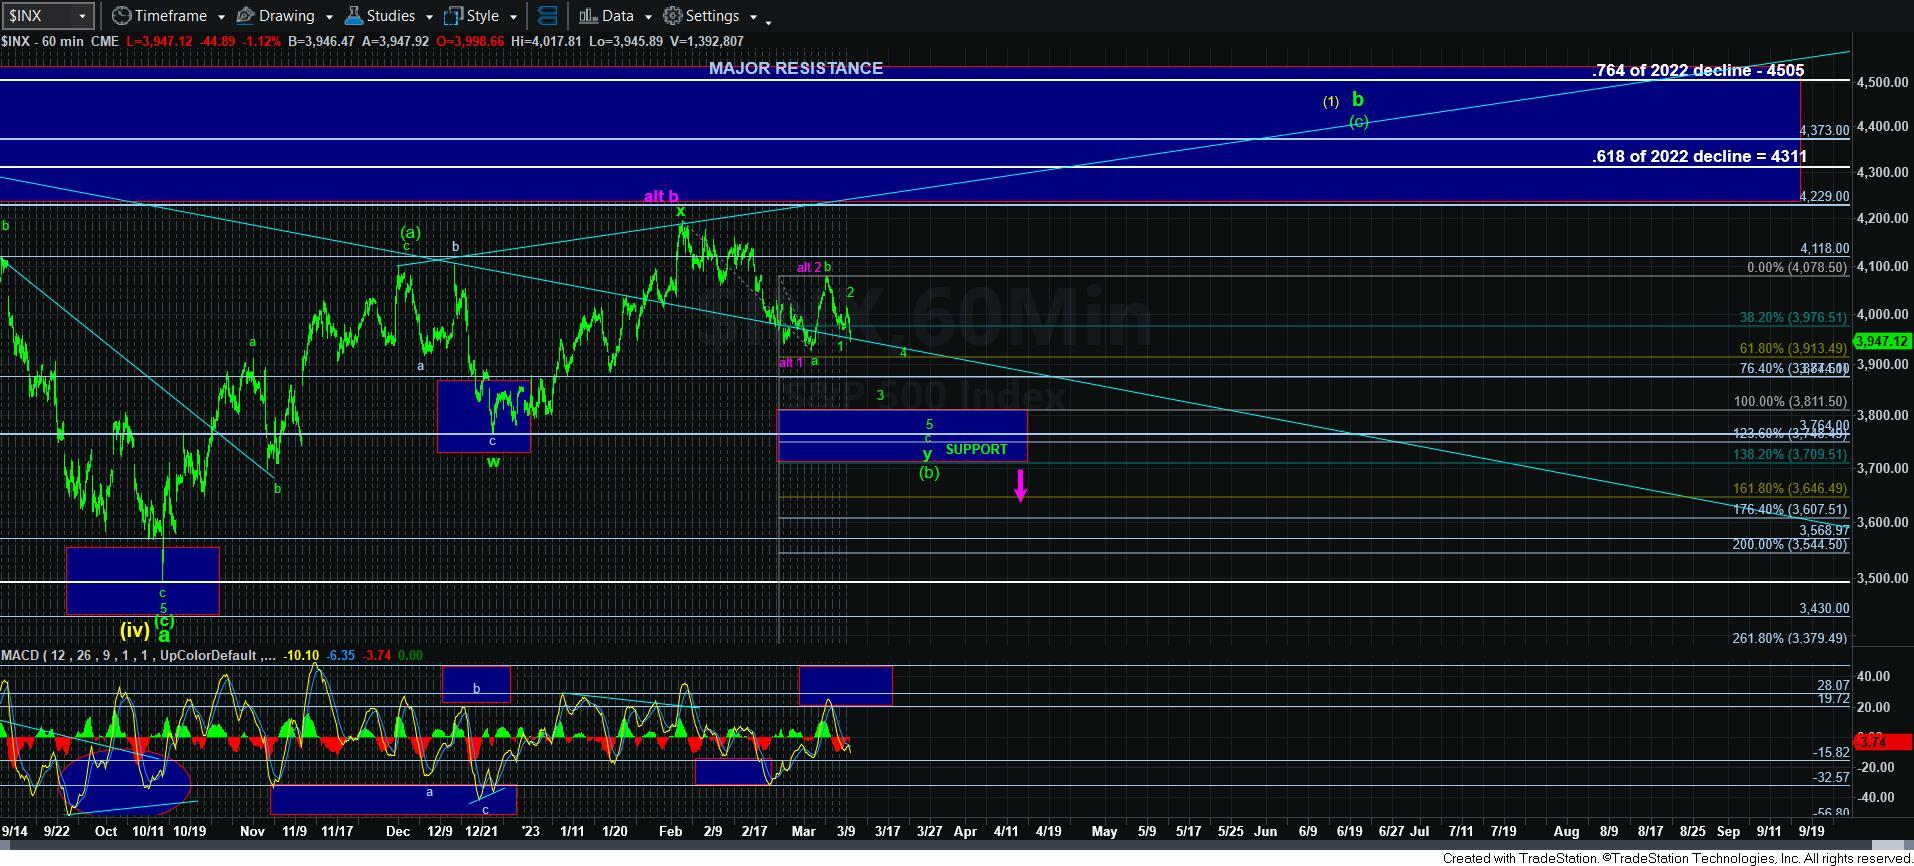
Early this week, as we were hovering near the highs struck this week, I wrote an update much earlier than normal to warn you that this may be all we get in this rally if the market intended to drop us down to the larger support box on the 60-minute chart. And, not long thereafter, we began what counted relatively well as an initial 5-wave decline.
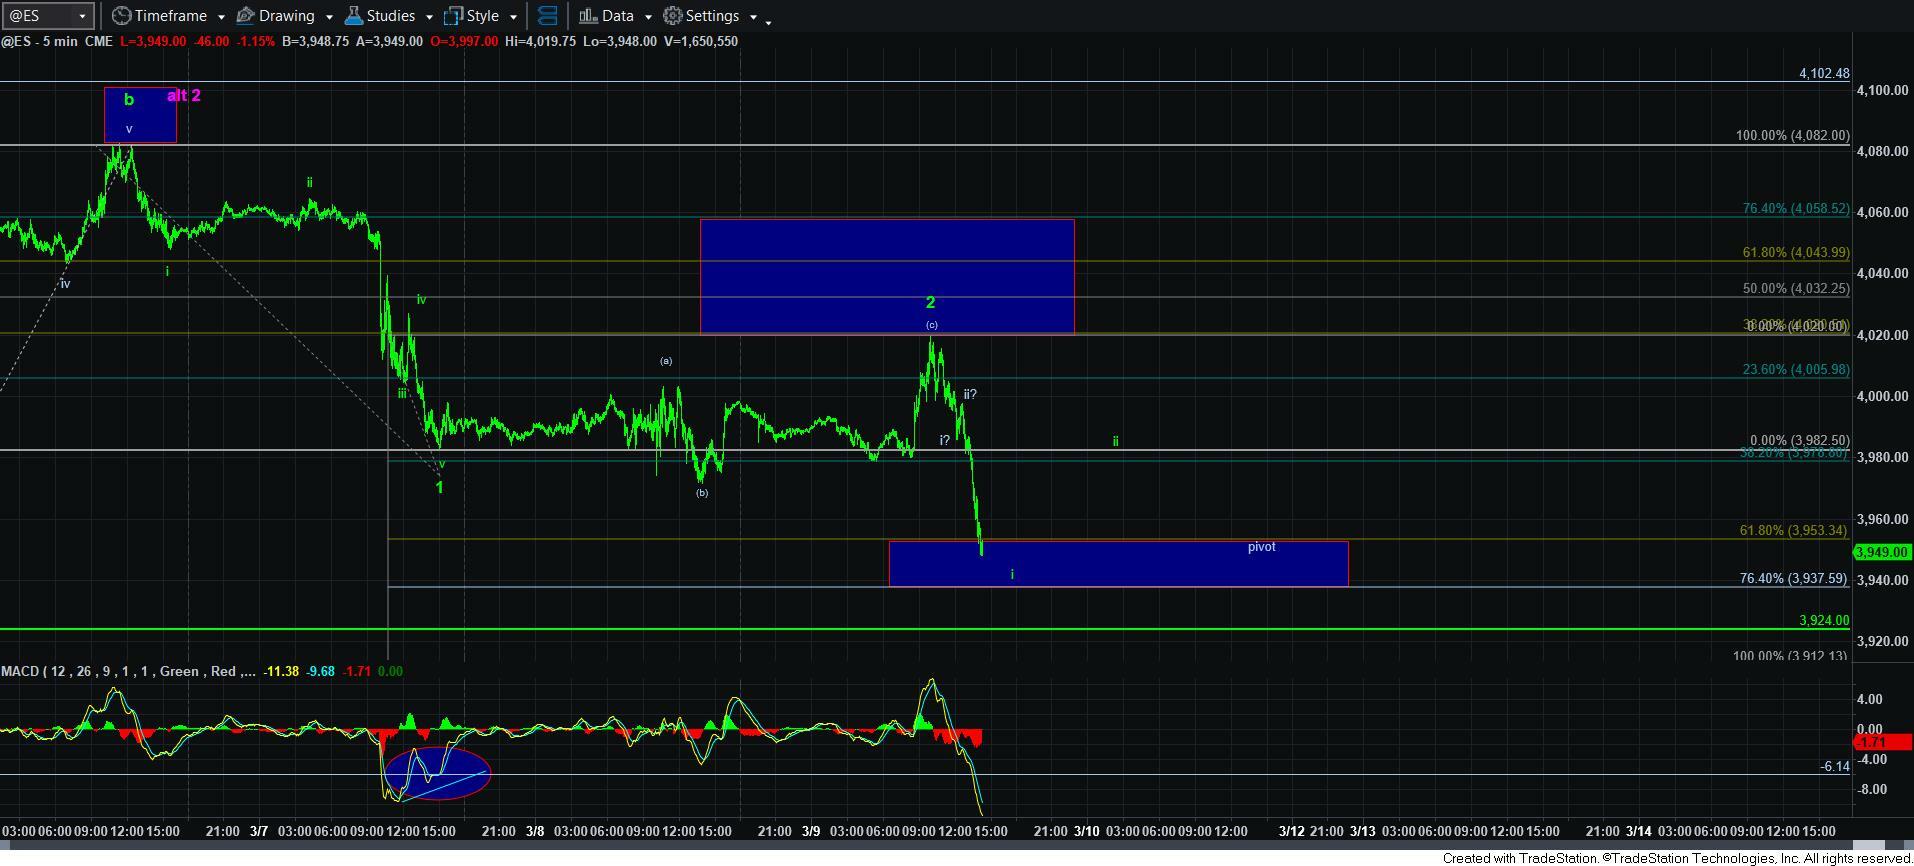
Since that time, the market has been providing us with an overlapping corrective structure, and this morning, we rallied exactly to the bottom of our resistance box outlined as a potential wave 2 retracement.
Since we struck the box this morning, the market has been dropping persistently, which is indicative of the start of a 3rd wave down.
Now, normally, the market targets the .382-.618 extensions of wave 1 and for wave i of 3, with sometimes providing us with an extended wave i to the .764 extension. However, once we are through the .764 extension it is not likely a wave i anymore, but most likely we would be within wave iii of 3.
As it stands right now, the market is hovering over the .764 extension. If we do not see a bounce very soon, and break down below the .764 extension, then there was likely a very small i-ii structure that took shape over the .382 extension which would actually look like a leading diagonal.
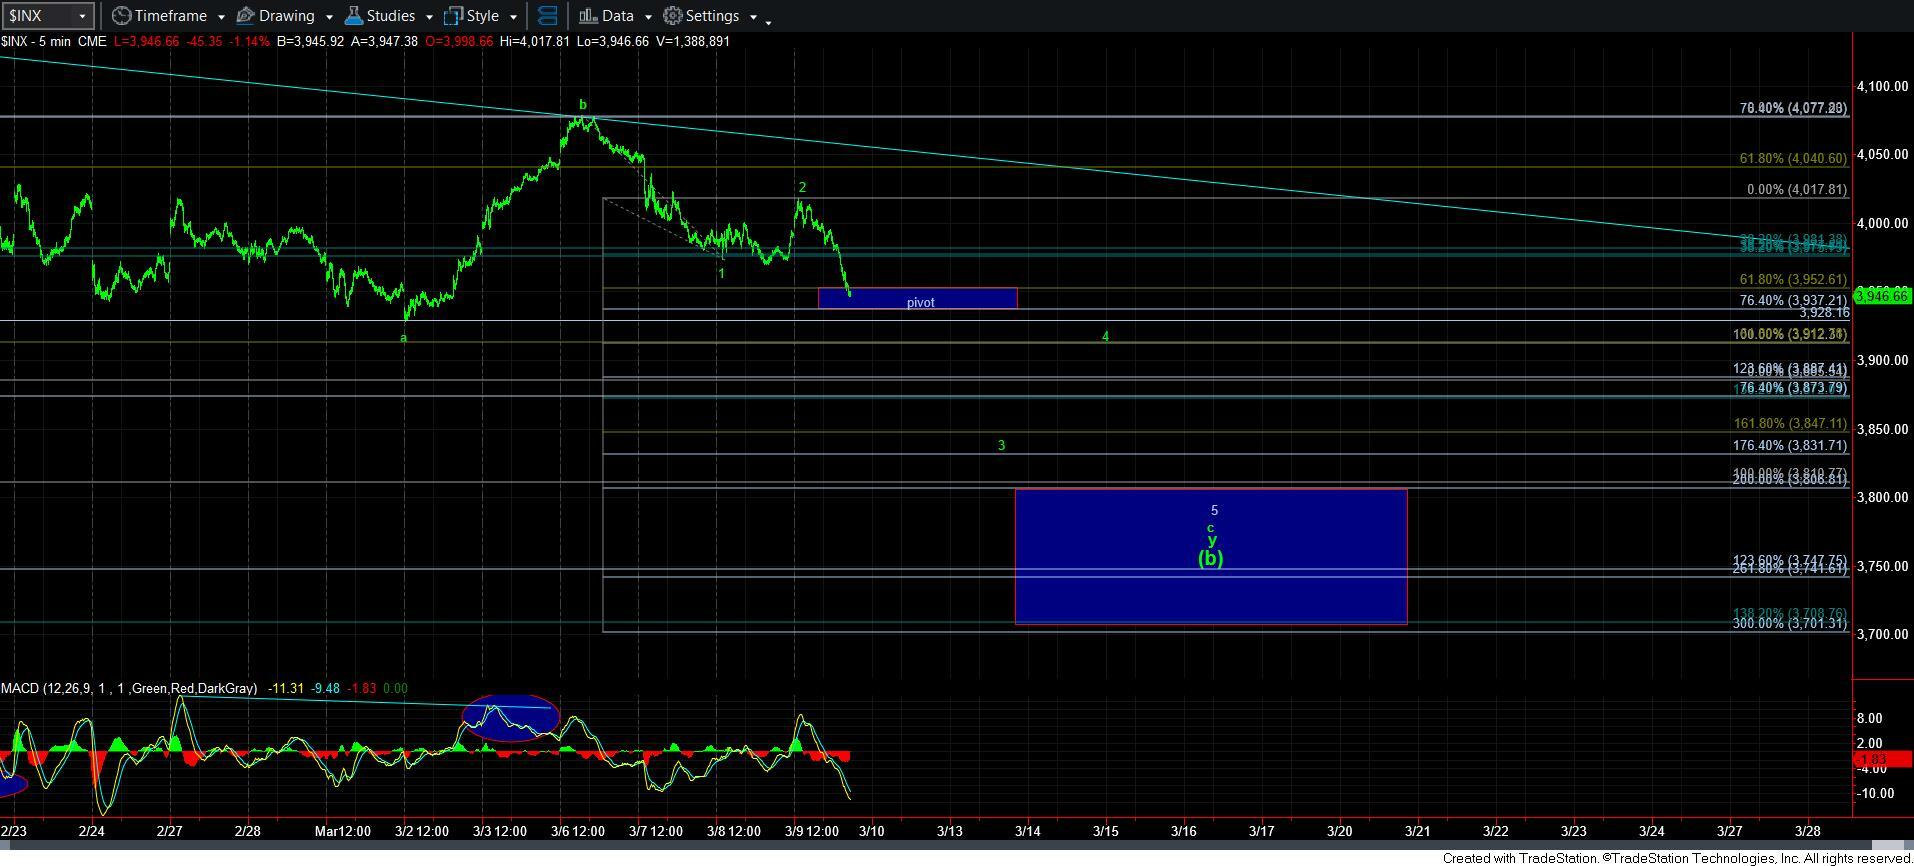
But, more importantly, should we break down below the .764 extension, the next target is the 1.00 extension, which in the ES is in the 3912/20ES region. Should we go directly to there, then the pivot is going to be our resistance for a wave iv bounce. And, as long as all bounces from that point do not break back over the pivot, pressure will remain to the downside with a minimum target in the 3810SPX region. In fact, that is where we have a 2.00 extension of waves 1-2 (common target for a 5-wave structure), which overlaps with an a=c within this y-wave.
Of course, we could see stronger extensions taking us deeper into the target, potentially down to the 3745SPX region, which also has confluence, and the bottom of our support box also has confluence in the 3700SPX region.
The main takeaway right now is that as long as we remain below today’s high – wave 2 – the bears are in control in the near term. It would take a break back over today’s high to invalidate this downside potential being presented on our chart. And, if we break down to the 3912/20ES region and come back up through the pivot, that would be a first signal that downside may not fulfill its full targets.
So, again, in very simple terms, as long as we remain below today’s high, the market is set up to target the 3810SPX region. But, we will watch how it handles the pivot in the coming day or two to make sure.
Lastly, before you mortgage the house on this set up, keep in mind that even the best set ups do fail 20-30% of the time. So, please do not abandon risk management procedures. This market has been very tough of late.