Downside Set Up Developing
As I have been writing for the last few weeks, the IWM has been providing us with what could be a textbook downside set up. And, today, it took another step within that set up. So, let’s discuss what it would take to perfect that set up.
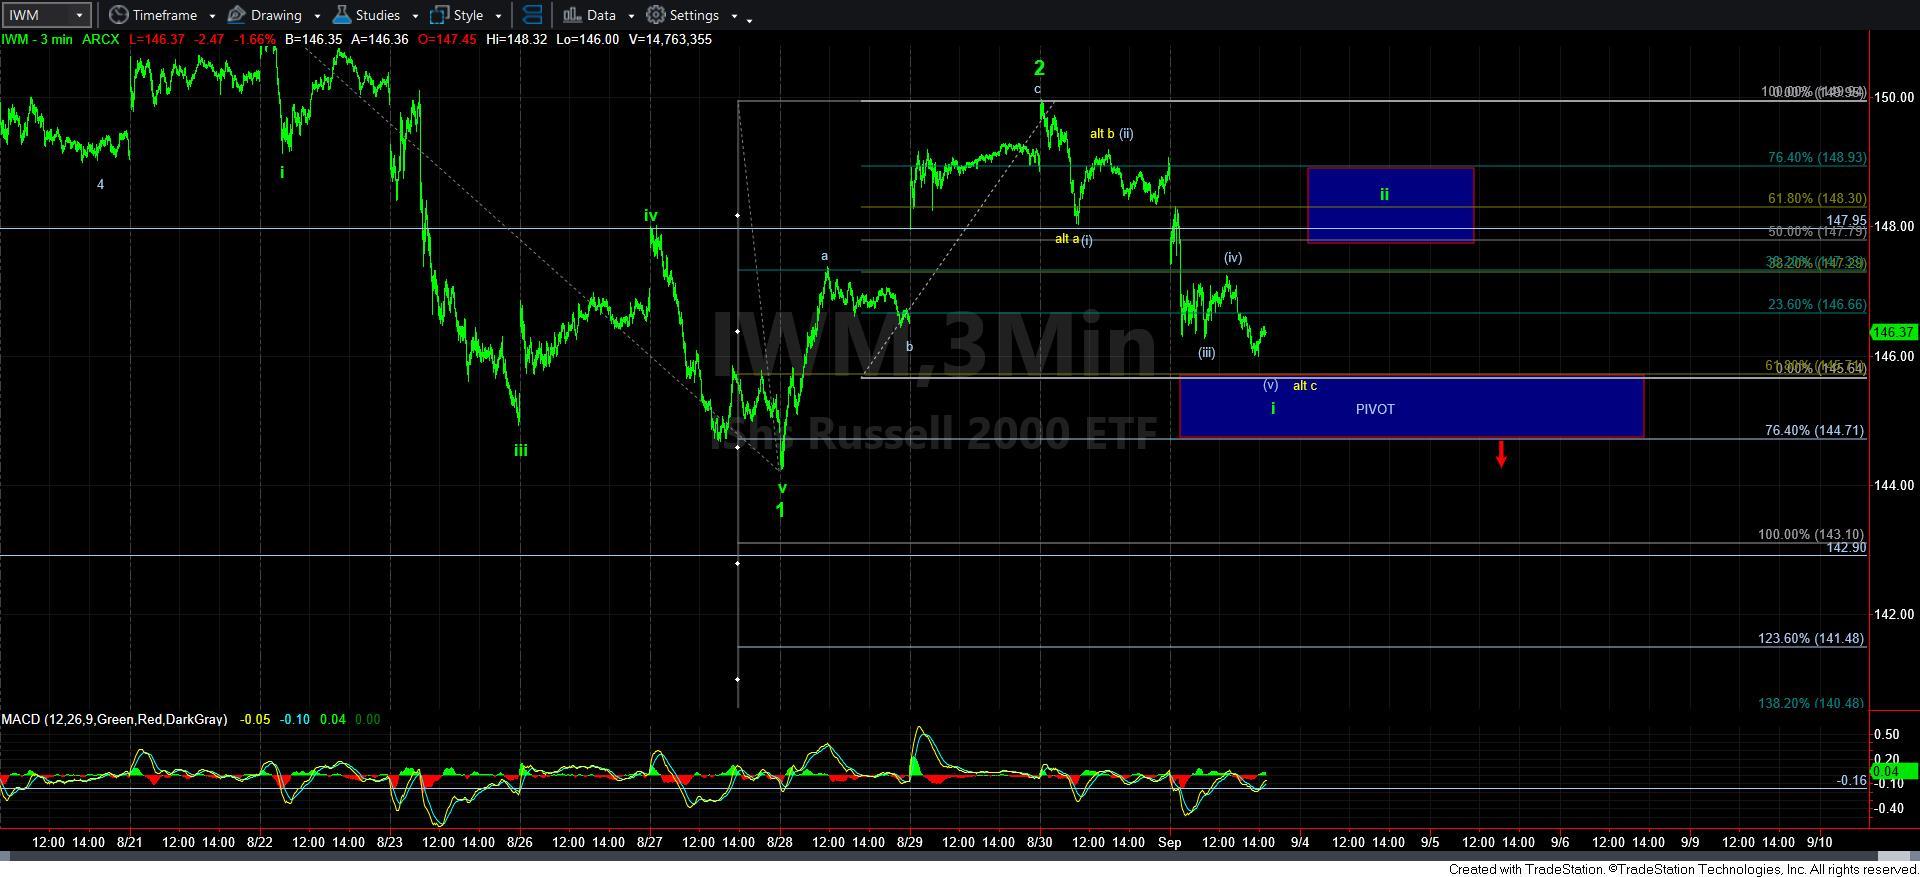
Thus far, I have been outlining that the initial decline off the late July high was a 3-wave decline, which was followed by a [b] wave flat. That means, we have been looking for an impulsive downside set up for the [c] wave decline. Last week, the market bottomed at what counts best as a 5-wave decline, which I counted as wave 1 down in the [c] wave. The bounce we experienced off that low counts best as a 3-wave corrective rally, which slightly exceeded our target for a wave 2 retracement.
Since the high of last week, we have what can also count as another 5-wave decline. While this last 5-wave decline off last week’s high is clearly not perfect, it does count rather well from an internal Fibonacci Pinball structure, and this decline also took us right towards the .618 extension of waves 1 and 2, which is the ideal target for wave i of 3.
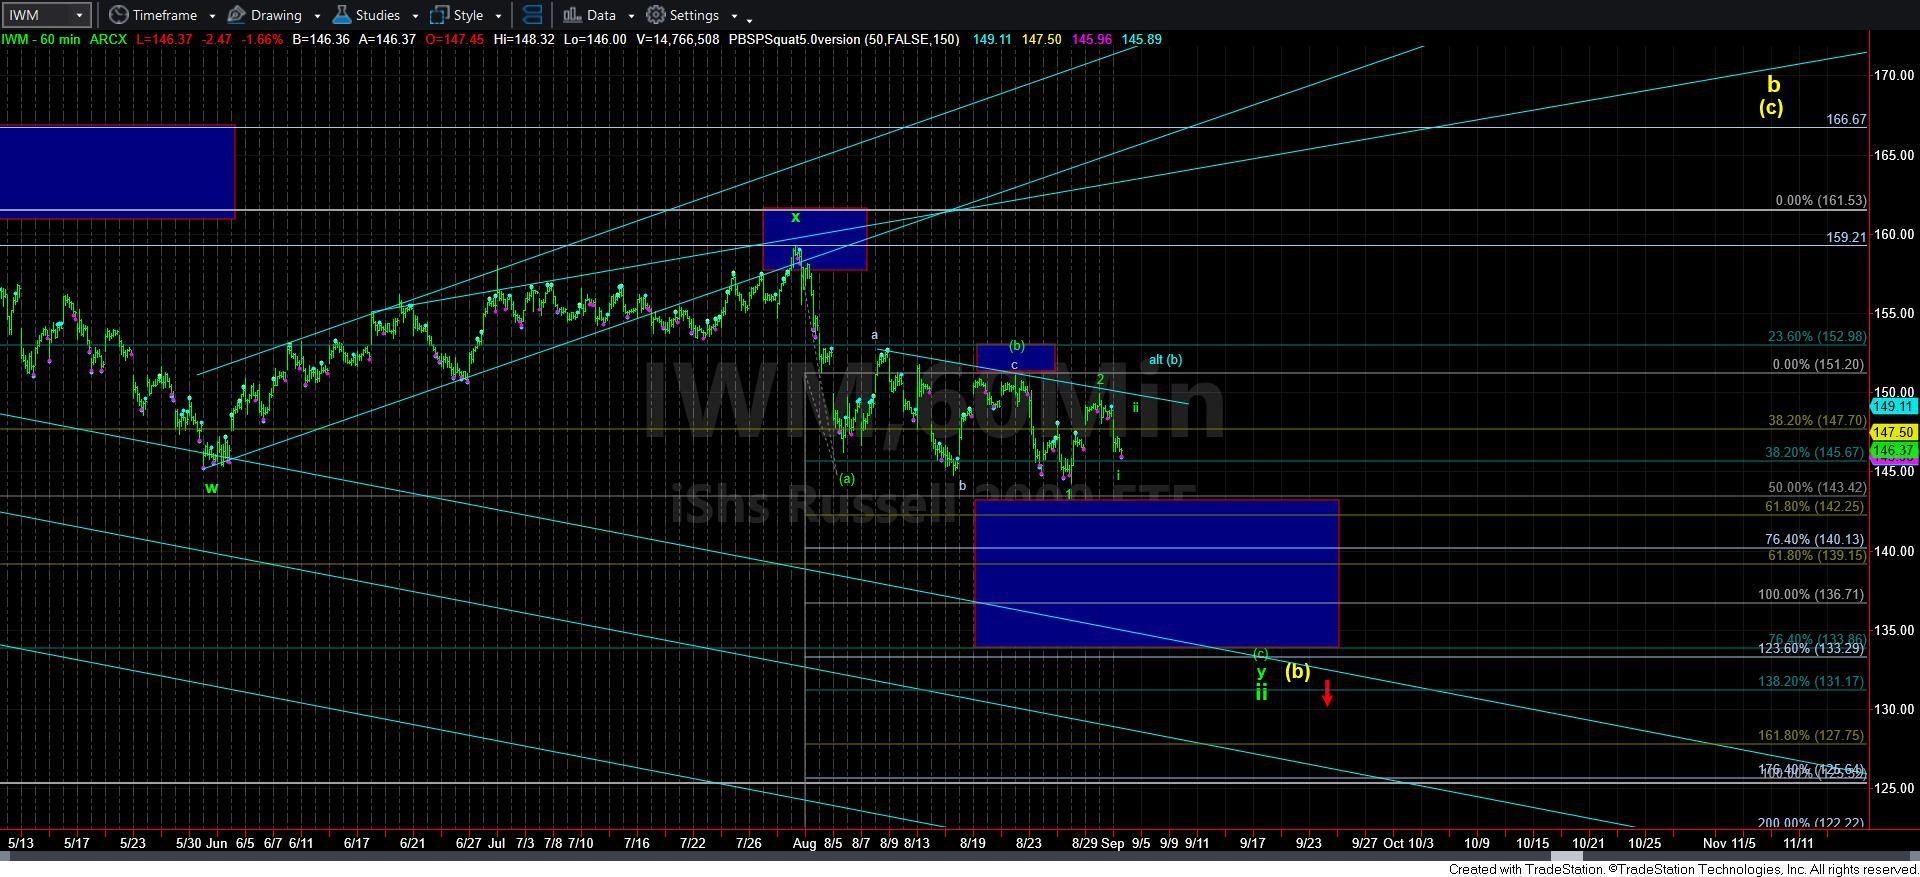
Therefore, in order to perfect this set up, we will need to see a corrective rally for wave ii of 3, followed by a break down below the low of wave i. Moreover, as you can see from the attached 3-minute IWM chart, I have added a pivot box again. In order to be much more likely that we are in the 3rd wave down, the market will have to break down strongly below this pivot, and then hold below it as resistance. Should we follow these steps, the minimum target expectation would be the 136 region, but I would prefer us extending down to the 133/34 region.
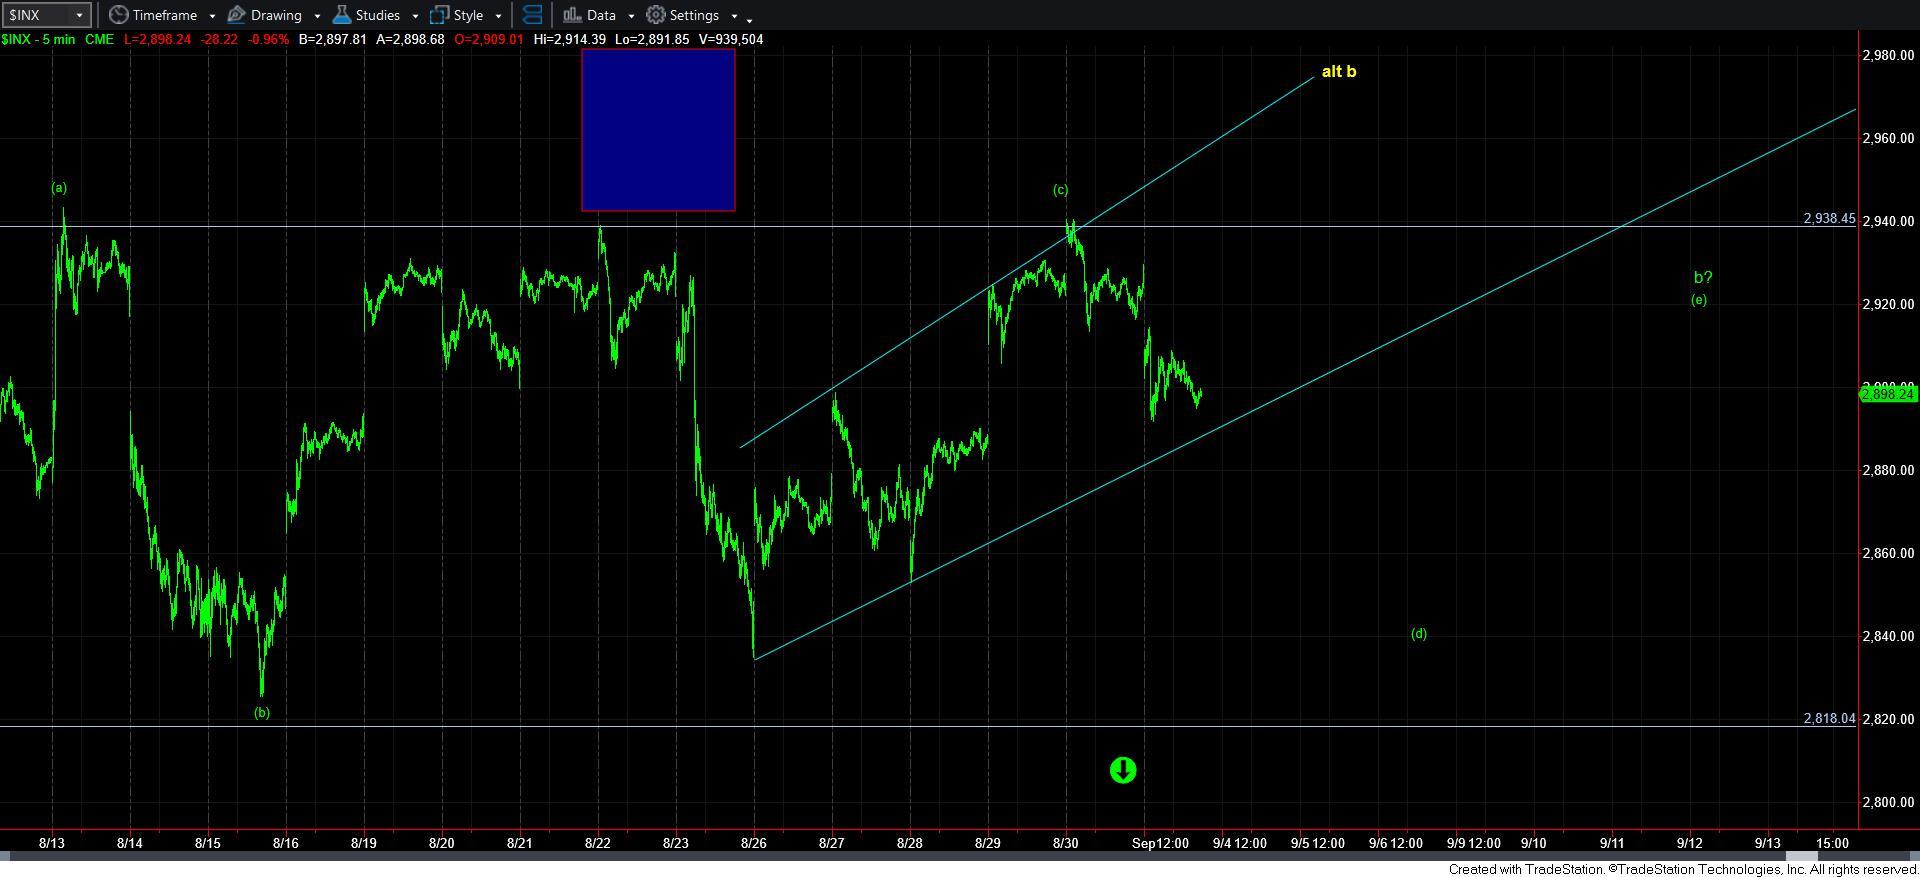
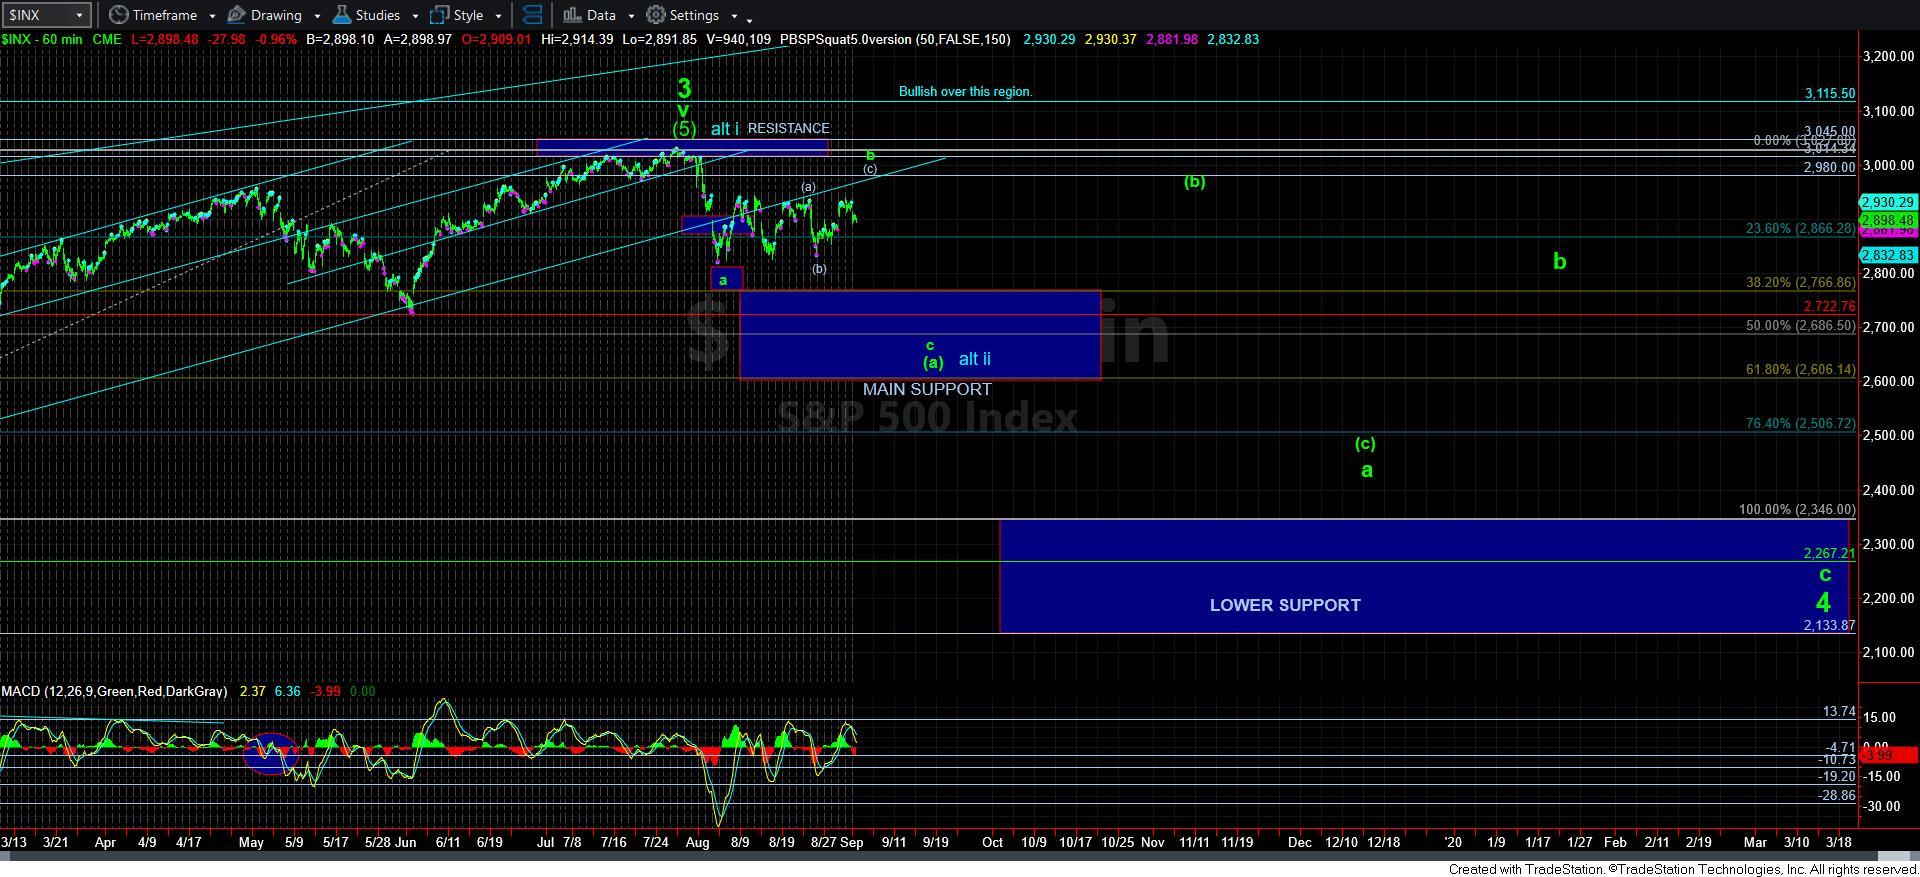
Yet, I do have to point out that the SPX does not have as clear a decline structure in place. So, clearly, this makes me a bit more cautious. Yet, if we are able to break down below last week’s low in the SPX it would go a long way in making me a believer of an impending decline pointing us below 2700SPX.
So, the market has given us very nice parameters within the IWM chart at this time. As long as we remain below last week’s wave 2 high, pressure will remain down in the IWM. A break out over last week’s high places this chart in a certain amount of short term limbo. But, for now, pressure remains down as long as we remain below last week’s wave 2 high.