Downside Follow Through - Market Analysis for Sep 2nd, 2025
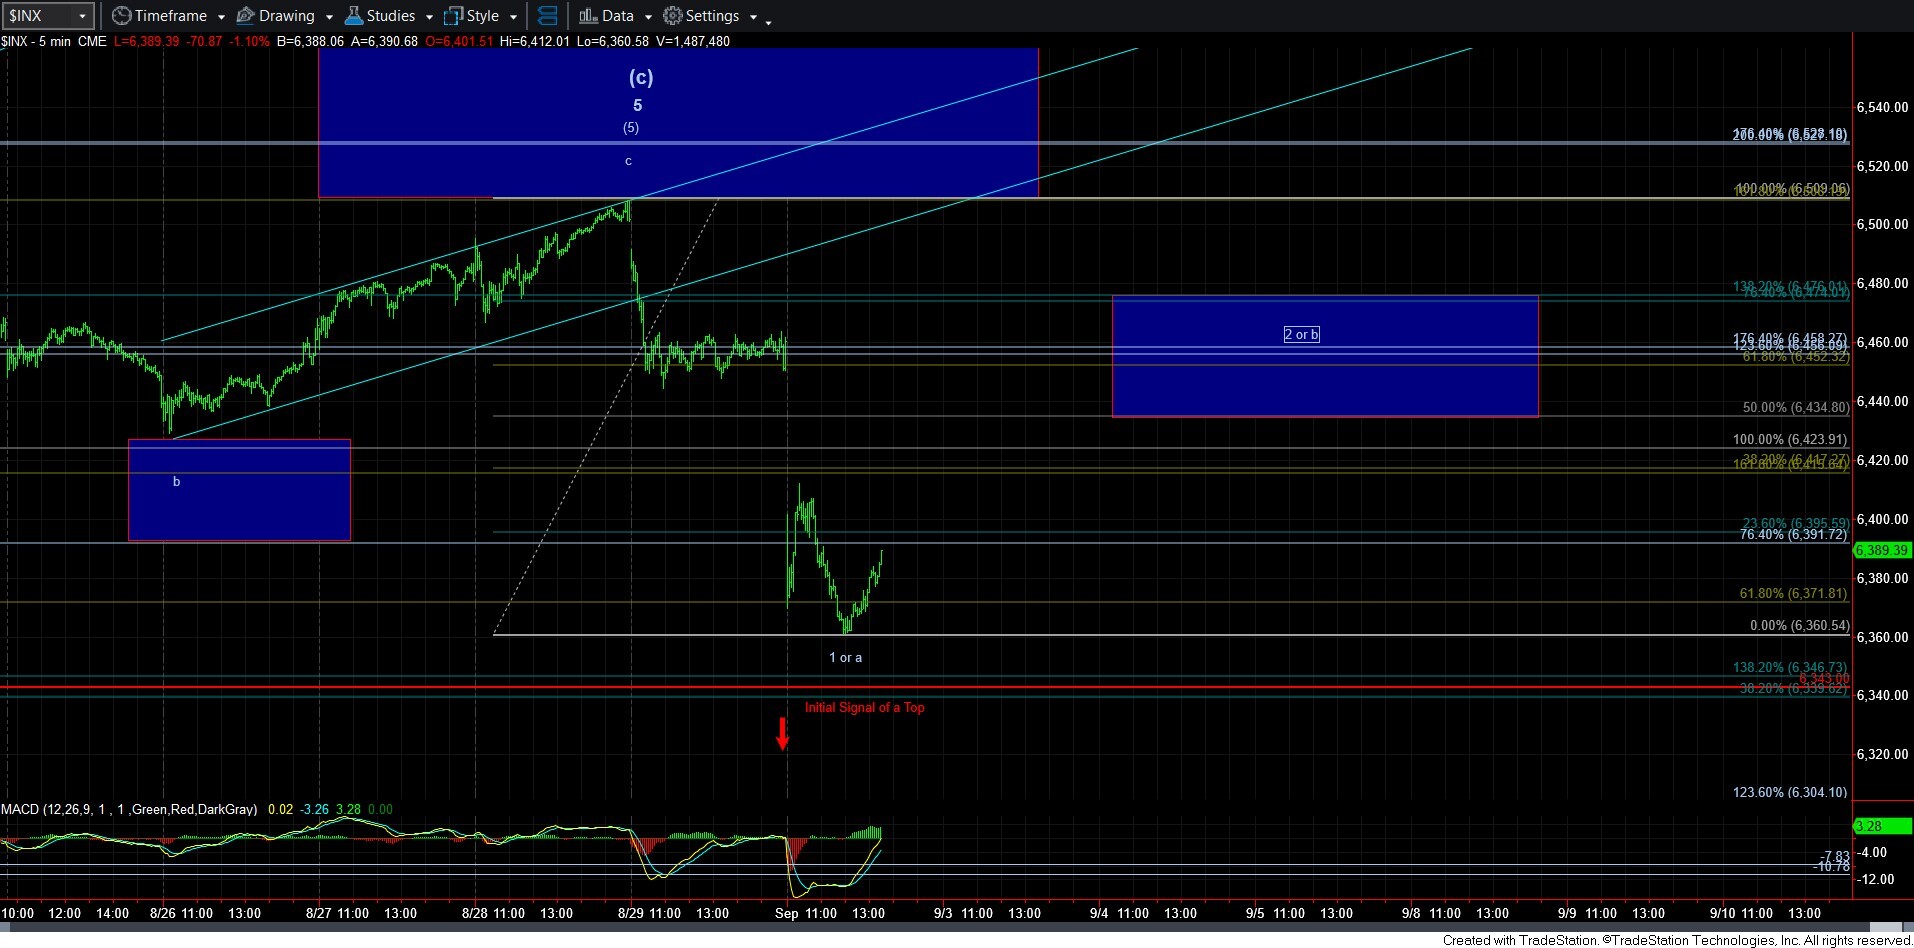
As outlined in the weekend update, the market was set up for further downside early this week. Moreover, I also noted in the weekend update that we did not have any structure in place that projected more than a test of the important support below us on the 5-minute SPX chart. And, that seems to be what we are getting today.
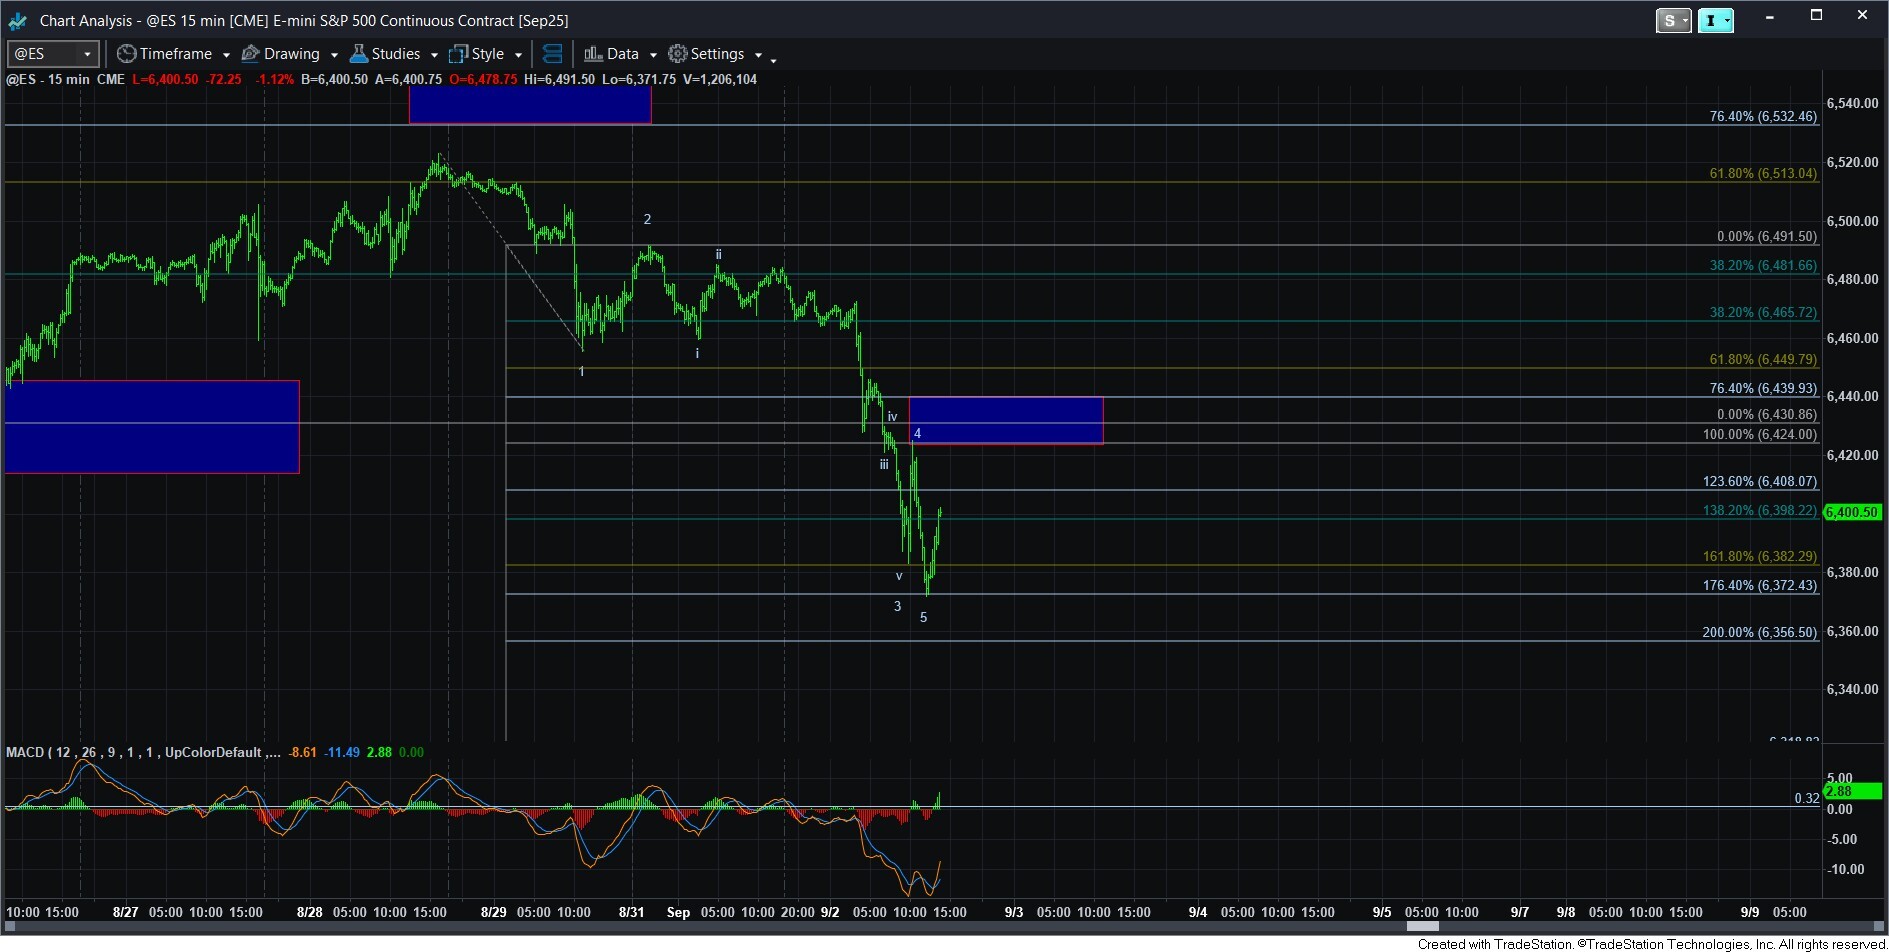
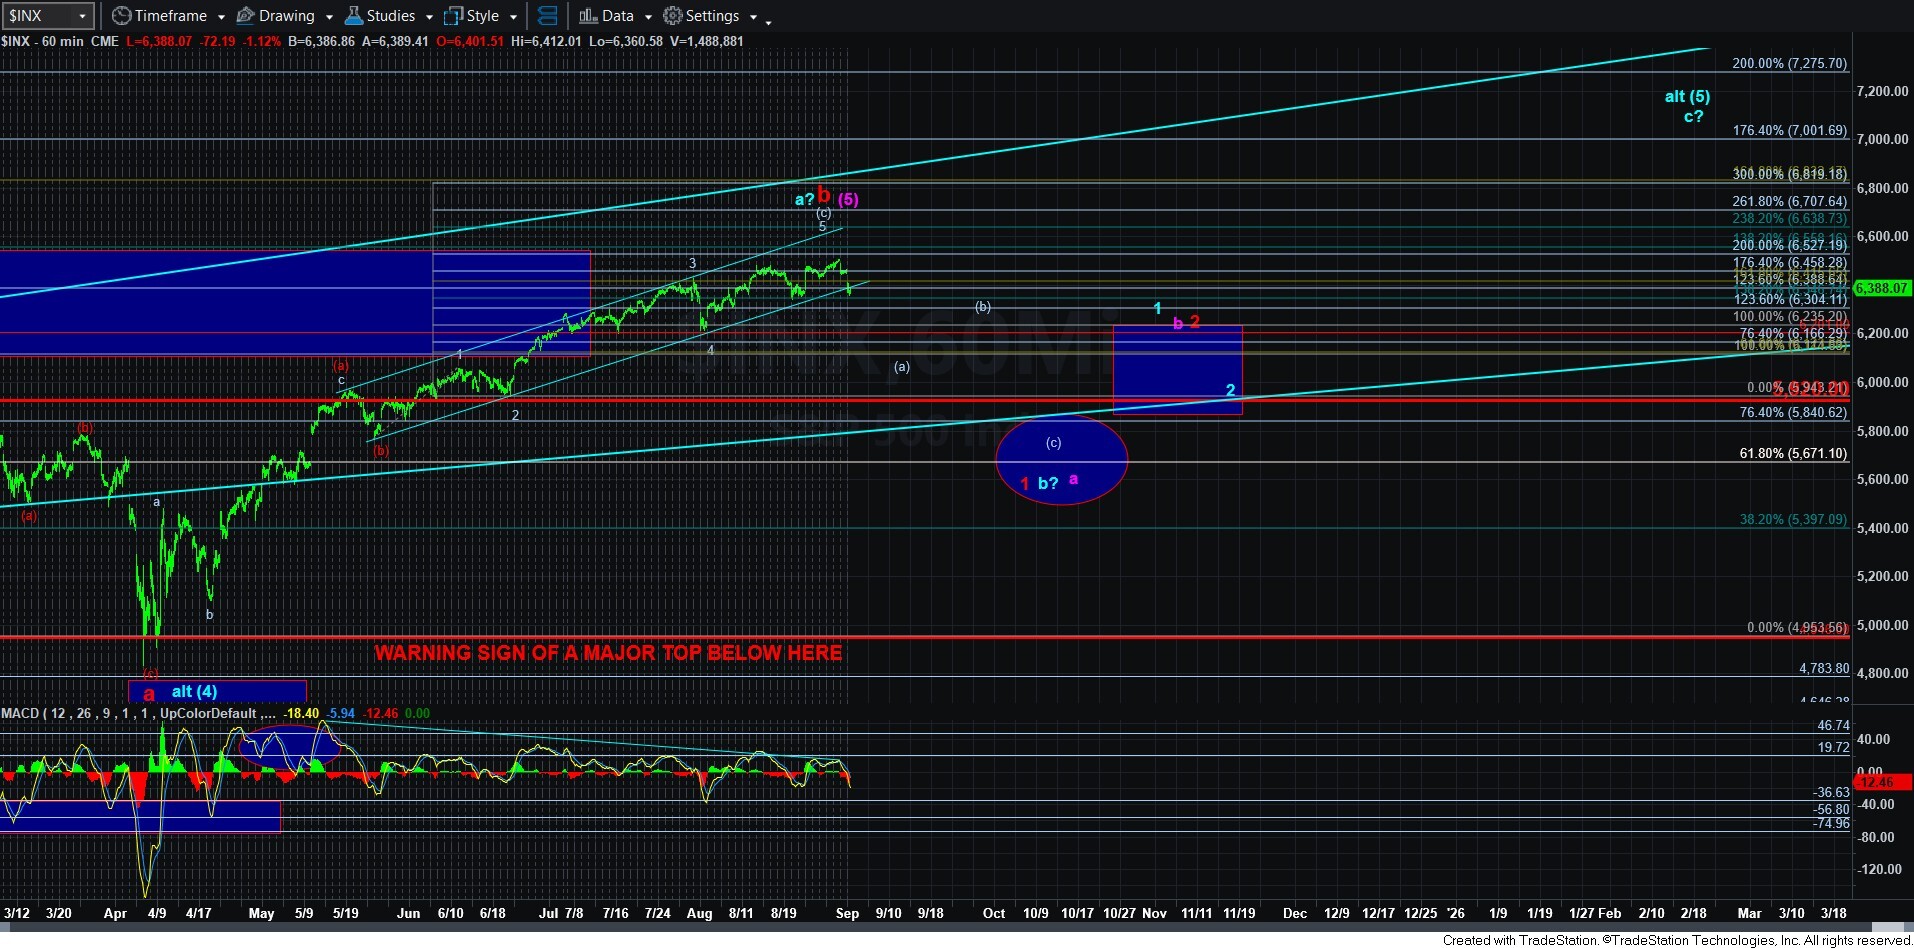
Furthermore, the decline today seems to complete a potential initial 5-wave structure off last week’s high – which is easier to see from the ES chart. So, I am able to maintain the red count on the chart – at least for now. However, it’s the next higher degree decline that breaks support which will provide us with the information we will need to reduce the paths we are following in the coming months.
But, with the potential that we have 5 waves down from the recent high, and even an a-wave can be a 5-wave structure in a minority of circumstances, I am going to view this decline as a larger wave 1 or a-wave down. Therefore, I think it is reasonable to expect a bounce taking shape in the coming days. I have added a general target/resistance for that bounce, which represents the .500-.764 retracement of this recent decline. We will need to move over 6412SPX to confirm that the bounce is in progress.
As long as this next rally is corrective in nature, I am going to assume that the resistance will hold and it will set us up for another decline which should break below our initial signal line in the 6343SPX region. That decline – should we get it in the coming week or so – will be instructive as to which count is most likely applicable in the coming months, as we will likely be able to take one of the paths we are tracking off the 60-mintue chart.