Downside Follow Through - Market Analysis for Jul 24th, 2024
So, how deep will this decline take us?
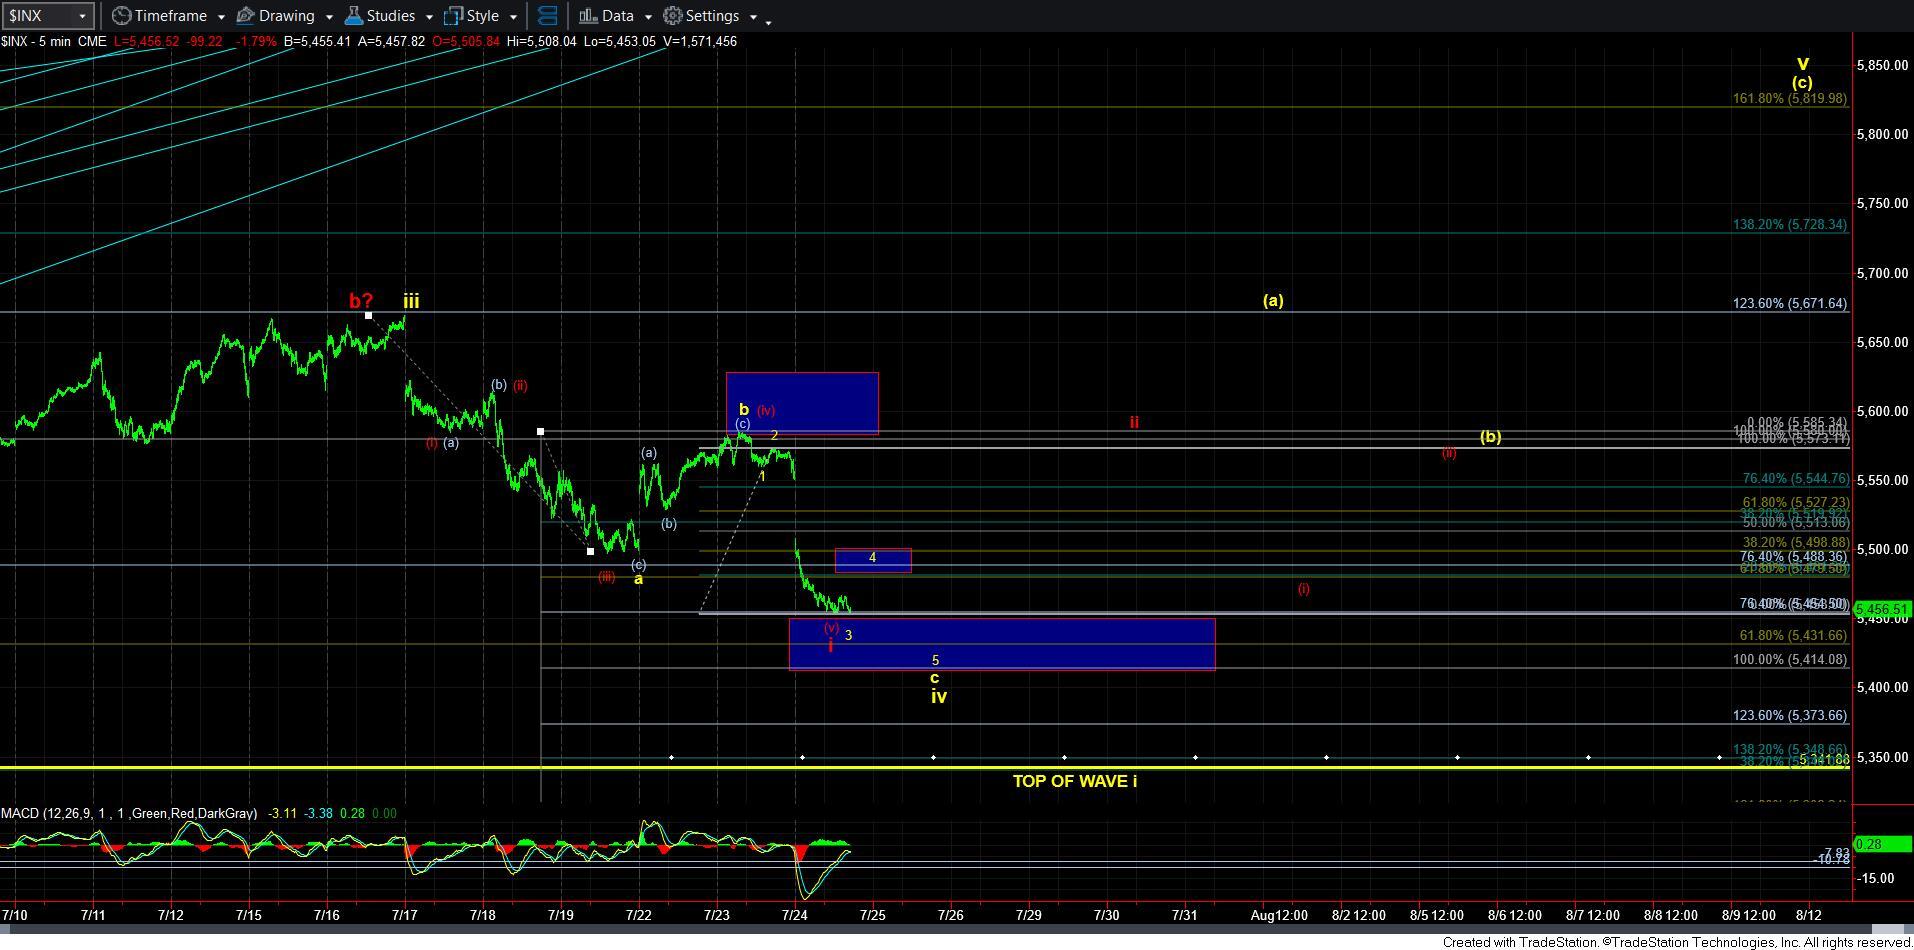
Well, the answer really depends on which pattern we are following. As I write this update, the market has dropped as far as I am willing to accept for this to even be considered as the red wave i. We have now reached the point wherein the 5th wave of wave i is equal to .764 the size of waves [i][ii]. And, that is really the maximum I am usually willing to accept for that 5th wave ratio. Moreover, the 5444SPX region is the 2.00 extension of waves [i][ii], and again, a break down below that would make the red count even less likely.
So, the question then turns on how deep can this decline take us in the yellow count?
Well, to be honest, we commonly see waves iv and i overlap in a diagonal. And, since wave i topped in the 5341SPX, technically, we can drop all the way down there and still be in wave iv in the diagonal.
So, we will have to track wave 3 of the c-wave carefully. And, depending on how much further it chooses to extend will likely tell us just how deep this wave iv can take us. But, I want to note that the 5414SPX region is where a=c resides, and I would have to see a break down below that support to consider the overlap scenario.
For now, I have added a resistance box for a wave 4 bounce. And, the upper end is based upon the .382 retracement of wave 3. Right now, that is around the 5500SPX region. And, clearly, should wave 3 continue to extend, that will be adjusted lower.
Now, since a c-wave is traditionally 5 waves, if the market were to hold the 5444SPX region, and then rally through the resistance box for wave 4, leaving only 3 waves down, it would make the red count a bit more likely. You see, since each sub-wave in a diagonal is usually 3 waves, a 3-wave decline for the 5th wave would make it more likely that we completed an a-b-c structure for wave [v] of i.
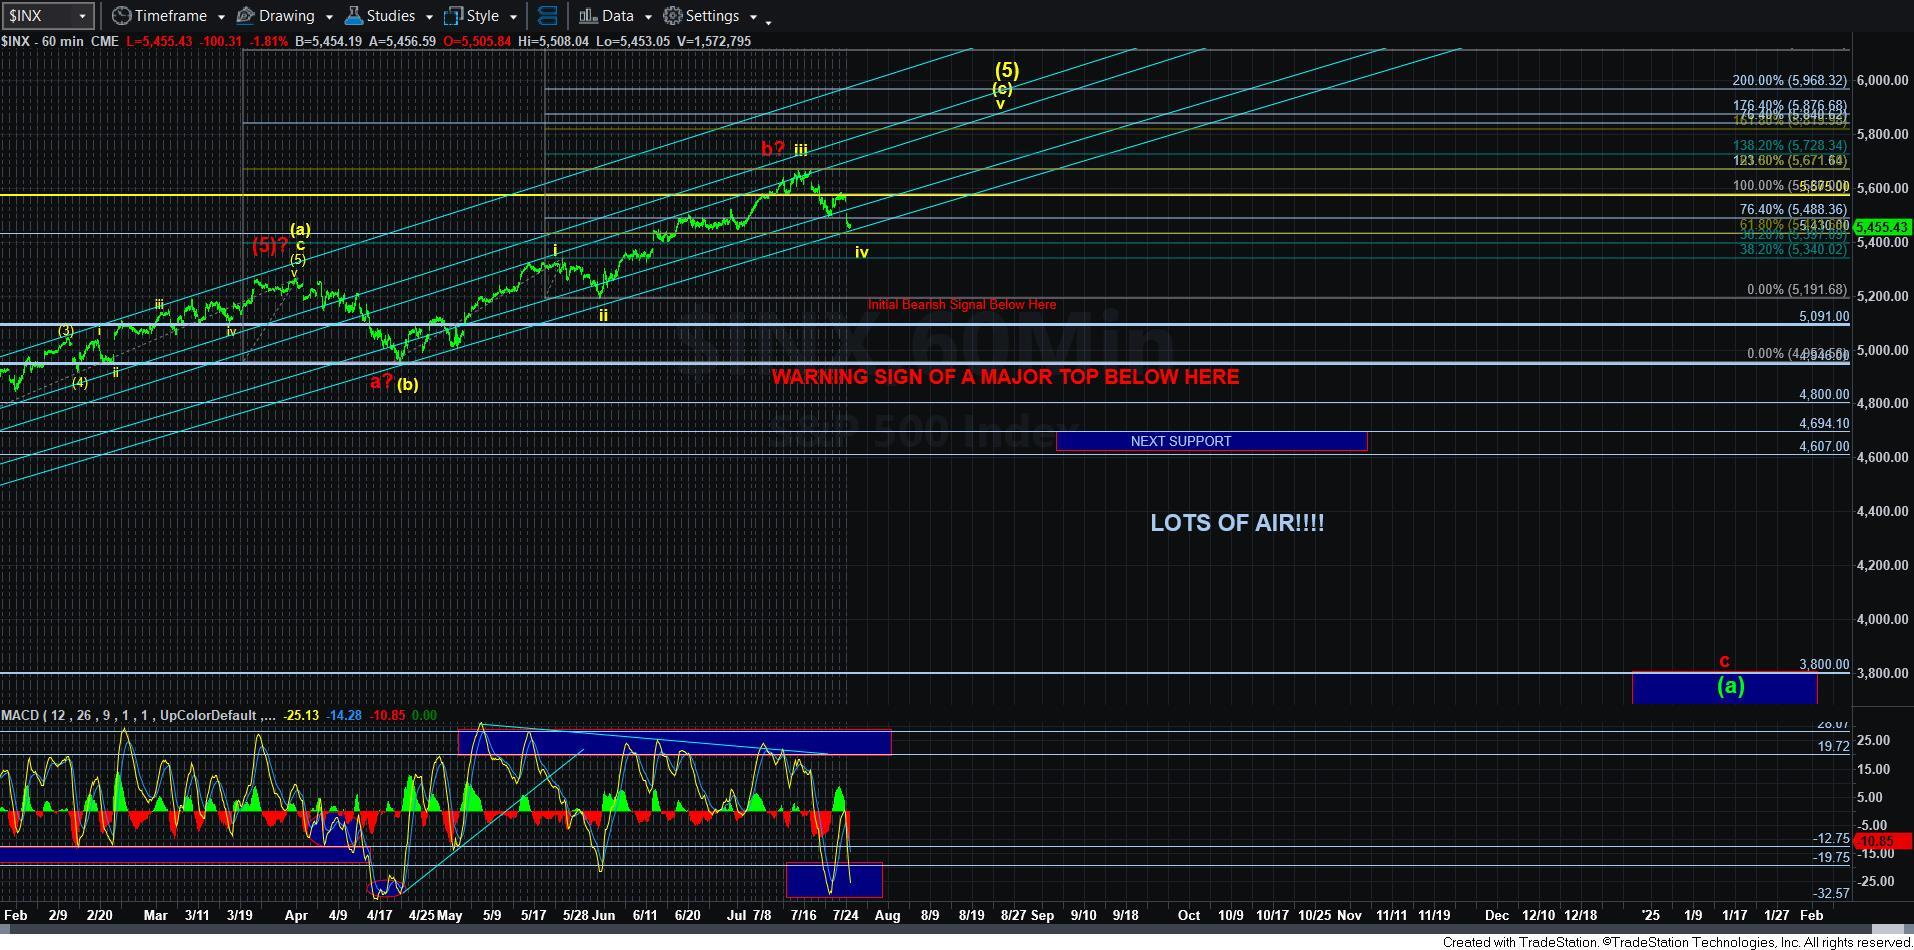
So, the market is going to give us a lot of information over the coming days as to whether we have topped, where we bottom, and if we have a strong potential to still rally north of 5800SPX to complete this diagonal presented in yellow. For now, I am keeping the diagonal in yellow as my primary expectation until the market proves otherwise. And, to prove otherwise, we would have to bottom over 5444SPX, rally through the resistance box for wave ii in red, and then see a standard 5-wave decline for wave [i] of wave iii, followed by a corrective bounce in wave [ii]. So, until that is seen, I am keeping my focus on one more rally higher.