Downside Follow Through - Market Analysis for Dec 22nd, 2022
Today we saw the downside follow through for our 5th wave of the c-wave. And, many things are starting to fall into place to provide us with the ideal set up I have been outlining.
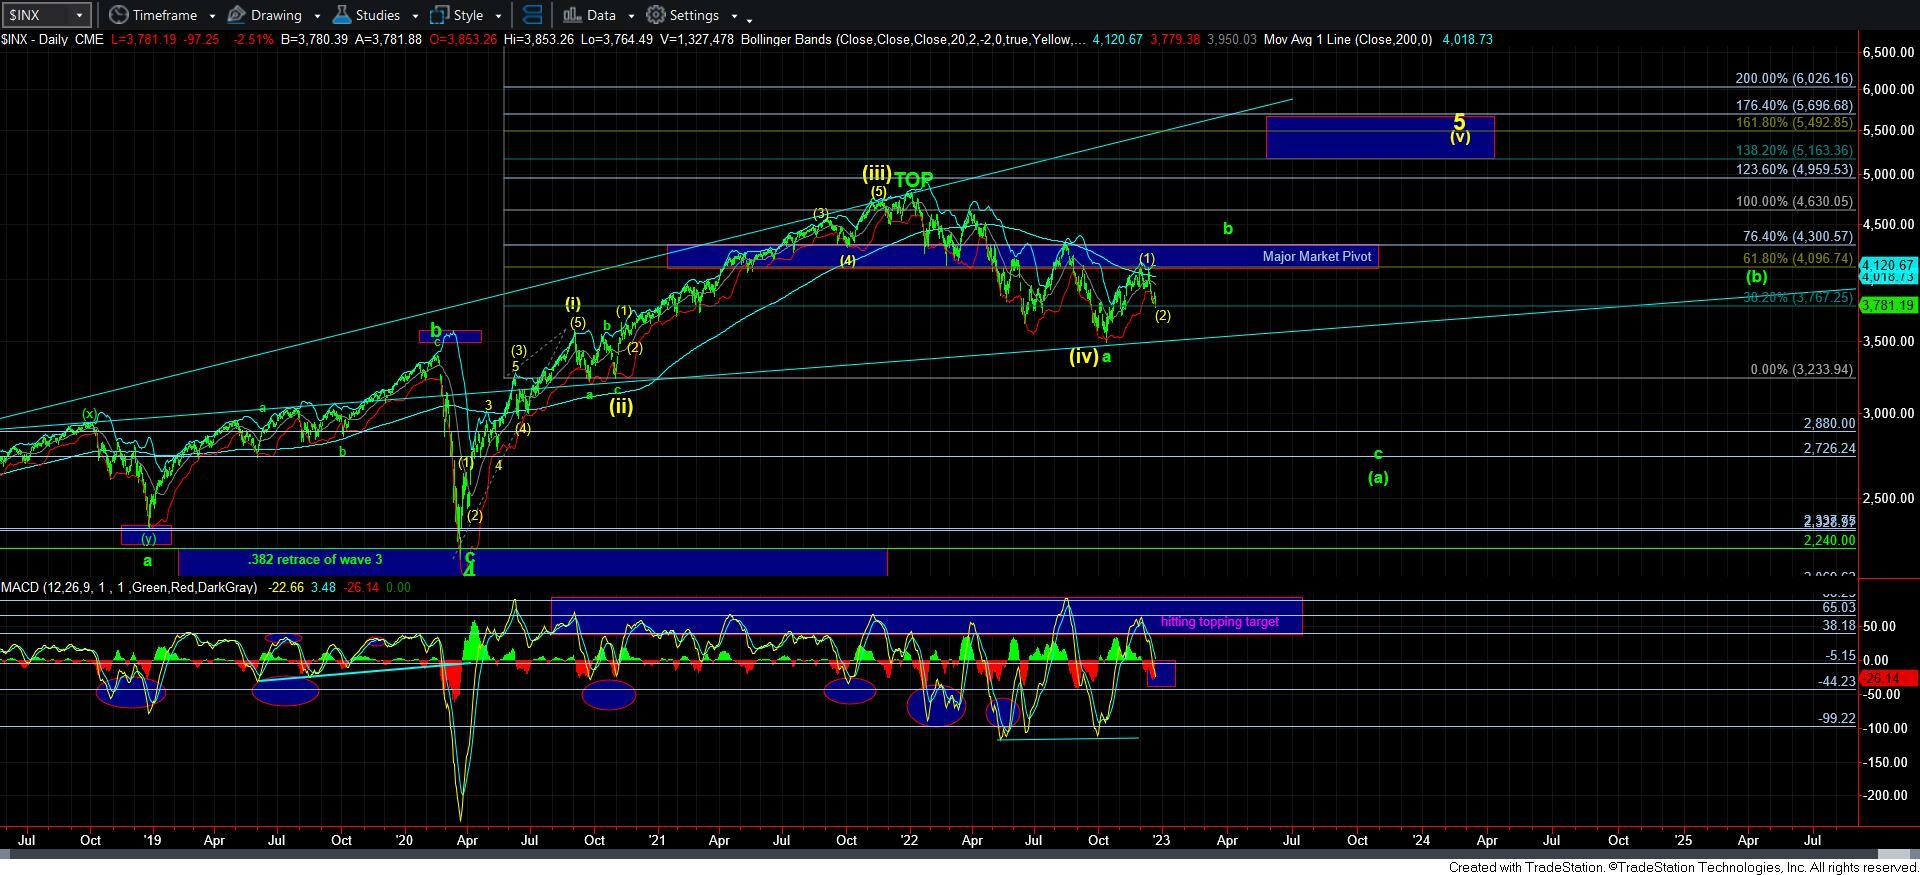
First, the daily MACD has now dropped into the bottom of our target box. While many of you are questioning my view on this and thinking we have not dropped down to levels seen at other lows, I want you to realize not all “lows” are the same. In this instance, we are seeking a low for a [b] wave pullback, and the region at which I placed the box is the typical pullback region for [b] waves and 2nd waves. That is why this has been my target for the daily MACD this entire time.
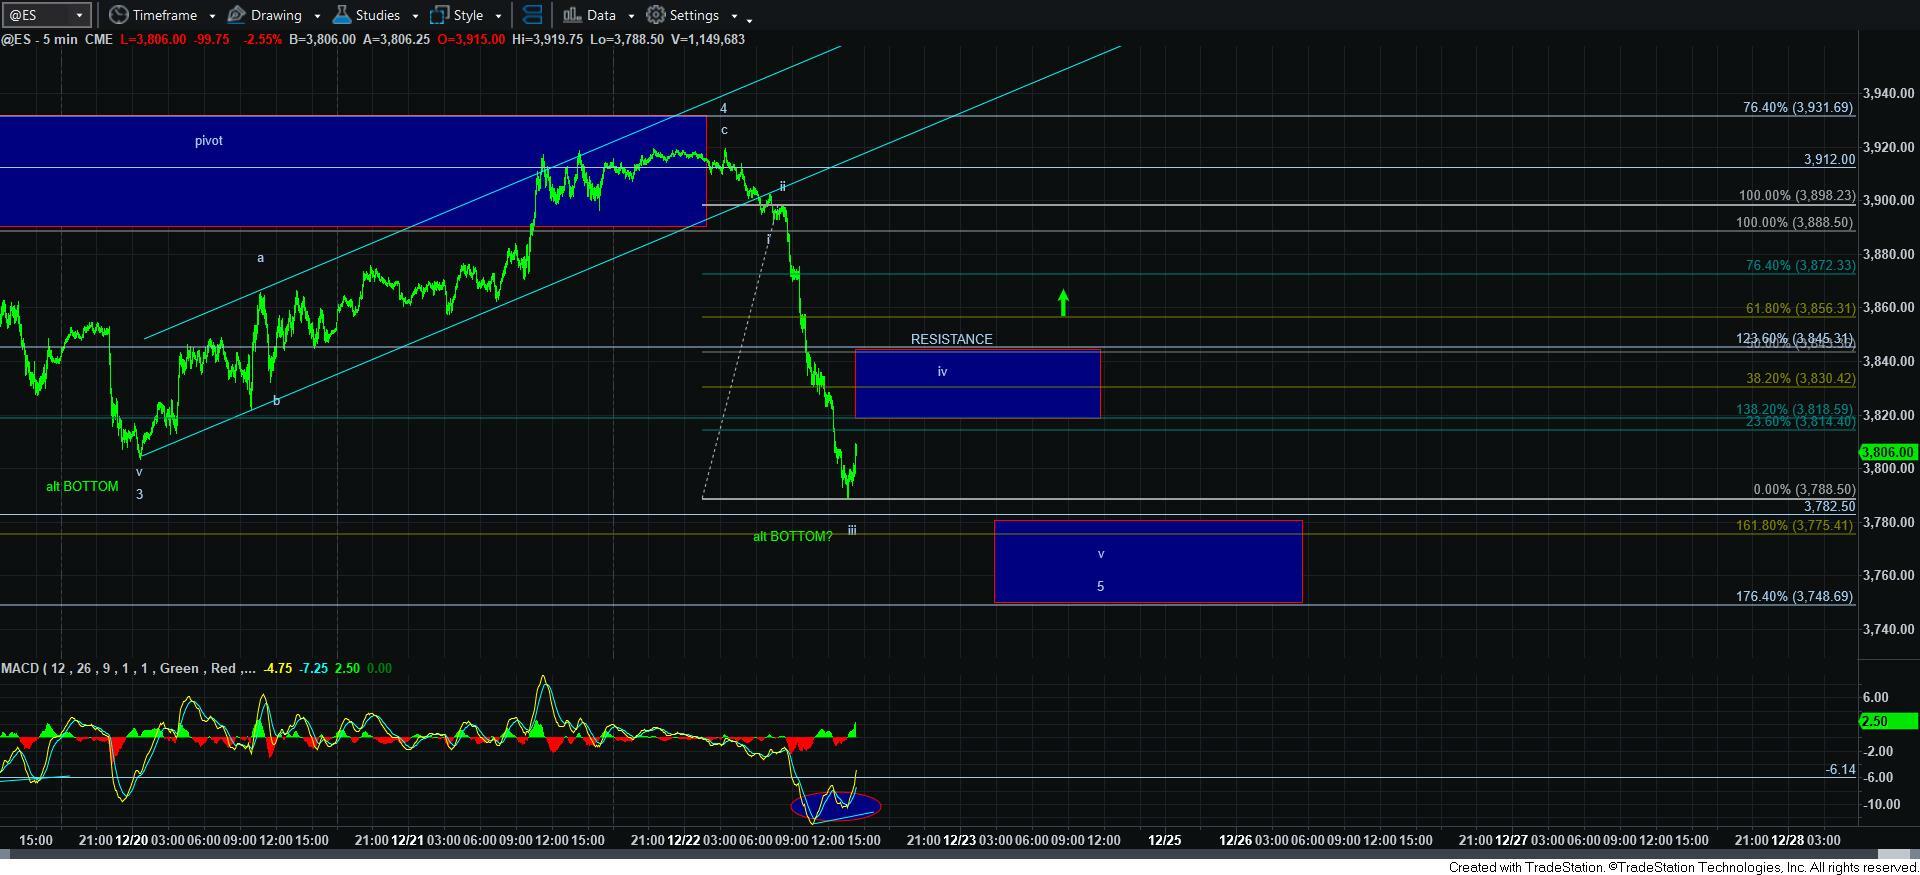
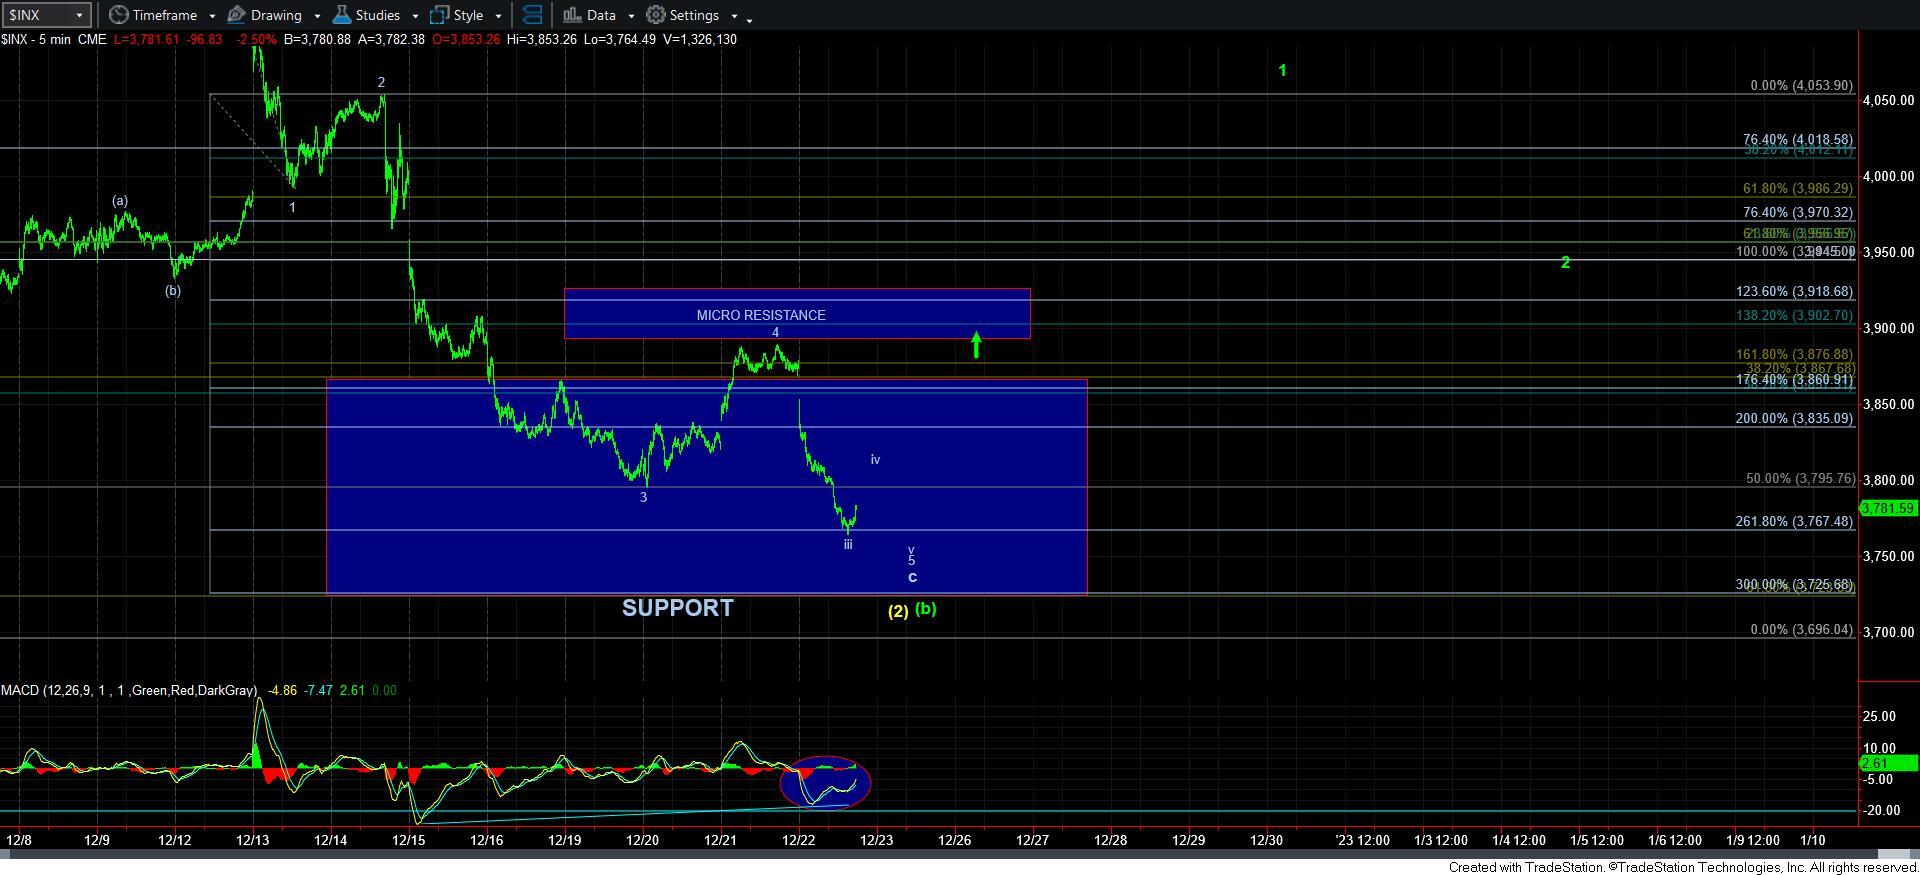
Second, we now have a full 5-wave count to the downside in the c-wave of the [b] wave. While there are still potential “squiggles” left to complete wave 5 of the c-wave (which I will outline next), the market topped yesterday in a 4th wave bounce exactly where it had to (within the region of the .382 retracement of the wave 3 and within our pivot region), and we have now dropped down to the next blue box target we had on the 5-minute ES chart which was our wave 5 target.
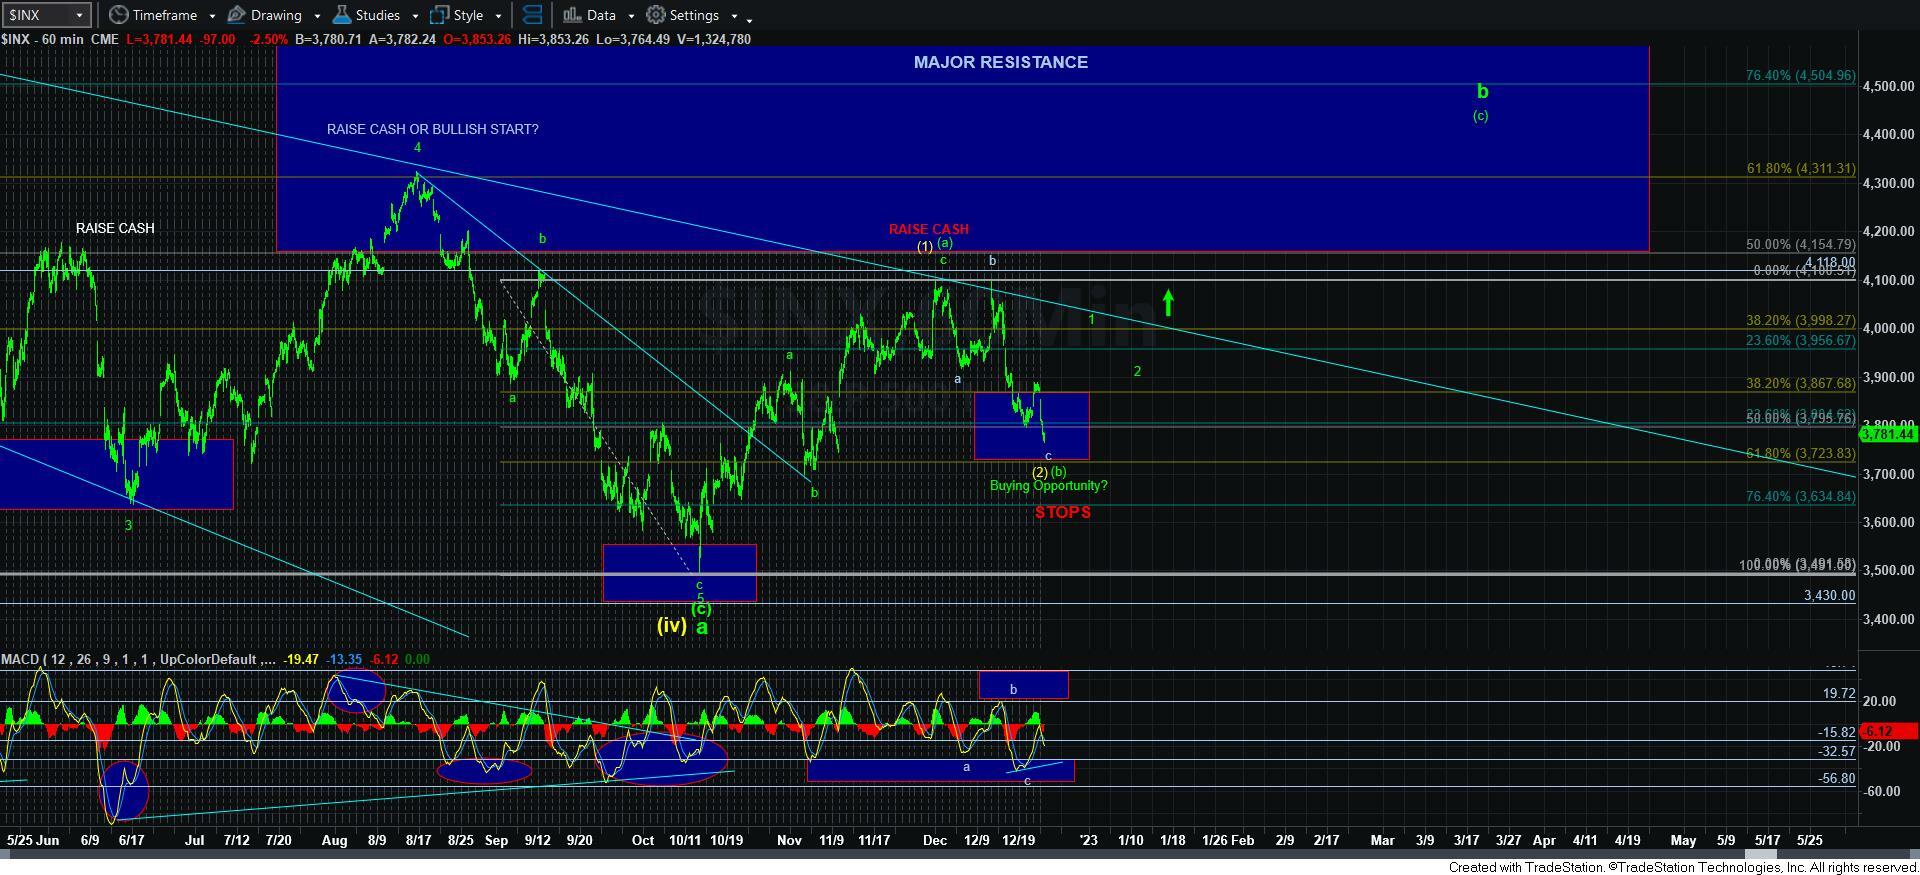
Moreover, we now have developed some very nice positive divergence on the 60-minute MACD as well, which also supports the overall count and expectations I have been outlining of late.
As far as the micro-count for wave 5, I am counting today’s decline as a very extended wave iii within wave v. I have added a resistance box to the 5-minute ES chart, which is based upon us having struck the bottom to wave iii already. We need to break back over 3806ES strongly to suggest that the wave iv bounce has begun. And, of course, if wave iii continues to extend, then I will have to adjust the resistance box a bit lower.
As far as our target box for wave 5, not only has it been on the chart the entire week, it also has support from other calculations. First, the common ratio of waves 1=5 point to the top part of our wave 5 box target below (assuming we use the futures wave 1, as it was much larger than the one in the SPX). Furthermore, the 5=.618 of waves 1-3 points towards the bottom of the wave 5 target box on our chart. So, as long as this box holds as our micro support, and we begin a strong rally off it, then I am very much in the bottoming camp for this (b) wave pullback.
Furthermore, since we are now a stones-throw away from our wave 5 target box as I write this update, there is some potential for all of wave 5 to have completed. But, that is not my primary count, as I am still looking for the iv-v to complete this structure. However, should the market rally strongly through our resistance box, then I will be moving into the “bottom-is-in” camp and looking for a 5-wave rally for wave 1 of the [c] wave of b, with a minimum target of 4300SPX.
Overall, the market has been tracking as per expectations since we bottomed over two months ago. The current set up is quite clean for a bottoming structure in a [b] wave, in my humble opinion. But, remember, that does not mean you must go long. You must be true to your own risk profile. Yet, if you do go long down here, you MUST ADHERE TO RISK MANAGEMENT RULES, such as using stops. We are less than 5% now from the region at which I noted stops on the 60-minute chart. And, should we rally through the resistance box, I will likely move that up.
In the meantime, for those that are more risk averse, you can always wait until the market completes wave 1 off the lows, and you can then buy on a corrective wave 2 pullback. And, for those that are even more risk averse, you can always wait until we rally back over the wave 1 high after wave 2 is done to buy into the market. Or, you can choose to layer in at all of these points.
Lastly, there are quite a number of you that would not even want to try a long trade anymore, and you can simply focus on raising more cash should we get up to the 4300+ region and complete this next rally. By then, we will have a much better idea as to the potential for the market to reach new all-time highs, and you can make decisions then about raising more cash. But, remember, you must be true to your own risk profile.