Down, But Not Out . . YET
 By
Avi Gilburt
This has been quite the bull market. We have seen VERY shallow retracement over these last several years and the bulls have pushed these markets to extremes which I was not able to foresee back in 2020 when we began looking much higher at the Covid lows. At the time, my maximum expectation was around the 6000SPX region from the 2200SPX lows.
Needless to say, all good things must come to an end. But, does that mean we are at that end now?
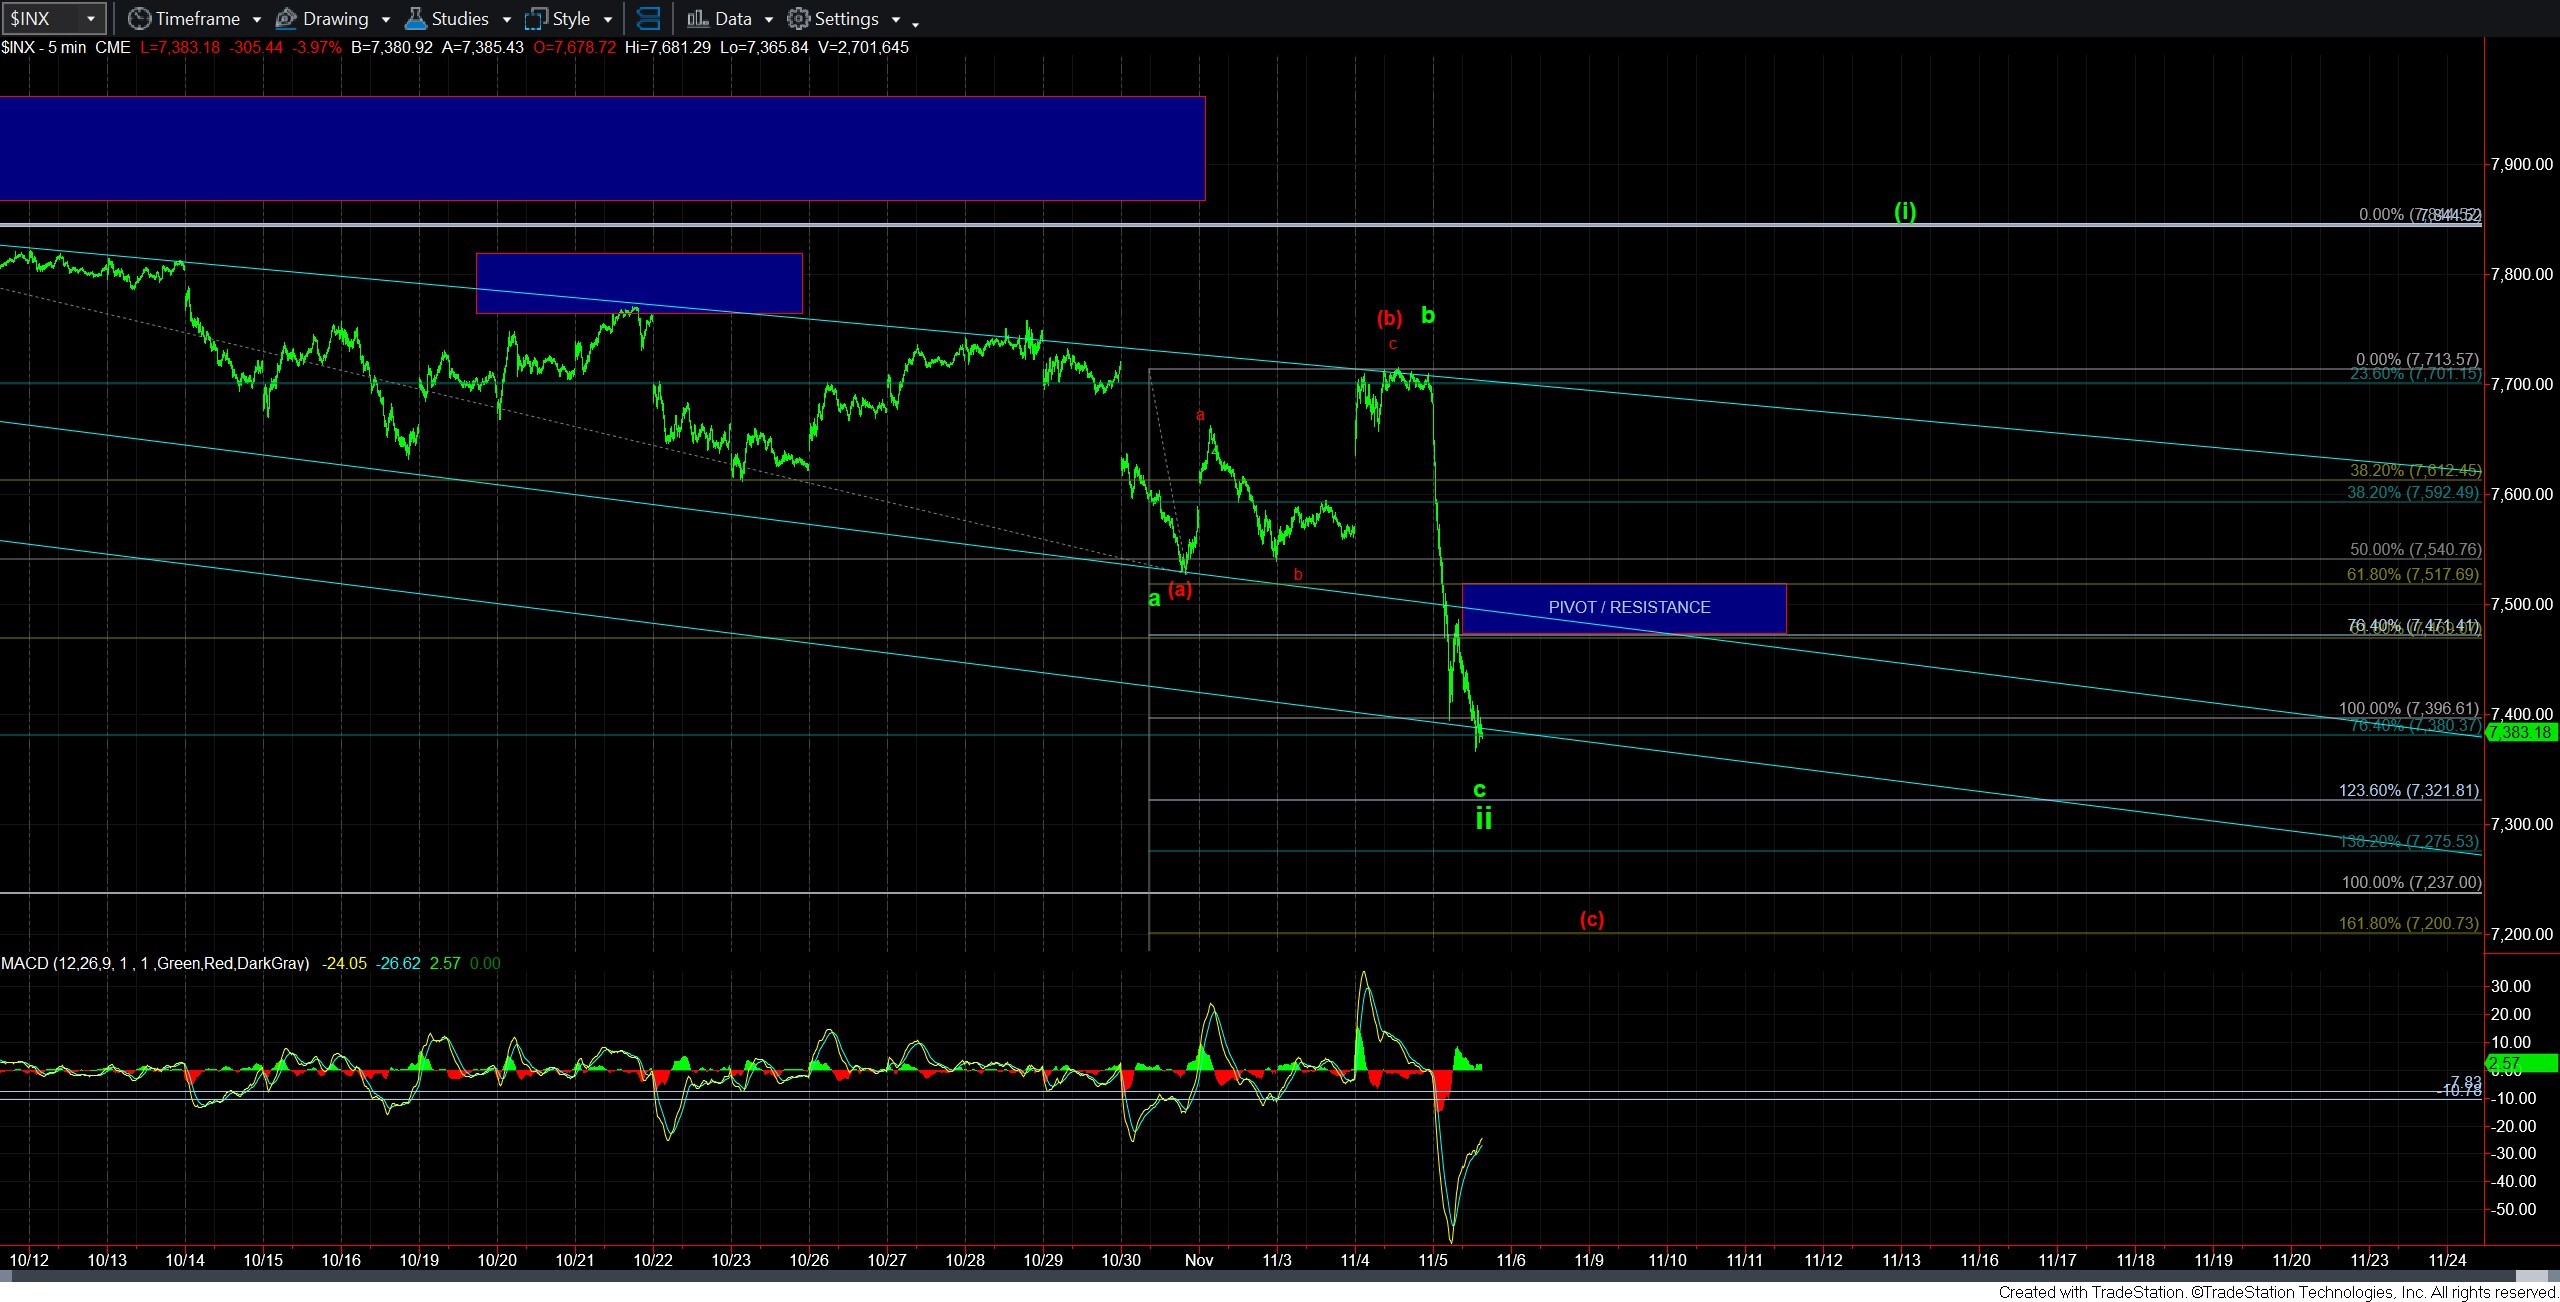
While I was expecting some downside into today, as outlined in the update yesterday, I did not expect that this upside set up was going to break today. And, with the break-down today below the a=c off the highs at the 7396 region, the bulls have placed themselves into a hole.
I have added a Pivot/Resistance box, which is between 7470-7518SPX. And, as long as all bounces remain corrective below there, pressure will remain down.
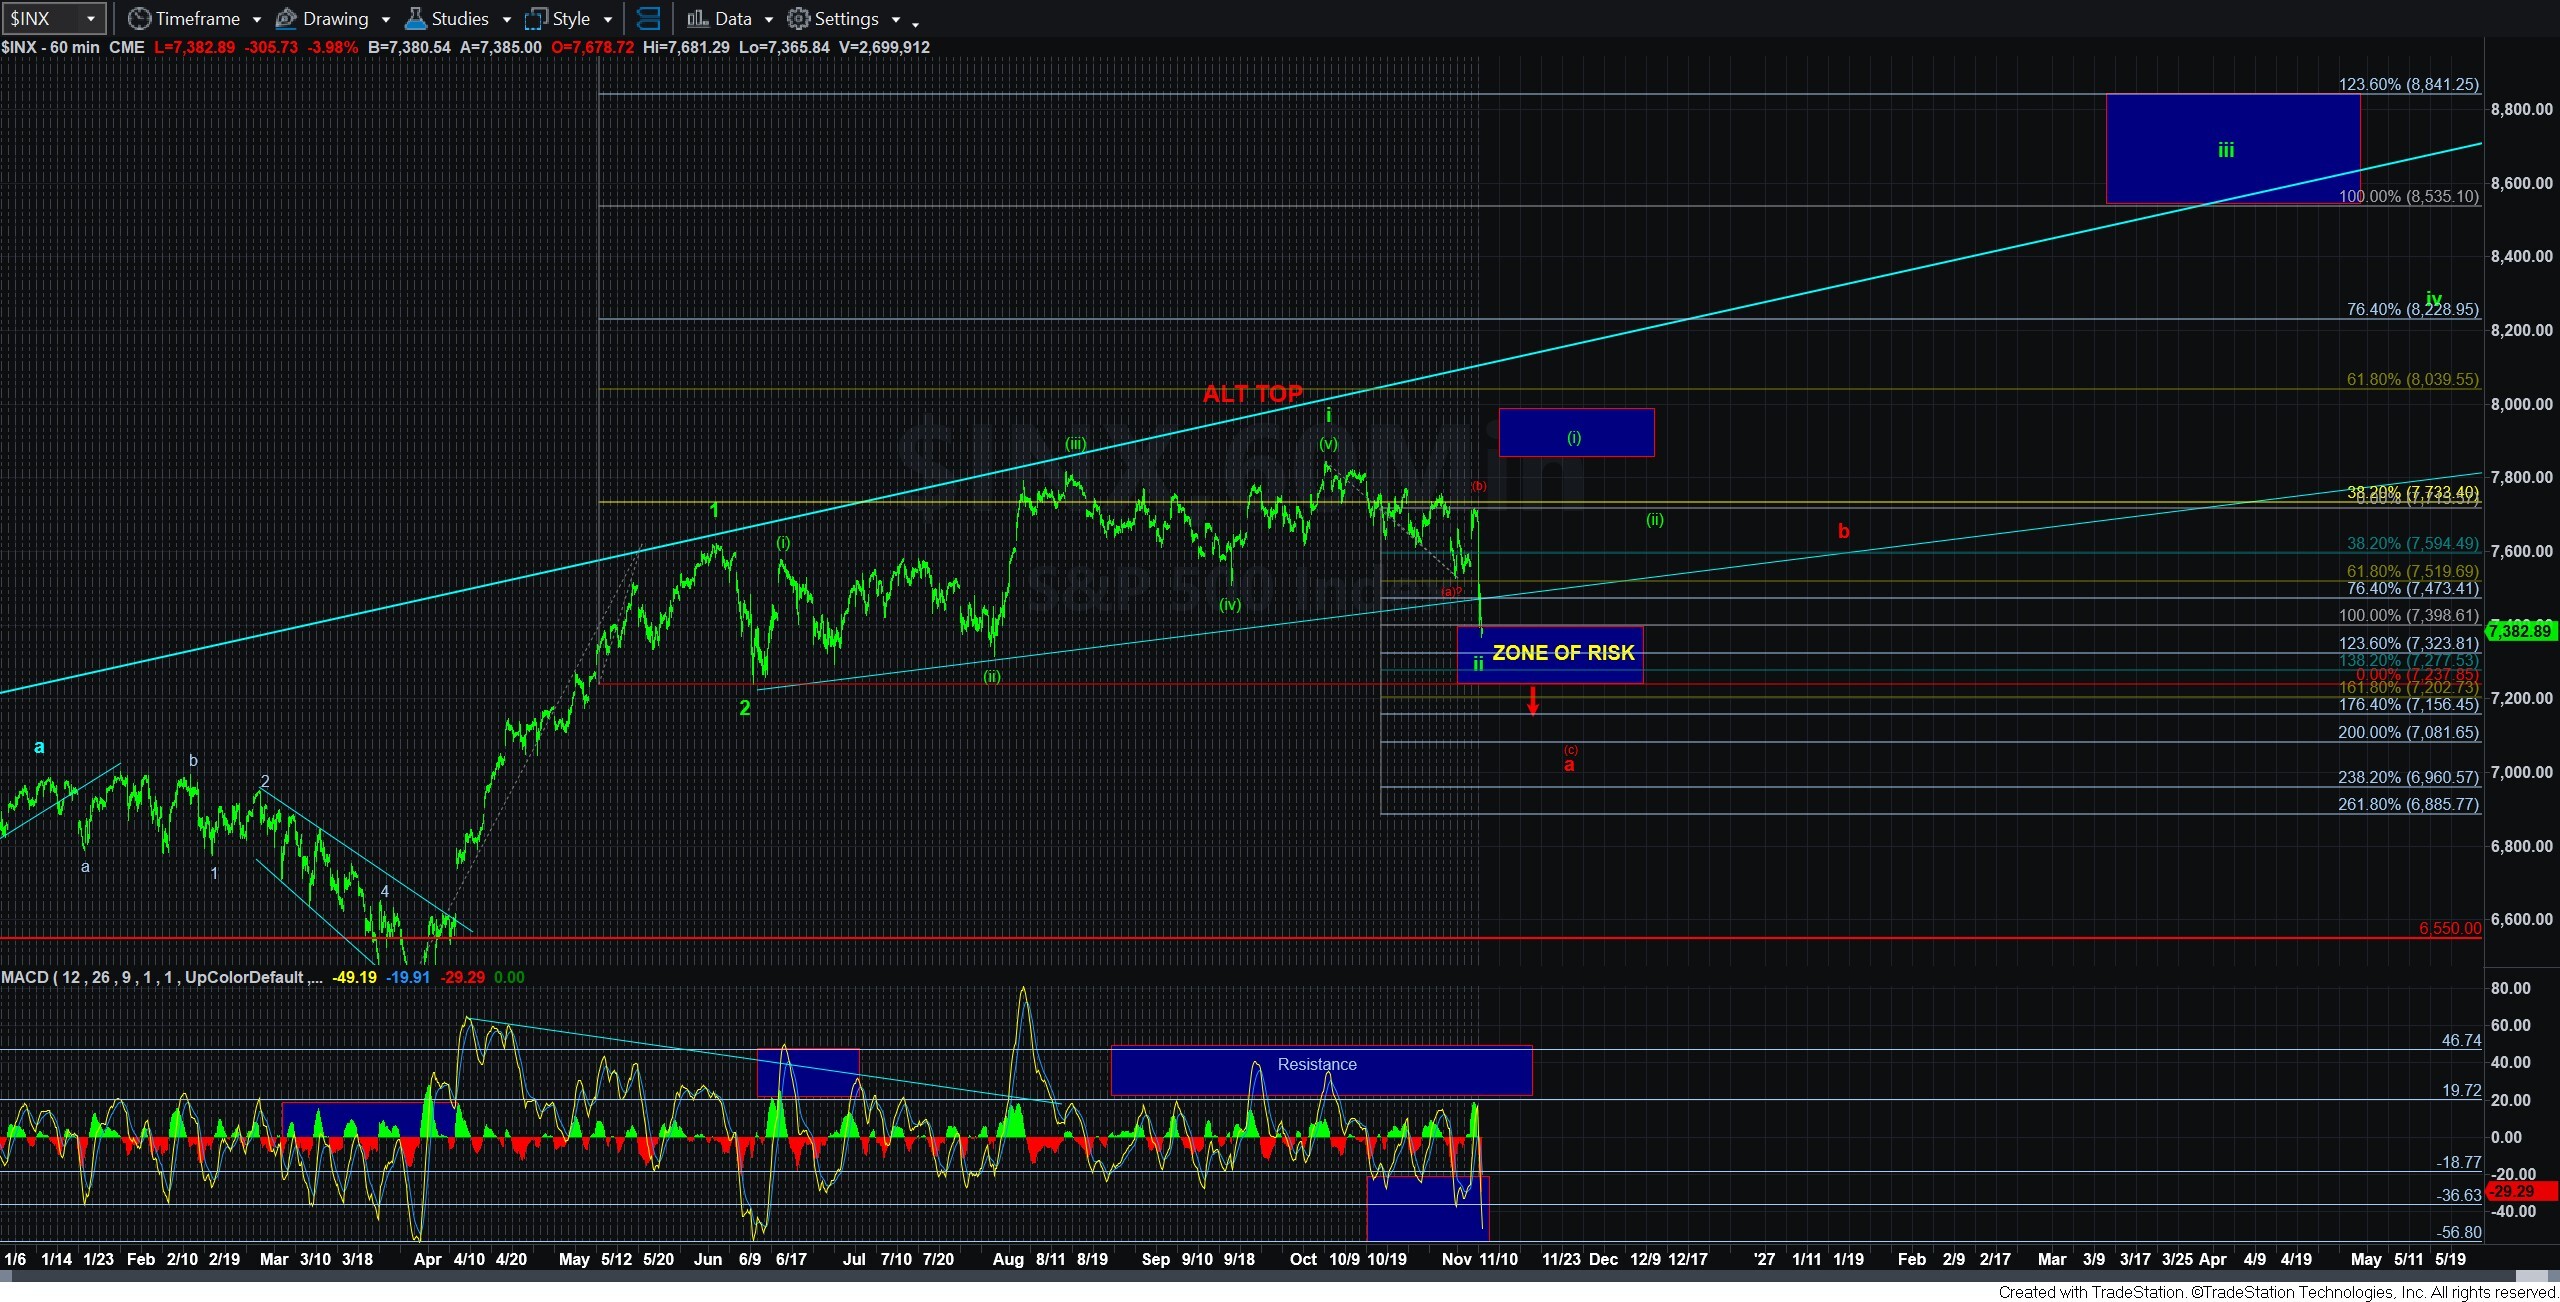
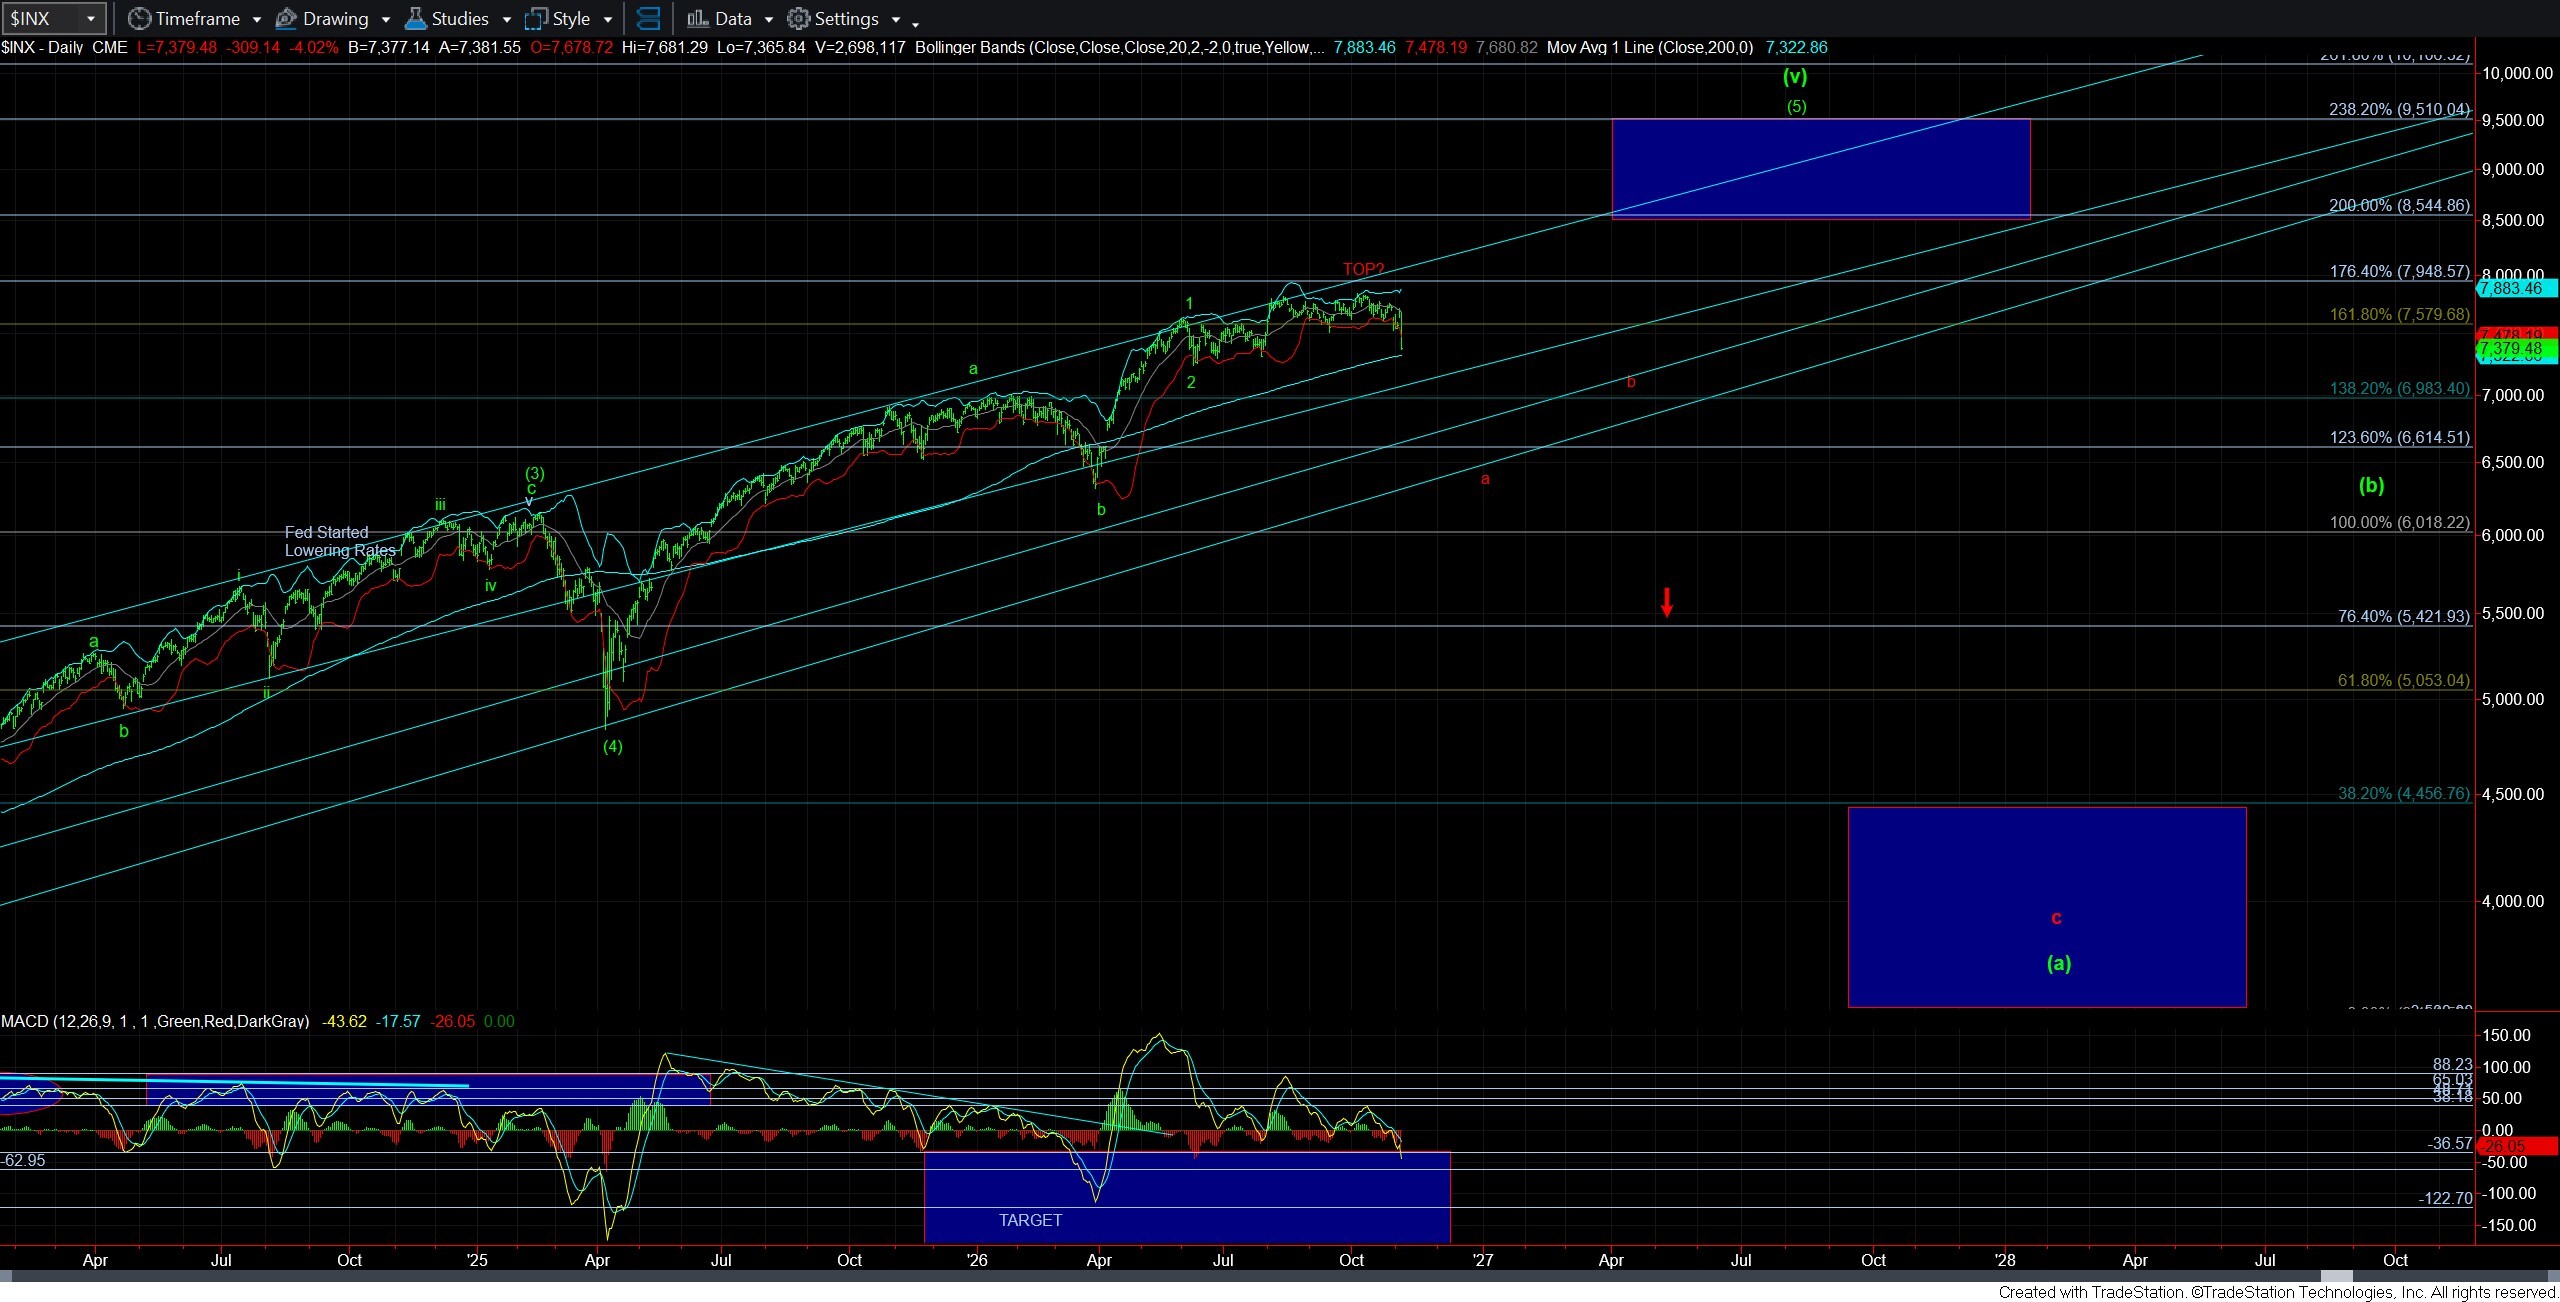
What the bulls will need to do to resurrect the green count - which, mind you, has still not yet been invalidated – is provide us with an impulsive break out through that pivot/resistance box and take us back towards the highs to complete wave (i) of wave iii. Also, take note that we are sitting right above the 200DMA, which many view as support.
Of course, if they are unable to do so, then we will likely invalidate this potential set up pointing us north of 9000SPX. And, should we break the 7237SPX level before seeing an impulsive move though resistance, then we have our first sign that a long-term bear market may have begun.
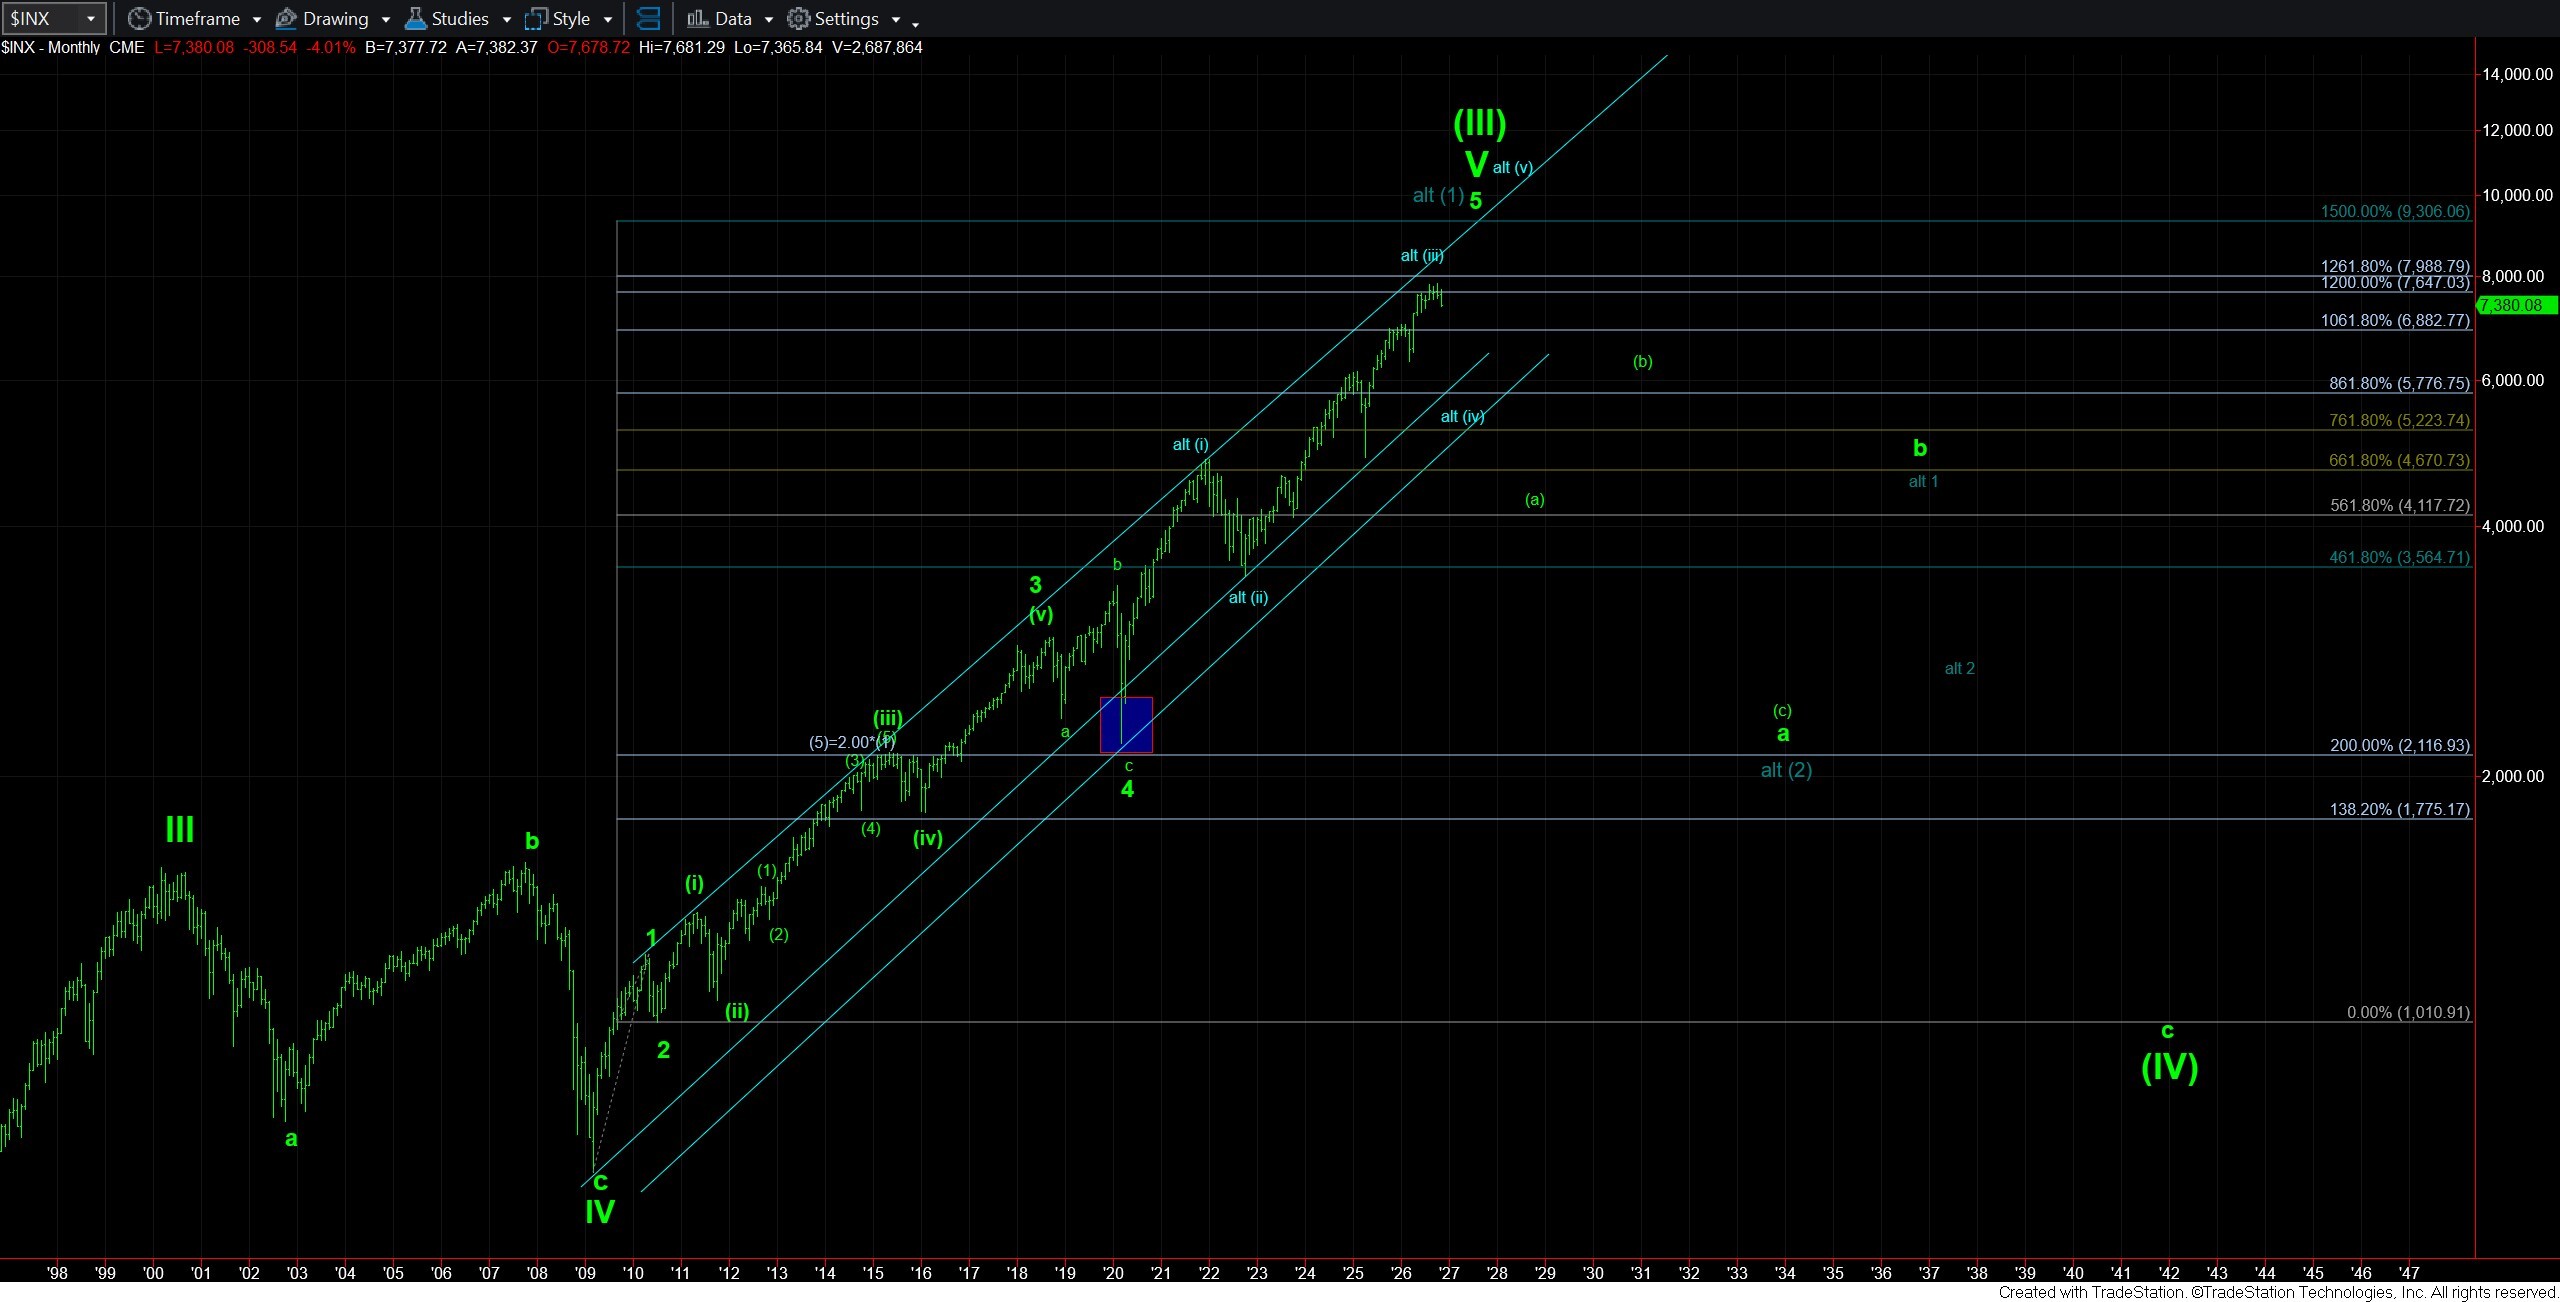
With that being said, I want to remind you that even if we break the 7237SPX region, there still remains some potential for one more 5th wave higher, as I have mentioned in prior updates, and added that alternative to the monthly chart. The main reason is because I really have not seen the type of reaction one would normally expect when a long-term ending diagonal such as this completes. This does leave the question in my mind as to whether it really is done even on a break of 7237SPX.
However, on a break down below 7237SPX, I would assume that we would return down to the 4700-5700SPX region even if it is a wave (iv) in blue in the alternative noted on the monthly chart. And, that alone will likely bring a lot of pain for many investors. But, we will have to take that one step at a time. And, a break of 7237SPX should likely cause everyone to turn defensive for at least a move down to that region.
For now, the bulls are still alive, and still have a path to save this set up pointing us higher into 2027. And, until that is broken, I still think it is prudent to respect that potential. But, as I have mentioned many times in the past, keep in mind that a VERY long-term bull market has become quite mature, and we are approaching a very long-term correction. Whether it is about to begin is still a question.