Double Bottoms Cause EW Issues
 By
Avi Gilburt
By
Avi Gilburt
The problem with double bottoms is that they leave the door open to two reasonable interpretations of the wave count. And, of late, we are dealing with that issue.
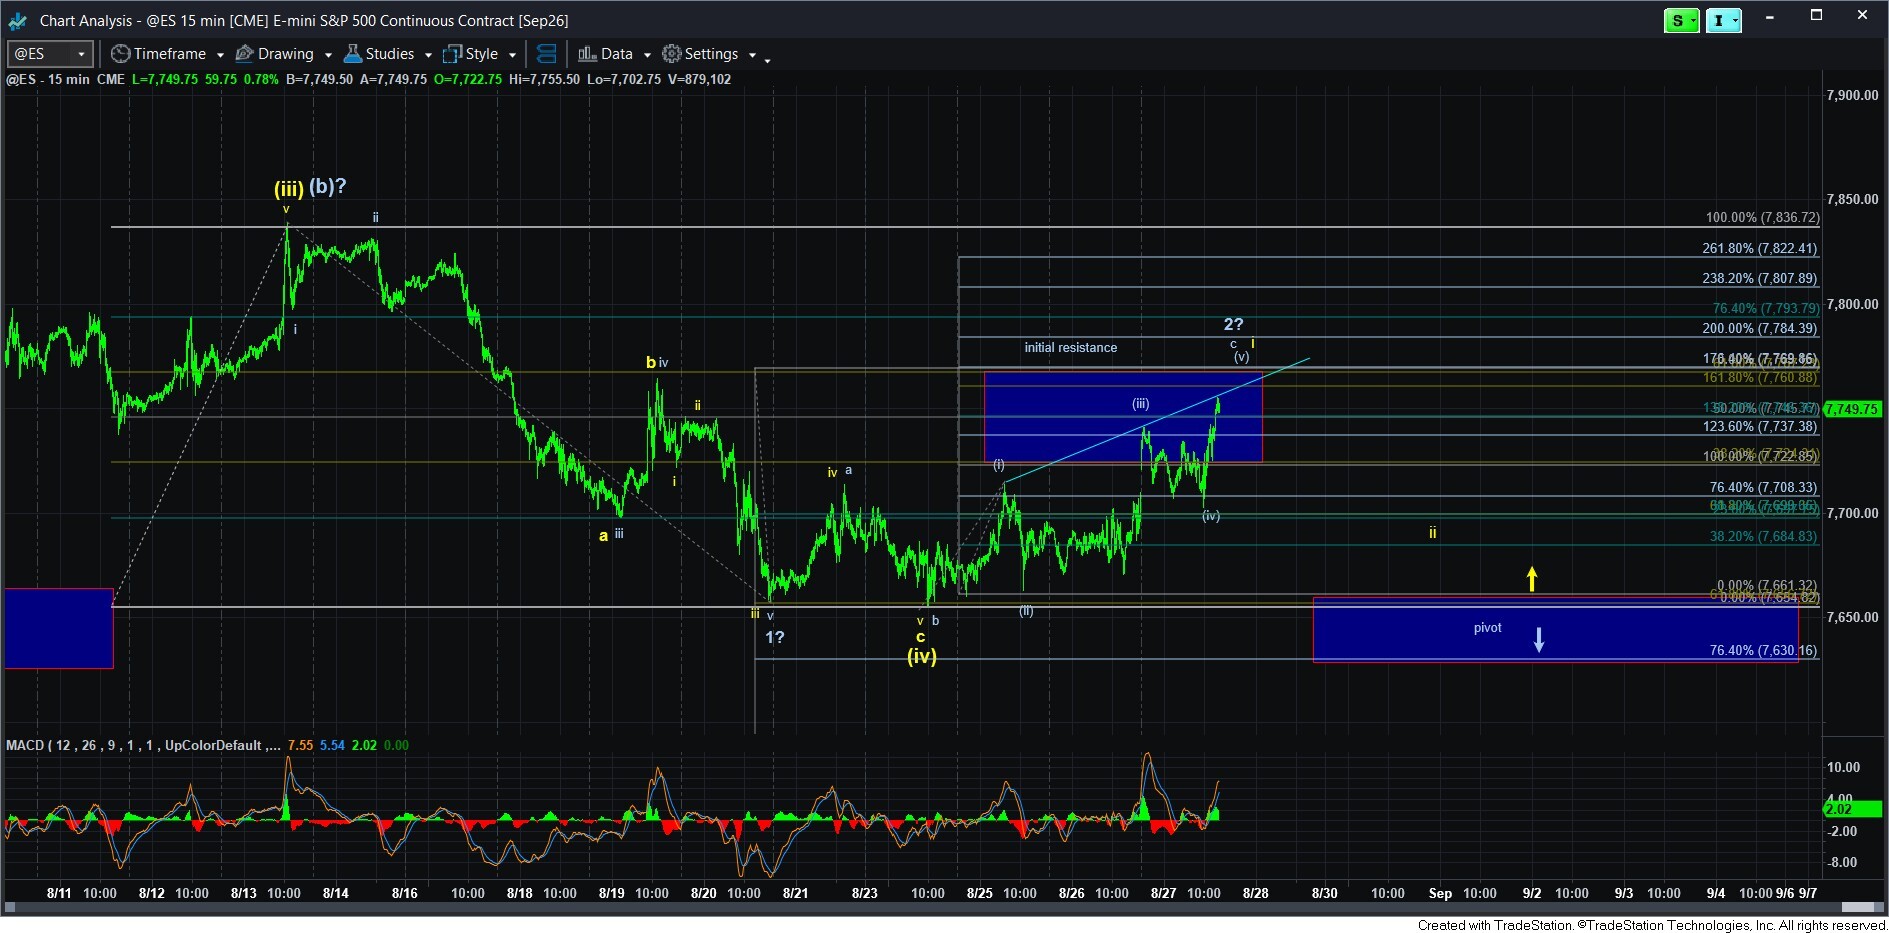
If you look at the attached 15-minute ES chart, you will see a great example of this type of problem.
As you can see, there is a reasonable wave count which provides us with a 5-wave decline off a (b) wave high, which we have labeled as wave 1. Thereafter, we have a bounce, followed by a slightly lower low, which I have noted as a potential a-b structure. This has been followed by a 5-wave diagonal, which can be accounted for as a c-wave in a bigger wave 2 bounce.
Yet, there is an equally reasonable structure which can count as an a-b-c corrective pullback for wave (iv) in yellow. If this decline had dropped a bit deeper, then the wave 1 count presented on the chart would have been significantly less likely as the a-wave would then be equal to the size of the c-wave, which is quite common for corrective structures. But, because we had a double bottom and not a more extended lower low, it left a reasonable interpretation for both paths. And, the current 5-wave leading diagonal we are tracking can either be wave i in yellow or the c-wave of the more bearish wave 2 alternative.
As an aside, the current rally has enough waves to consider this as a complete 5-wave structure. However, the more ideal target for a diagonal is the 1.764 extension of waves (i)(ii), which still suggests we can move higher towards the top of the resistance box.
So, then how do we distinguish between these two paths?
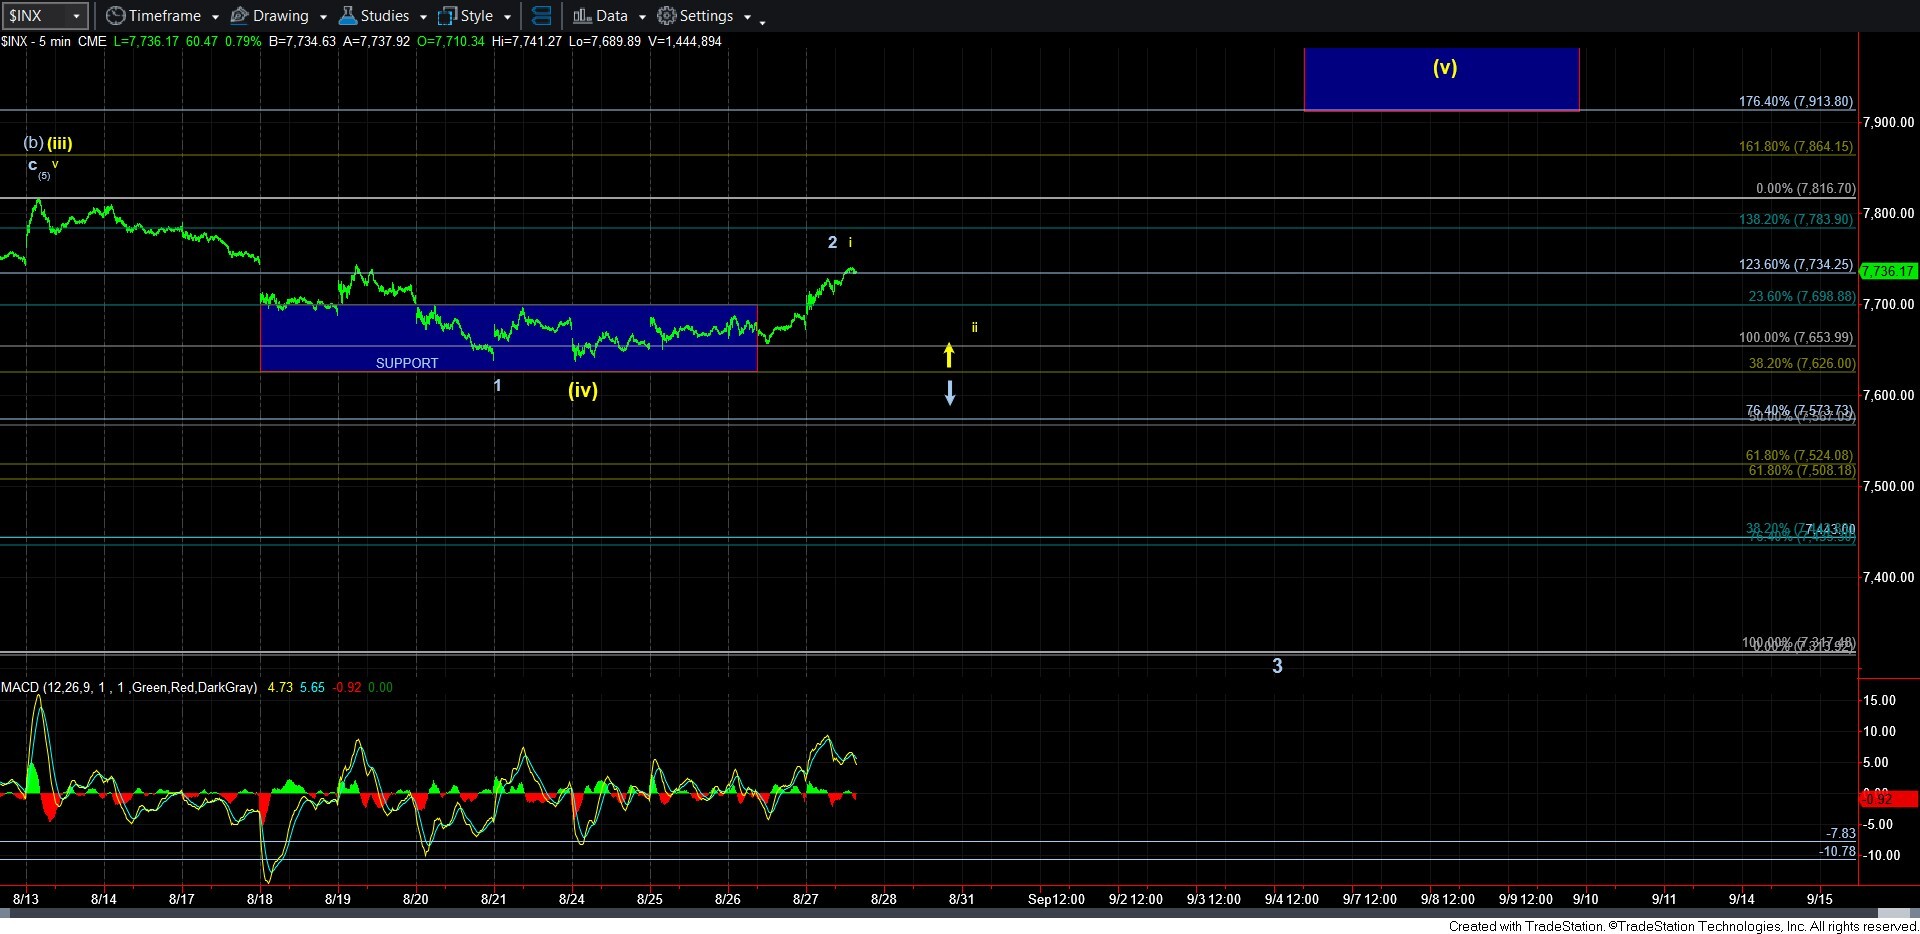
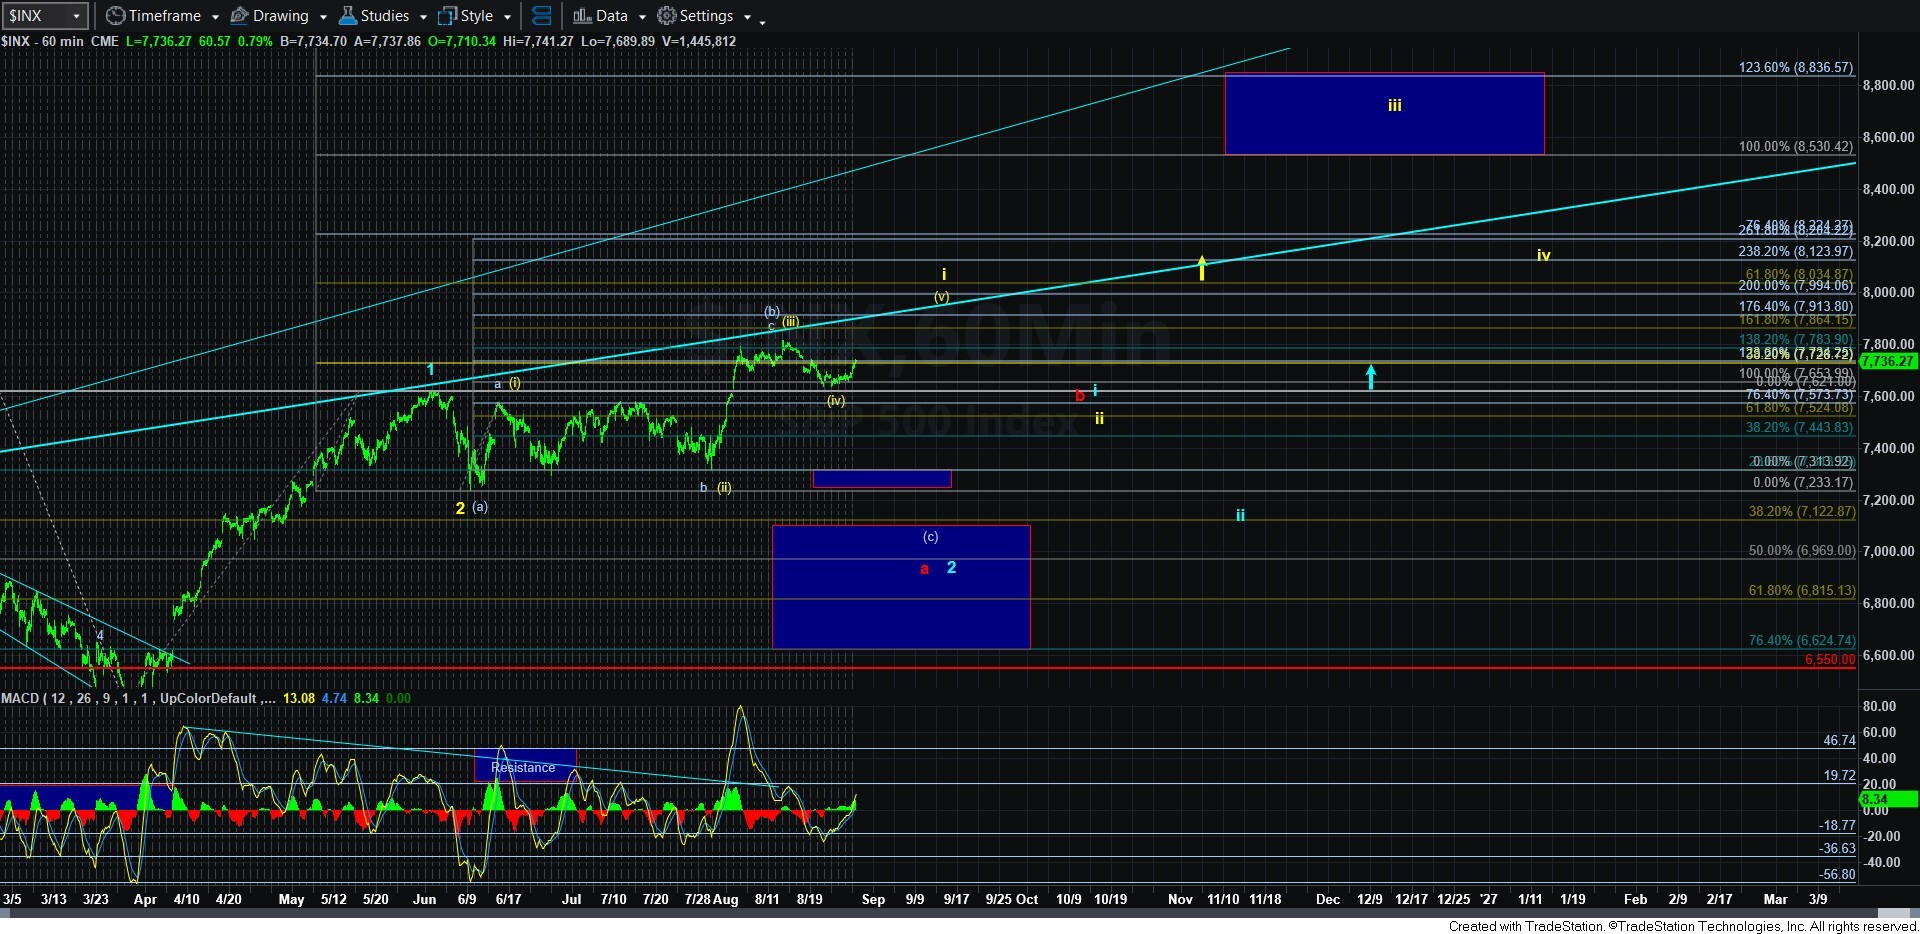
Well, first, as I mentioned before, the 60-minute MACD is now turning up from a region that has accompanied many rallies before. So, this is one of the reasons my primary count is listed as the yellow count. But, in order to maintain this primary count, we will need to see a CLEARLY corrective retrace for the yellow wave ii, followed by a rally back over the wave i high. This would make it highly likely that we are going to rally to the target box above on the 5-minute SPX chart, and complete 5 waves off the June low.
Alternatively, should the market break down in impulsive fashion below this week’s low, that opens the door to a 3rd wave decline pointing us down to the 7300SPX region in the (c) wave alternative count we have been tracking.
So, the nature of the next pullback can shed further light on the next directional cue for the market. But, as I noted, the primary count is going to remain yellow until we see a break down below this week’s low which will then invalidate the yellow count.