Does This Market Have Enough Gas Left in the Tank for Another Push Higher?
 By
By
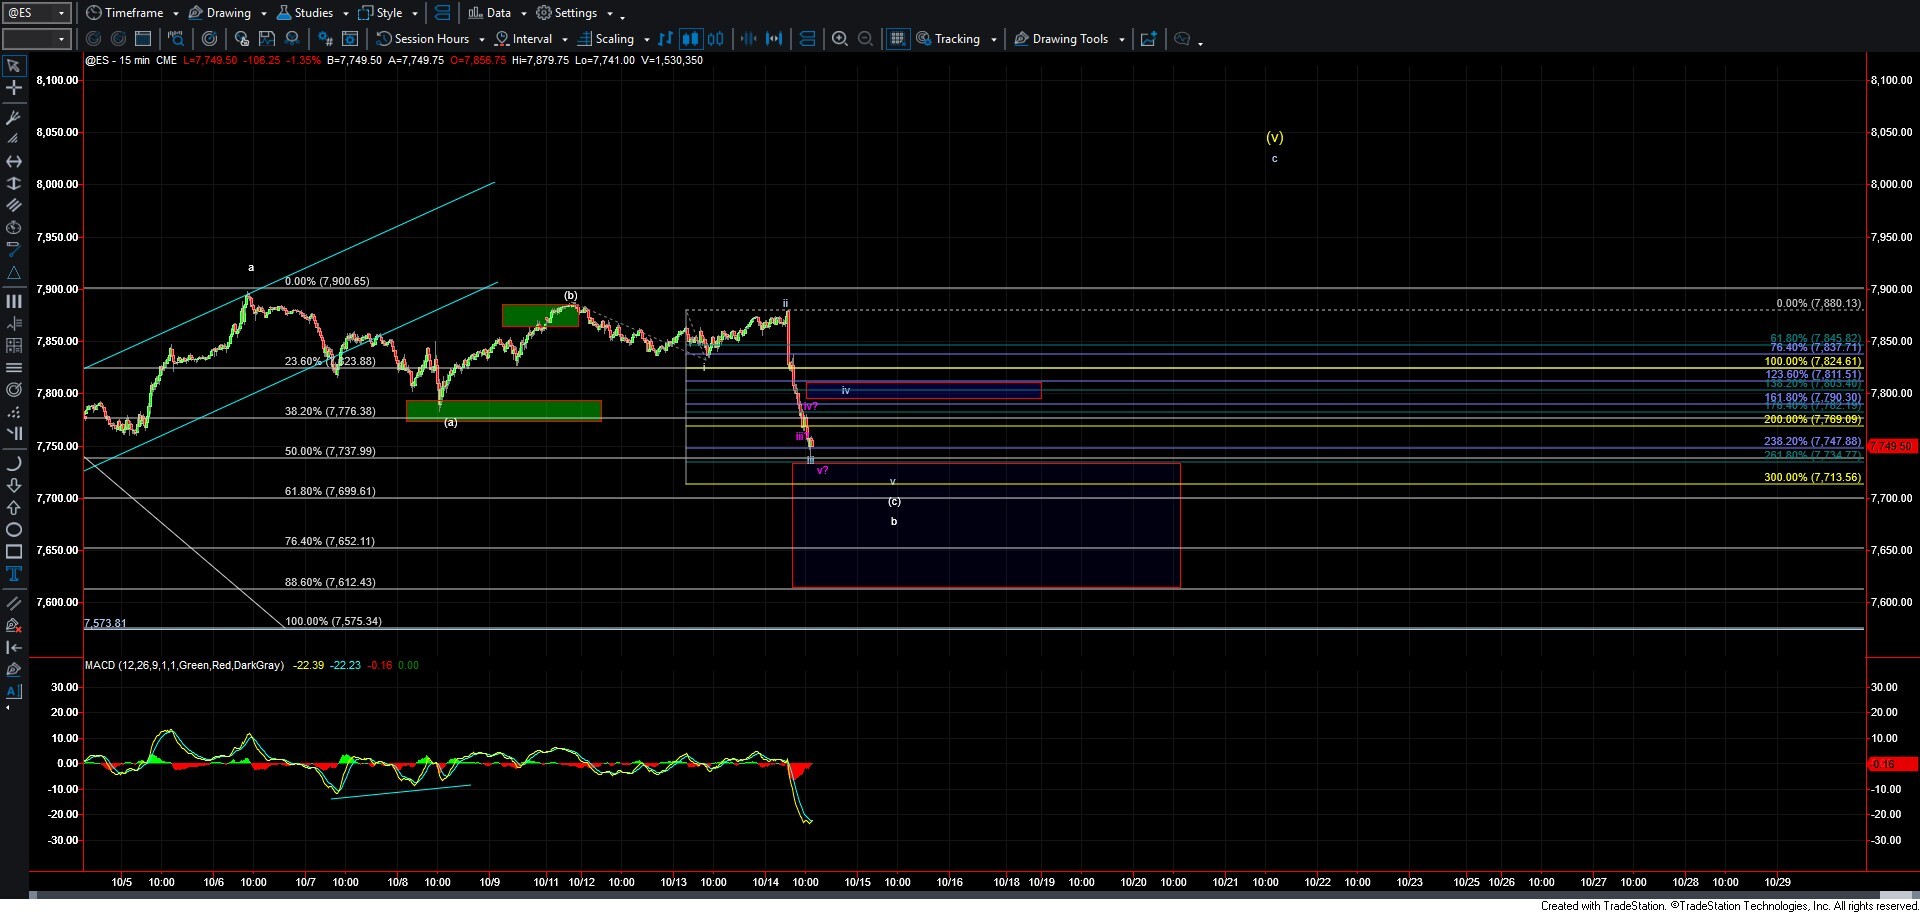
Today, we saw the market pull back relatively sharply after trading sideways for the better part of the last five trading sessions. While the pullback itself was not entirely unexpected, the velocity of the decline likely caught the attention of many traders after the market had seemingly put everyone to sleep over the past week.
The question we now have at hand is whether this pullback marks the beginning of a larger corrective move to the downside or whether we are getting closer to finding yet another local bottom before making another push to new highs.
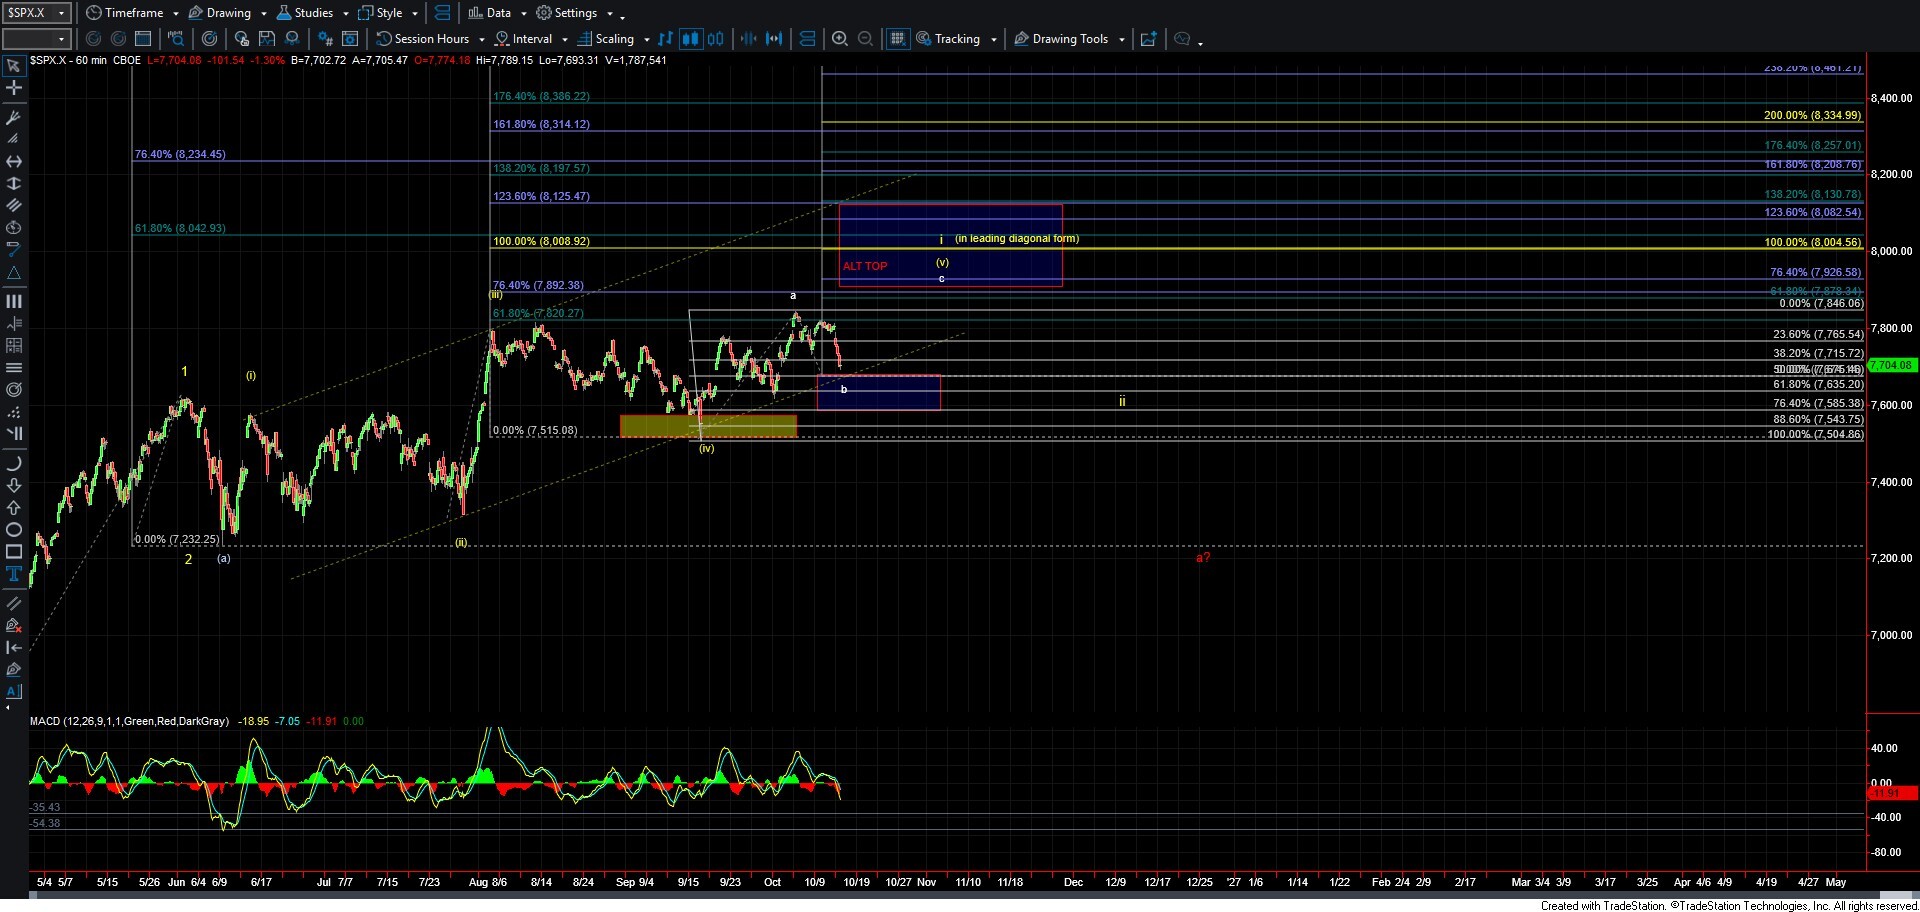
My preferred interpretation of this action is that we are filling out the wave b of the larger wave (v) that we have had labeled on the charts over the past week. There are several reasons why I continue to favor this interpretation. That being said, I do not want to downplay the risks that this market currently poses to the long side, especially given where we are within the larger pattern.
I will discuss why I am still leaning toward another push higher while also addressing the very real risks that are present should the market begin to break support.
Why I Still Favor Another High
While the overall pattern remains fairly sloppy, the move off of the 6/9 low and into the 10/6 high is almost certainly a diagonal. Whether that diagonal is an Ending or Leading Diagonal has yet to be determined, but we can say with a fairly high degree of confidence that the structure itself is indeed a diagonal.
Now, the high struck on 10/6 does potentially give us a completed diagonal, as it exceeded the high of the potential wave (iii) struck on 8/5 on the SPX. However, there are some issues that I have with accepting that interpretation as primary count.
The SPX only marginally exceeded that prior high, while the ES failed to exceed it altogether. It is fairly uncommon for the fifth wave of a diagonal to terminate without making a more substantial push toward the upper boundary of its trend channel. It is even less common to see a truncated fifth wave of a diagonal, which is what we would have to accept on the ES chart.
Neither of these issues invalidates the possibility that the diagonal has already completed, but they do make me hesitant to adopt that interpretation as my primary count just yet.
For those reasons, I still favor another push higher before the diagonal off of the 6/9 low is complete.
What I Want to See to Confirm Another Push Higher
Under my preferred interpretation, the current decline is filling out the wave b within the larger wave (v), as shown on the charts.
For this count to remain viable, I want to see the SPX hold the 7675–7585 support zone, ideally finding a bottom closer to the upper end of that region, where the lower boundary of the diagonal trend channel currently sits.
From there, we would need to see a full five-wave move to the upside, followed by a break back over the 7776 level on the SPX, to provide initial confirmation that the wave b low is in place.
A subsequent break over the 7846 high would provide further confirmation and have me looking toward the 7926–8130 region as the next upside target zone to complete the diagonal off of the 6/9 low.
Should we reach those higher levels and begin to see a reversal, we would once again need to assess whether the completed structure is an Ending Diagonal, as shown by the red count, or a Leading Diagonal, as shown by the yellow count, as discussed in the previous updates.
The Risks of a Larger Top Already Being in Place
Now, while I continue to favor another push higher, I want to emphasize that the risks to the long side in this region are quite significant.
Should the market begin breaking through the support levels noted above, followed by a break under the 7504 level, it would suggest that the diagonal off of the 6/9 low has already completed.
If that diagonal was indeed an Ending Diagonal, as shown by the red count, rather than a Leading Diagonal under the yellow count, then the path forward would become considerably more bearish.
Under that scenario, we could see a very sharp reversal lower, potentially taking the market back toward the 6/9 low to start with. And given the nature of reversals following completed Ending Diagonals, that decline could unfold rather quickly, leaving traders who are positioned heavily to the long side scrambling for the exits as the downside momentum accelerates.
This is why I do not want to dismiss the possibility that a larger top is already in place, even though it is not yet my preferred interpretation.
Bottom Line
For now, my preferred path remains another push higher to complete the diagonal off of the 6/9 low. However, the fact that we may already have a completed diagonal in place means that we need to be mindful of the downside risks should support begin to break.
Even if we do get that final push higher, the amount of upside remaining may be relatively limited compared to the potential downside should the completed diagonal count prove correct.
So, while I am still giving the upside the benefit of the doubt, this is certainly not a region where I would want to become overly aggressive on the long side. The key will be watching how the market reacts within the support zone and whether we can begin to develop the impulsive structure needed to confirm that another rally is underway.