Does The Breakout Make Us Bullish?
The simple answer to this question right now is “no.”
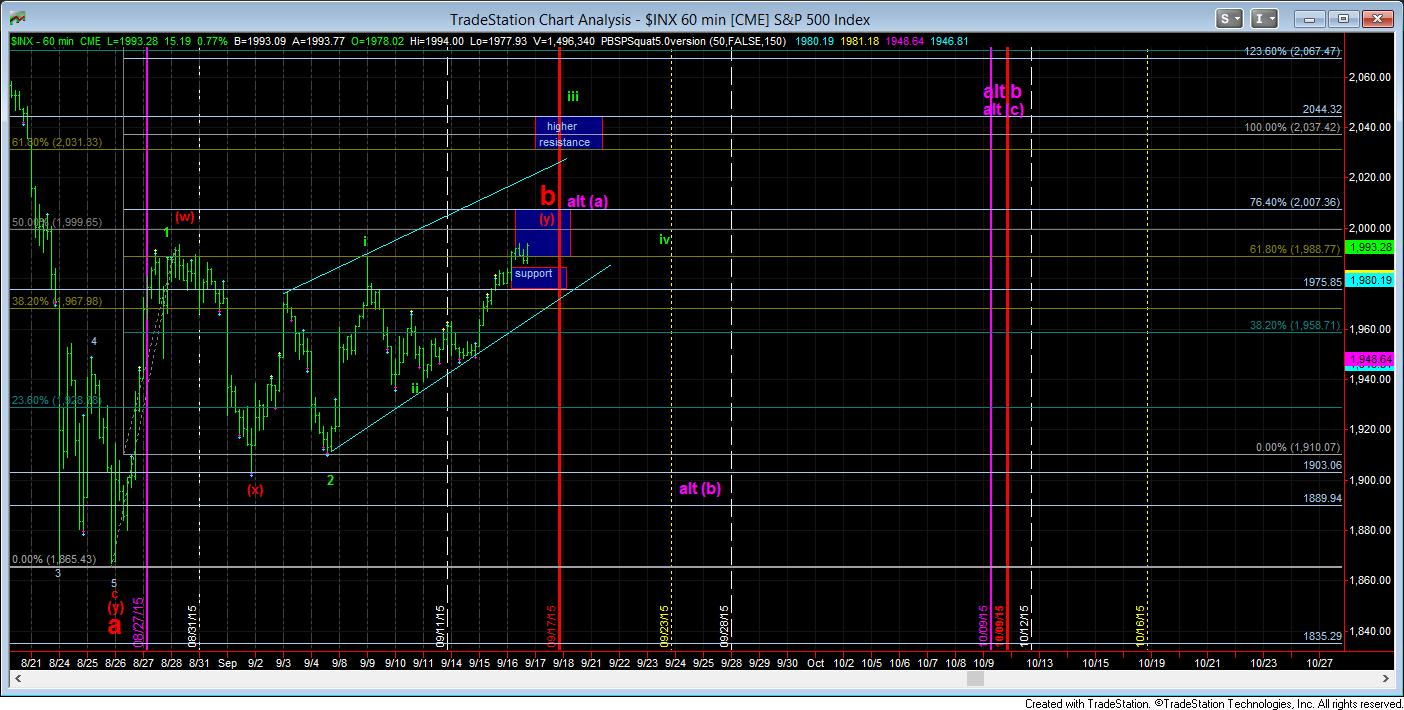
With the SPX taking out initial resistance at 1989SPX, it has invalidated a potential 1-2 set up to the downside. But, it has not turned the larger pattern bullish just yet. As I have said countless times, it will take an initial move to at least the 2037SPX level – and preferably as high as 2067SPX – before I can even consider any more bullish possibilities to the 2500 region, as discussed before.
But, that does not mean I am immediately bearish either. While we have now almost struck the .500 retracement of the August decline, the market has enough waves in place to top if it so chooses. For the market to prove that a top has been made, and that we are heading back down to the 1900 region, we will need to see the support region between 1975-1985SPX taken out. Until that happens, this market can continue to extend higher.
But, there is one additional fact we need to consider, and that is our Bradley turn timing. We have been rallying into a major Bradley turn date on the 17th. In fact, this Bradley date is actually called a “declination” time frame. So, it is reasonable to assume that the market may top in this region and begin a decline into the next Bradley date, which is on the 23rd of the month.
Lastly, since we did not retest the lows, I have added an alternative count which makes a lot of sense from a timing perspective, and which would push out the bottom to P4 until the Thanksgiving time frame.
So, unless the market is able to prove to me it is in a much more bullish posture over the next week by filling the green count, my expectation is that we will revisit the 1900 region once the market confirms a top in this region.