Do You Want To Do This The Easy Way Or The Hard Way?
With yesterday’s move through 3310SPX, the market gave us an initial indication that it wanted to do this the hard way, and today it certainly confirmed that.
As I have outlined many times in the past, most often we see an a-b-c corrective structure, the c-wave takes shape as a standard 5-wave structure. Unfortunately, this is not one of those times, so the market seems to be choosing to do this the hard way.
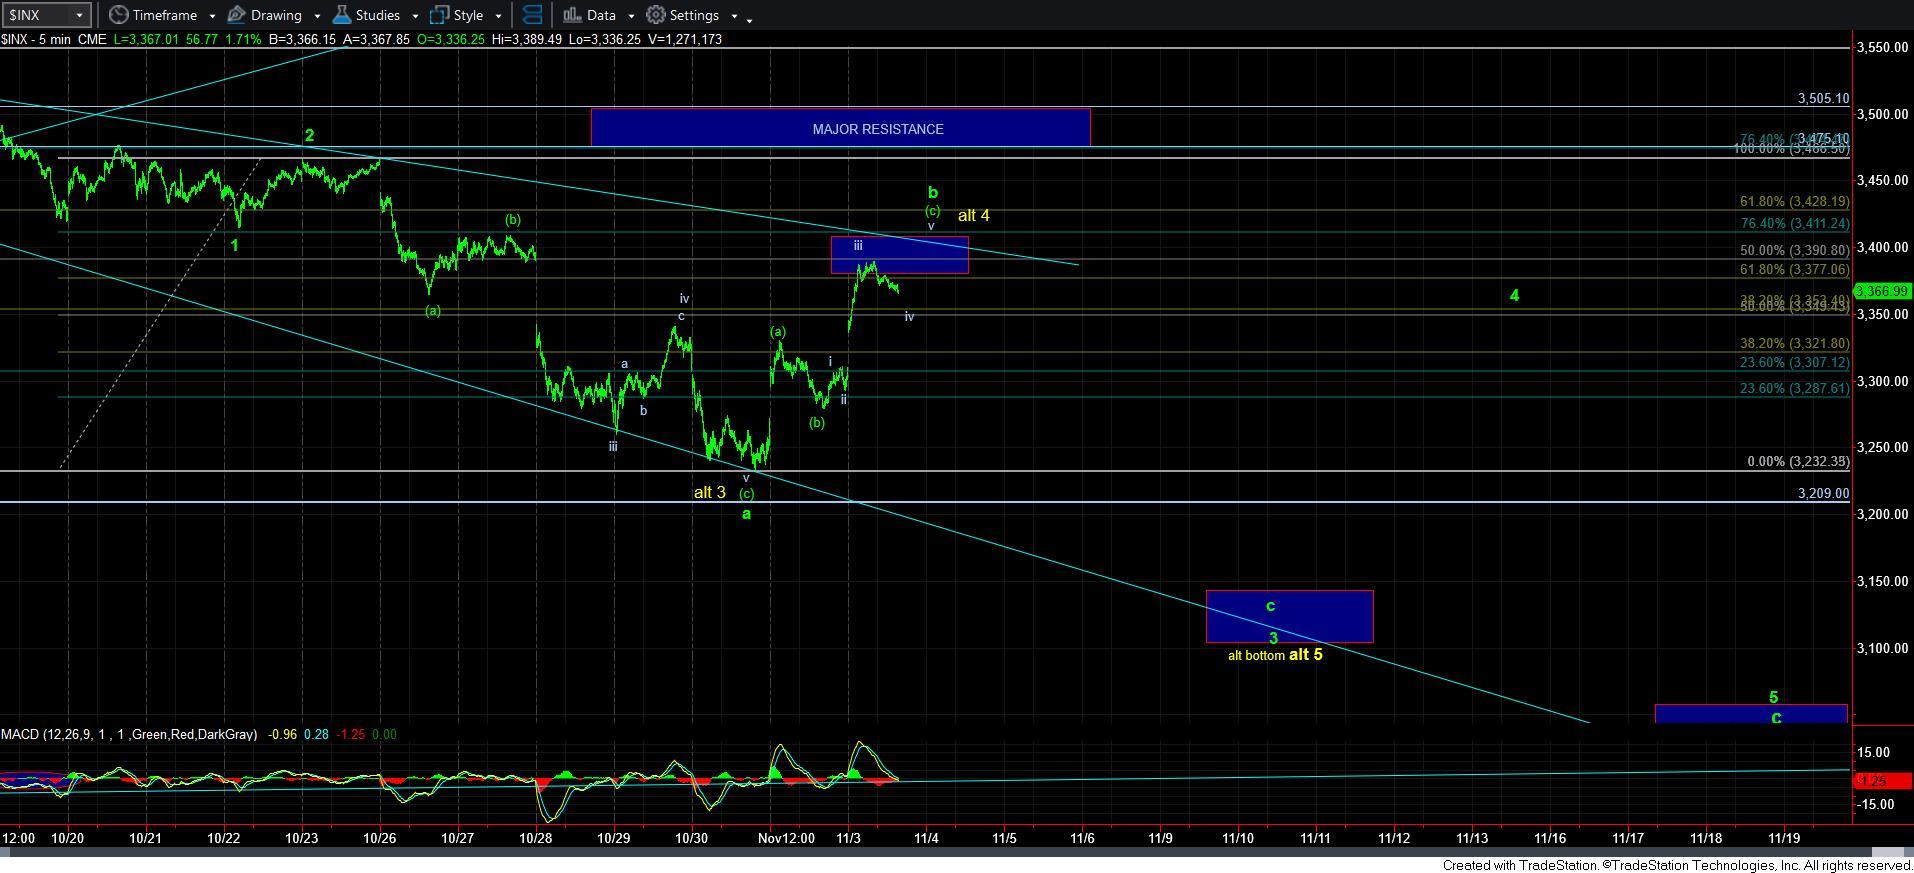
Now, based upon the structure we are seeing in the SPX, the only way the market is going to drop to our targets below is within an ending diagonal pattern. And, what we know about ending diagonals is that they present tremendous whipsaw to market participants. This one seems no different.
Before I go into the pattern and parameters, I want to clearly state that while the structure is not something I would consider to be “highly probable” to trade, I still think the greater probabilities suggest that we see lower levels in the coming days and weeks. The ONLY thing that would make me think otherwise is if the market is able to remain over the 3350SPX region, and head directly to the MAJOR RESISTANCE region overhead and complete 5-waves off last week’s low. Barring that completed structure, I still expect lower levels to be seen.
The complicated issue within this structure as presented is that there are several ways this can complete – as presented in green and yellow. My preference remains green, which means we have more whipsaw to come, as we complete the c-wave of wave 3, followed by wave 4, and then an a-b-c decline for wave 5. And, this can easily take us into the end of the month before this completes.
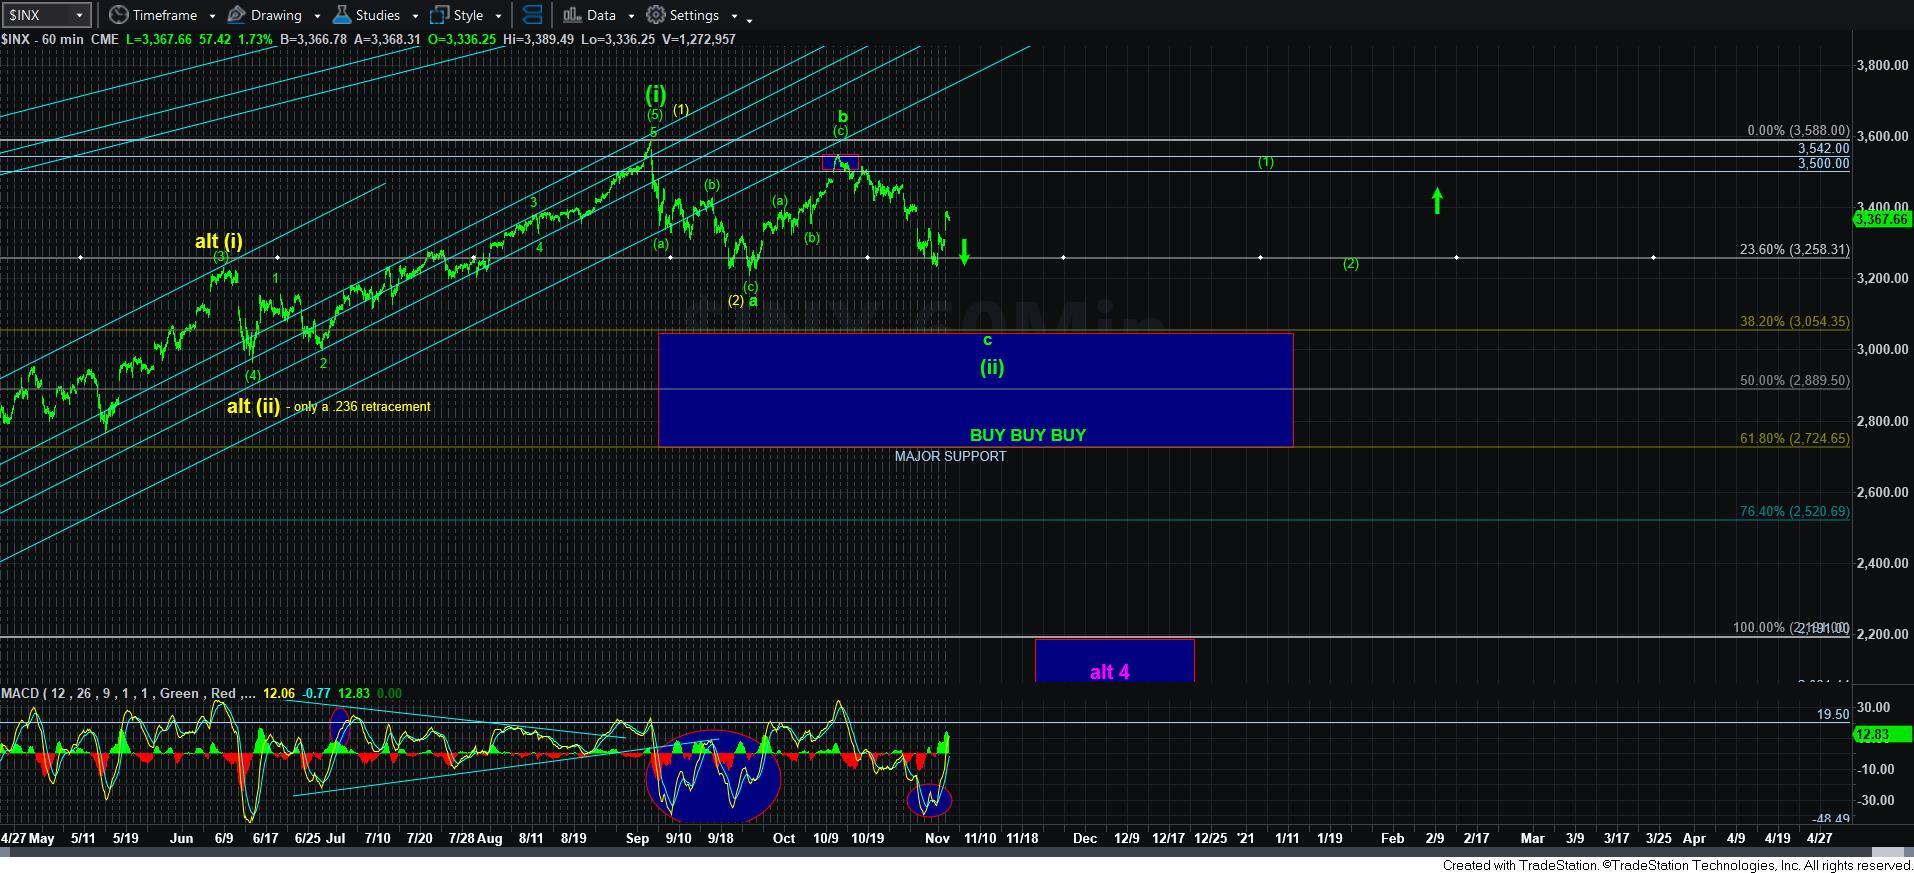
However, there is also a reasonable interpretation allowing for the next drop to the 3100-3150SPX region to be all of the entire wave [ii], especially with the positive divergent set up that has developed in the MACD on the SPX 60-minute chart. So, as I said above, the market has certainly chosen the more complicated path.
This morning, I invited all our main room members into my live video and I discussed a number of nuances with regard to this pattern, and I would strongly suggest that you review that video. It even goes into my own plans of when and what I buy within this region and why.
So, to put this as simply as I can, resistance is as high as 3411SPX in this current rally, and as long as we remain below that resistance and then break down below 3350SPX, I think we remain in the ending diagonal patterns presented in yellow/green. However, if the market can prove itself to be more bullish and complete 5 waves up to the MAJOR RESISTANCE region in the coming days before breaking down below 3350SPX, then I may have to consider all of wave [ii] as completed in an unorthodox manner. But, for now, I still think the probabilities side with much lower to go before we complete this wave [ii].