Do You Feel Lucky, Punk?
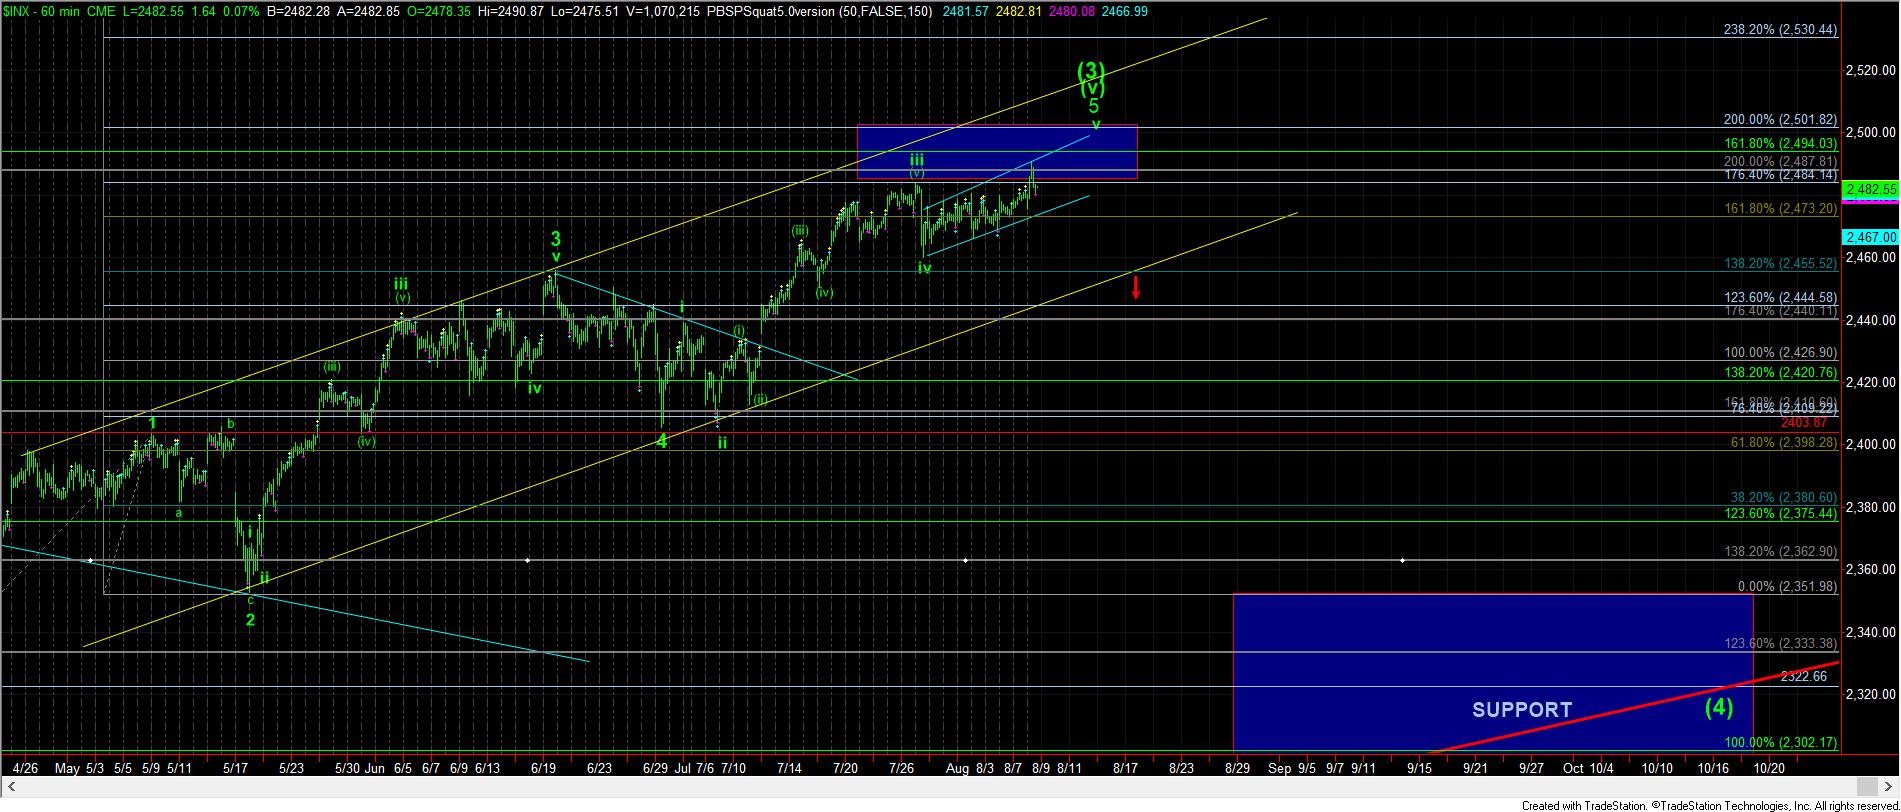
Today, we finally struck the bottom of the target we have had for this segment of the rally off the February 2016 lows (2487SPX). Moreover, we have struck that target in what seems to be an ending diagonal pattern for this final segment. Confirmation of that should be a strong break down below today’s low of 2475.50.
In the bigger perspective, as I have been showing on my daily chart, the market has been providing the type of negative divergences one normally sees as the market is topping, with the MACD making lower highs as price continues to make higher highs, on its way to our target region.
The question now is if the market wants to try to squeeze higher one more time before we top. To be honest, I don’t feel lucky enough to be betting on such a potential. Rather, most of what I am seeing in the market suggests we are in a topping pattern. Yet, the overlapping nature of this last micro segment over the last two weeks does make it much more difficult to pinpoint the top of the market, as these overlapping structures can continue to extend.
But, please note, we will need to see a strong break below 2475.50 to open the door to the market having topped in what we have labeled as wave (3).
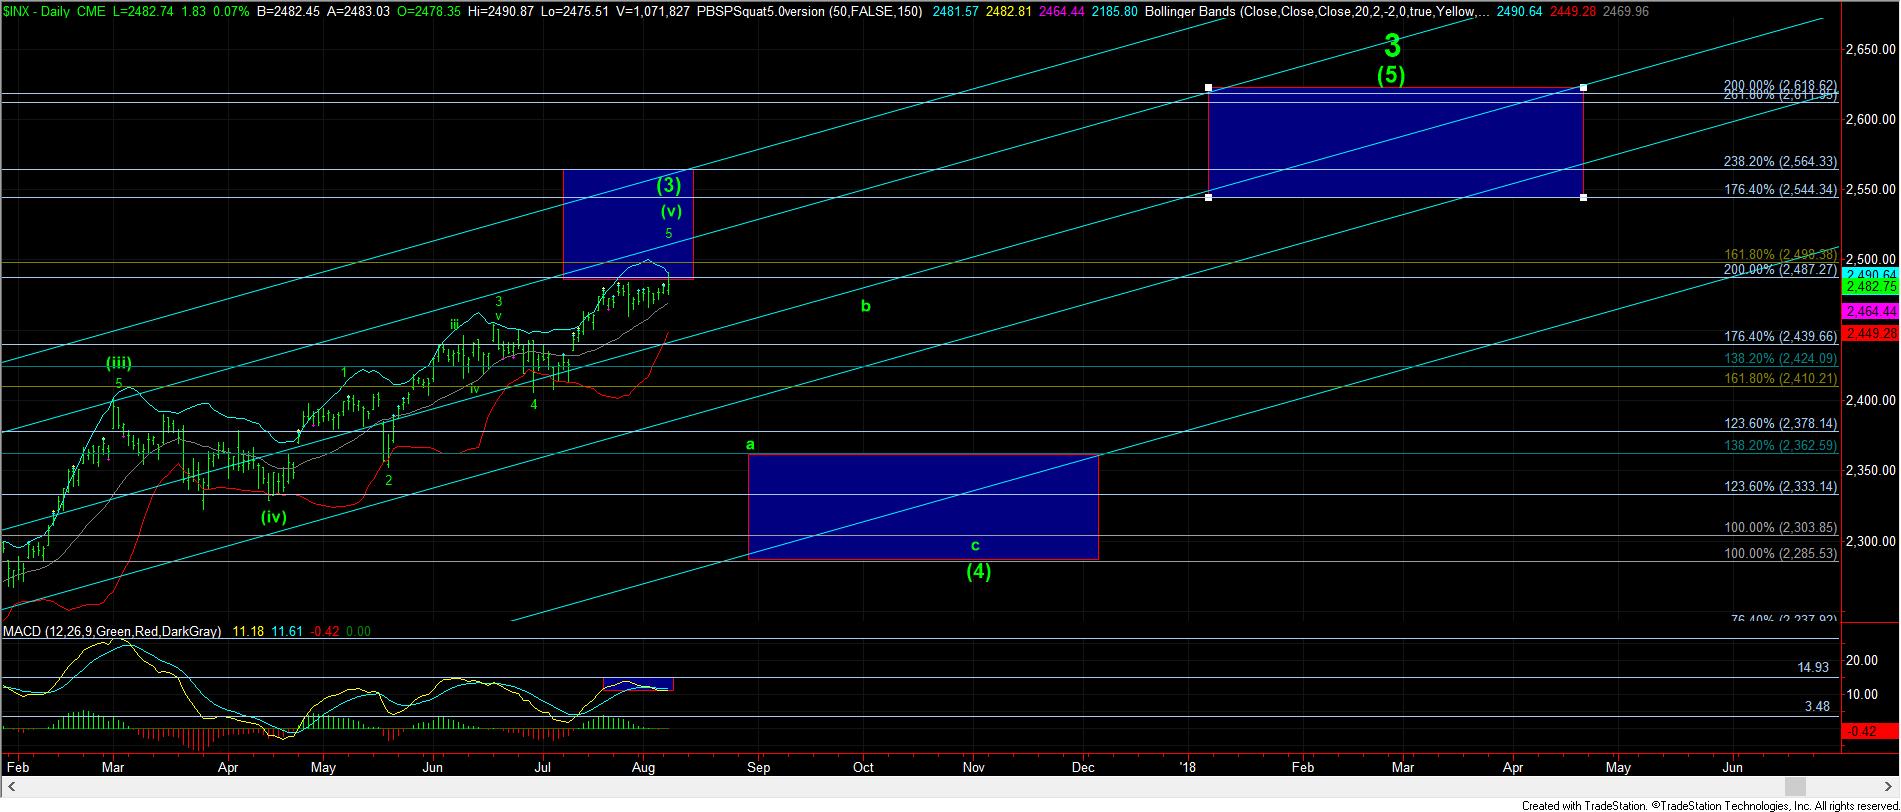
Now, I am going to be a bit presumptuous in my expectations. Assuming we have either topped already, or even if there is one more push higher, I have now placed the standard expectations I would normally have for the next market pullback on my daily chart.
In standard patterns, the market will drop in an a-wave of wave (4) down towards the .236 retracement region after we have confirmed a top. That region is just below the 2400SPX region. This first move down will likely be quite strong, scare most market participants, and can even provide us with a 2%+ down day during the drop.
Thereafter, we would see a corrective bounce, which could last as long as a month, or even a bit longer. That would be the b-wave on the chart. Once the b-wave completes, my expectation would be for a c-wave down to take hold which will target the .382 retracement of wave (3), which also coincides with the 1.00 extension within our Fibonacci Pinball structure around the 2285-2300SPX region.
Again, this is how these 4th waves normally take shape under standard patterns. Of course, the market can chose to take a non-standard path, and even trace out a triangle over the next 3-4 months for wave (4). As we stand here today, there is really no way to be certain how it will play out, since 4th waves are the most variable of the 5 wave Elliott structure. But, as I noted, I have now annotated the daily chart with a standard path.
For now, I am on alert for a topping signal, with a strong break down below 2475.50. Once that triggers, the next confirmation will be a break down below the trend channel presented on the 60-minute chart.
Lastly, I want to warn you ahead of time not to get too bearish. The pullback we want to see will only be setting us up to rally back up towards the 2600+ region into 2018. So, while you will likely be hearing “crash-talk,” please do your best to ignore it, as your focus should be on setting up your shopping list for the fall for the rally we expect to see into 2018.