Do We Have A Local Bottom In Place?
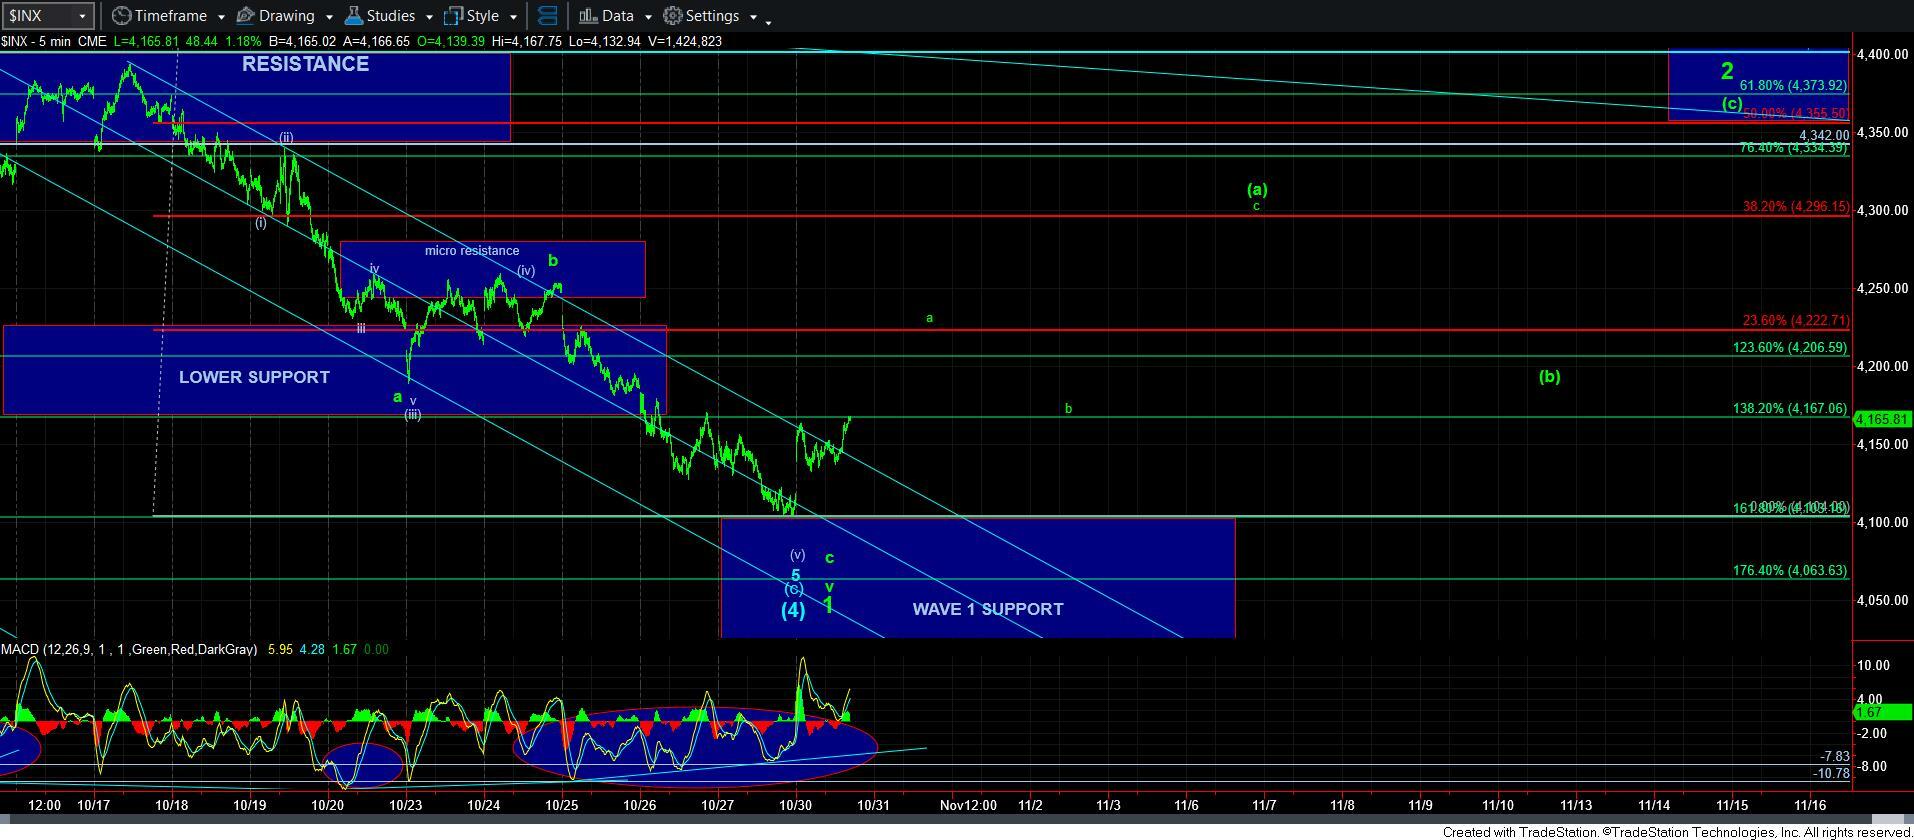
As I am writing this update, the market is attempting to push through the 4165SPX region. Moreover, the rally today off last week’s low can count as a 5-wave structure, with today’s pullback being a clear 3-wave pullback. This does provide some initial indication that a local bottom has potentially been struck. But, I would like to see a strong move through the 4165SPX region, and a continuation move through the downtrend channel, to make it a bit more reliable.
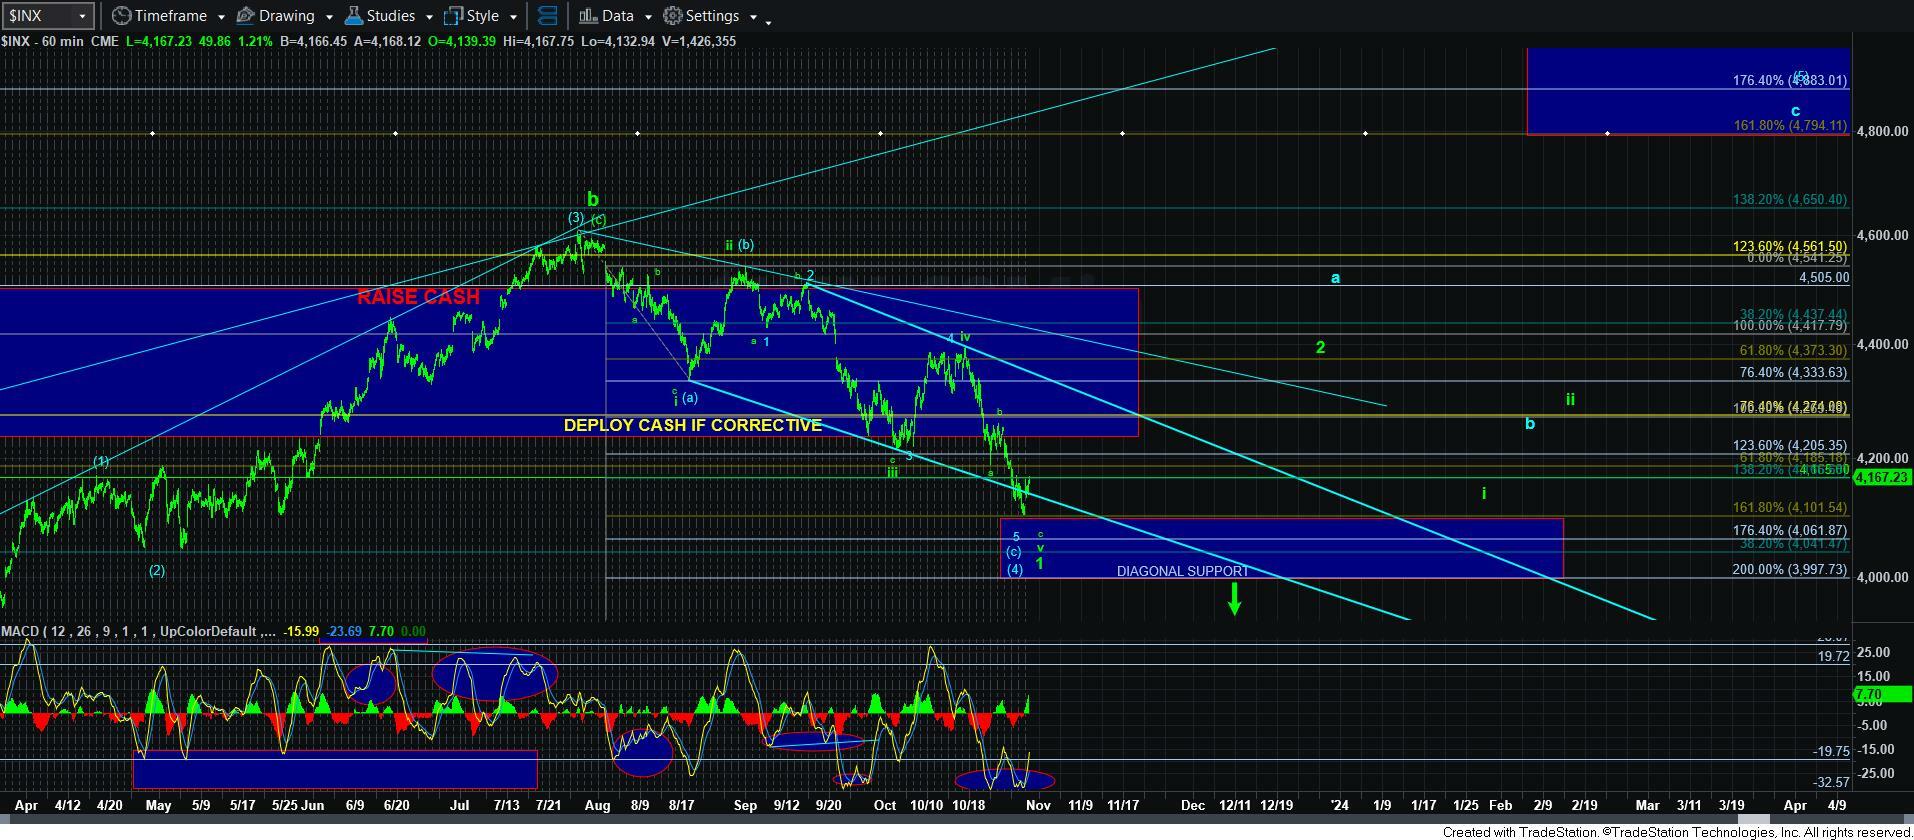
So, I assume we have to now begin discussing the next rally, which is of utmost importance. We will have to answer if the next rally is the green wave 2, setting up a very strong decline in the coming months, or if it is the a-wave of the blue count. There are two things upon which I will be focusing to make that determination.
First, you may notice that I have added red Fibonacci retracement lines on the 5-minute SPX chart. That represents the standard retracement levels applying for the green wave 2.
In a standard wave 2, the [a] wave of wave 2 often targets the .382 retracement of wave 1. So, you can see the [a] wave sitting right on top of the .382 red retracement line. Thereafter, we see a corrective [b] wave pullback, followed by a [c] wave rally to the target box on the chart. The target box represents the .500-.618 retracement of wave 1, and is a typical target for a 2nd wave.
Therefore, if the next rally takes this general shape, then I will clearly be quite heavily into the green count. However, if the market is much stronger than that for its [a] wave, then it will certainly open the door to the potential that the rally is the [a] wave in a larger a-wave in blue.
Second, as I noted in the weekend update, the rally in IWM MUST be a 5-wave structure in order to strongly suggest that we are going to rally to the 200+ region in a larger [c] wave. So, of course, I will be tracking the IWM quite carefully. At this time, I am not sure if the IWM has even bottomed, so I will reserve any comments on this right now.
In summary, we are seeing initial indications that a bottom has potentially been struck right at the top of the major support box. We will need to see a continuation move towards the 4220SPX region in the coming days to confirm.
Lastly, do not view my 5-minute chart from a timing perspective. It is simply to show a general path.