Do Or Die Time
First, I want to apologize to you all for my struggling with that bottoming structure of late. Even when I look back upon it now, I cannot say that there is a satisfactory bottom to which I can point. Nor did we have a clear impulsive initial move off a low, as it would only count as a leading diagonal in the futures. When taking into account the manner in which we bottomed, as well as the manner in which the rally began, I would honestly never consider this structure as a clear bottoming structure no matter how many times I would look at it. But, with the market breaking out over the triangle structure, I have no choice to consider that wave 4 is done.
Now, going back to what I have been saying as we were approaching the lows, the oversold nature of both the NQ and the SPX daily charts, as well as the divergences developed on the smaller degree charts as we hitting our long term support region in the 4165-4270SPX region, I think I was clear in outlining that this was a bottoming region and a buying opportunity. And, for those of you in the trading room, you saw my posts about me buying more IWM and EEM as well.
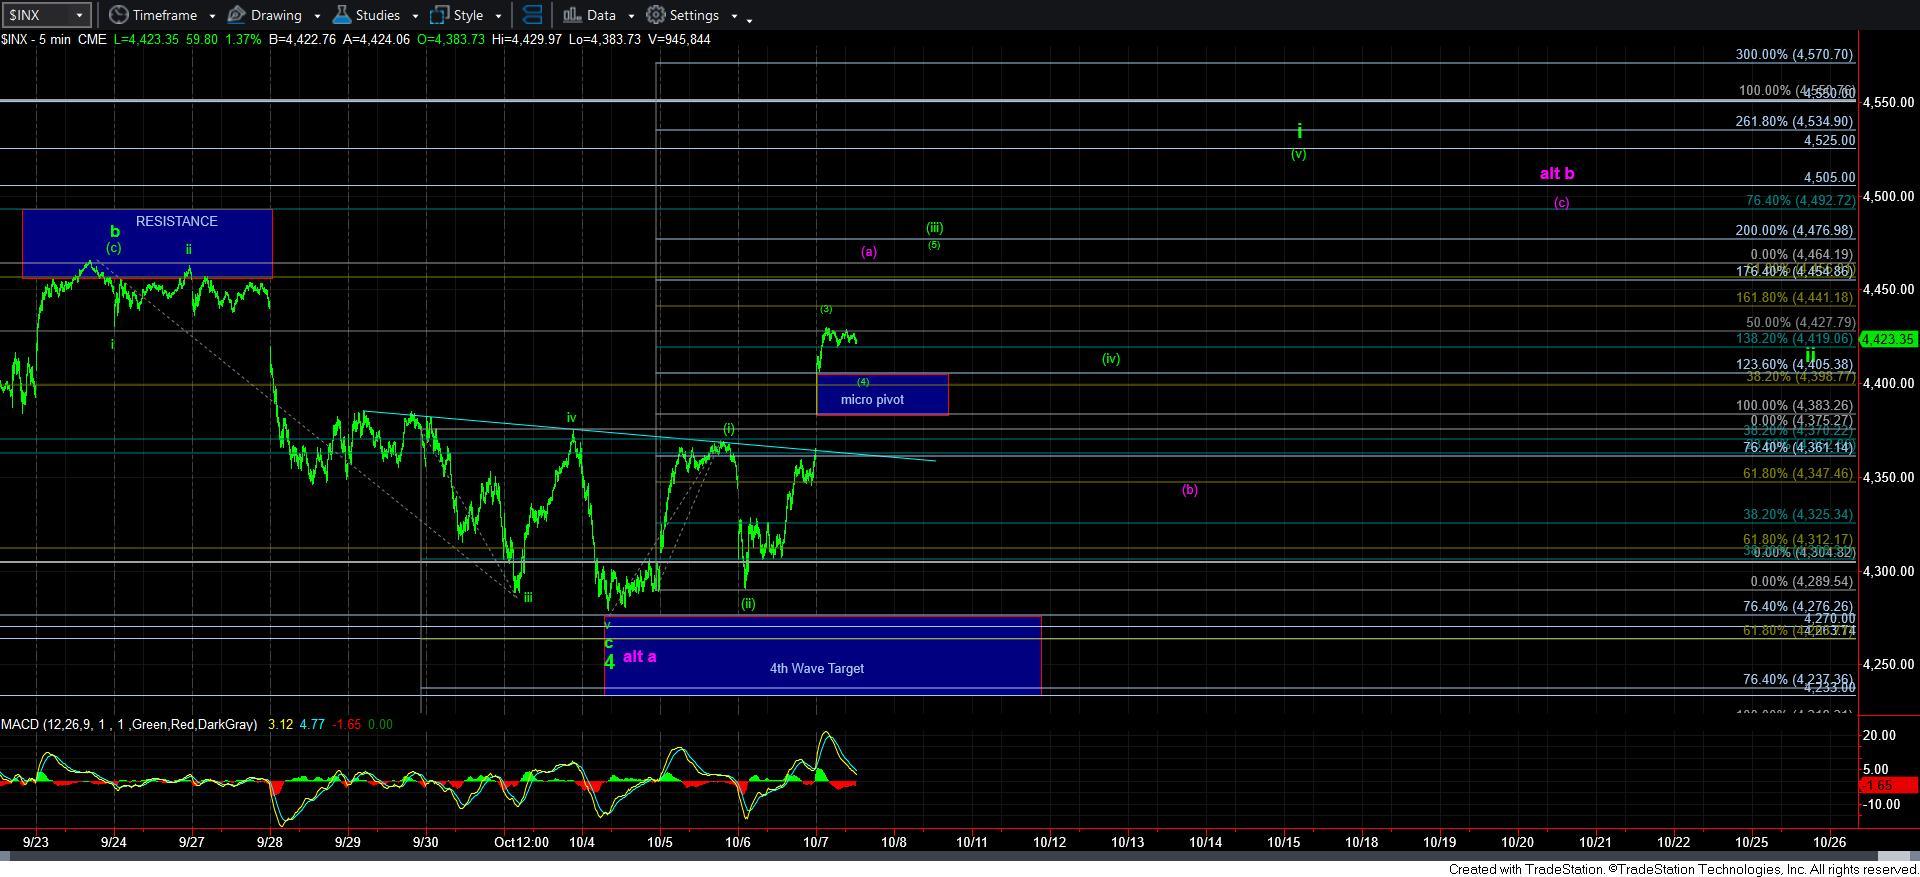
But, with the market now moving off the lows, it is at a point that it MUST follow through to the upside in a 5-wave structure. As it stands today, I am counting the current rally as wave [3] of [iii] within wave i. That means that the market should hold over the 4395SPX on any pullback here, and continue higher towards the 4455SPX region to complete wave [5] of [iii] of i.
And, of course, thereafter, we will need to see waves [iv] and [v] fill in as well, and complete wave i into next week. Should that occur, then wave ii is a very strong buying opportunity, and can pullback towards the 4400SPX region. That will likely be the last buying opportunity before the market begins the rally to 4900SPX in earnest.
Of course, we always have to maintain an eye towards risk management. And, we also have to have a plan in the event the market is unable to complete all 5 waves up. That brings me back to the alternative I have highlighted in purple on my charts. I have also added this potential to the 5-minute SPX chart as well.
In the event that we break a support in this attempt to complete 5-waves up, then I would have to strongly consider the potential that the purple count is taking shape. While I have added a potential path we can see for the b-wave in the purple count, I want to reiterate that trying to outline the path of a corrective structure is akin to throwing jello for distance. The main point you should consider is that if the market is unable to complete a 5-wave structure from this point forth, then it becomes much more likely that we will drop back down to the 4100-4165SPX region in the purple count.
For now, and for various reasons, I prefer the green count and am going to give the market the room to prove the next 5-wave structure. Should the market do so, then we will move into uber-bullish mode, and all pullbacks will be buying opportunities, especially the wave ii.
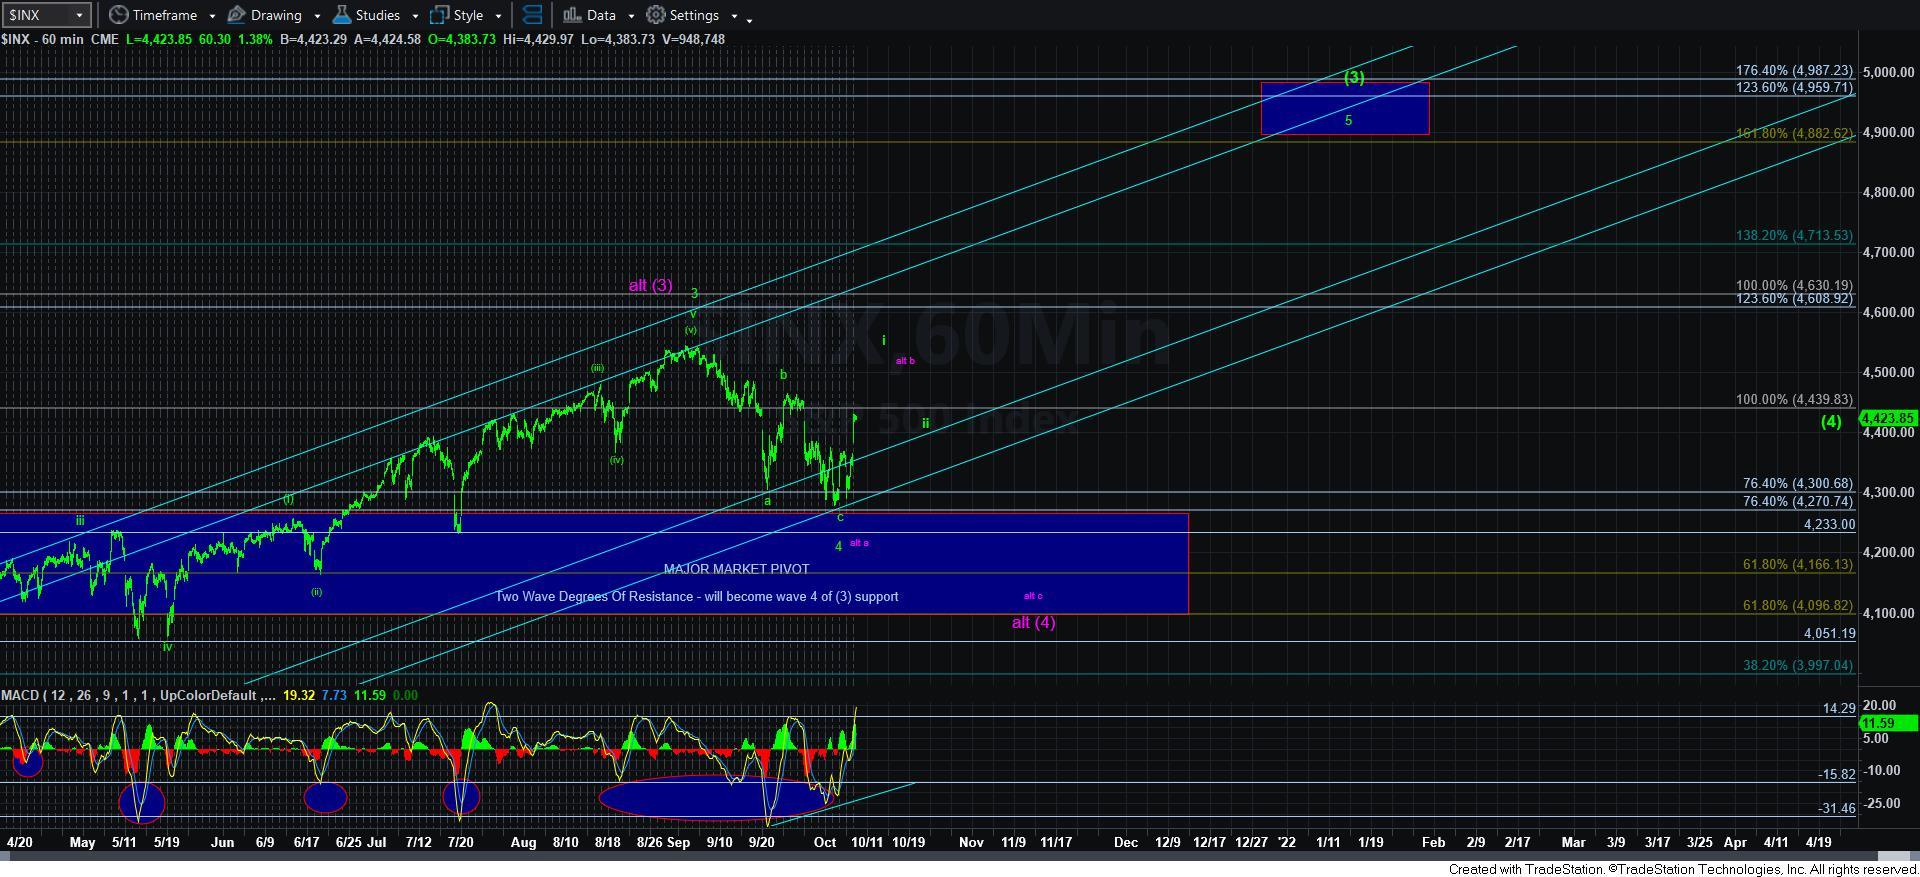
Until such time, I am afraid I am going to have to be a bit more cautious on the aggressively long side due to the nature of the current move off the lows. I am not wholly confident yet that this correction is done, and am going to just maintain a bit more caution until the market proves it to me by completing wave i of 5 of [3]. At that point, we can begin to turn more aggressively bullish.
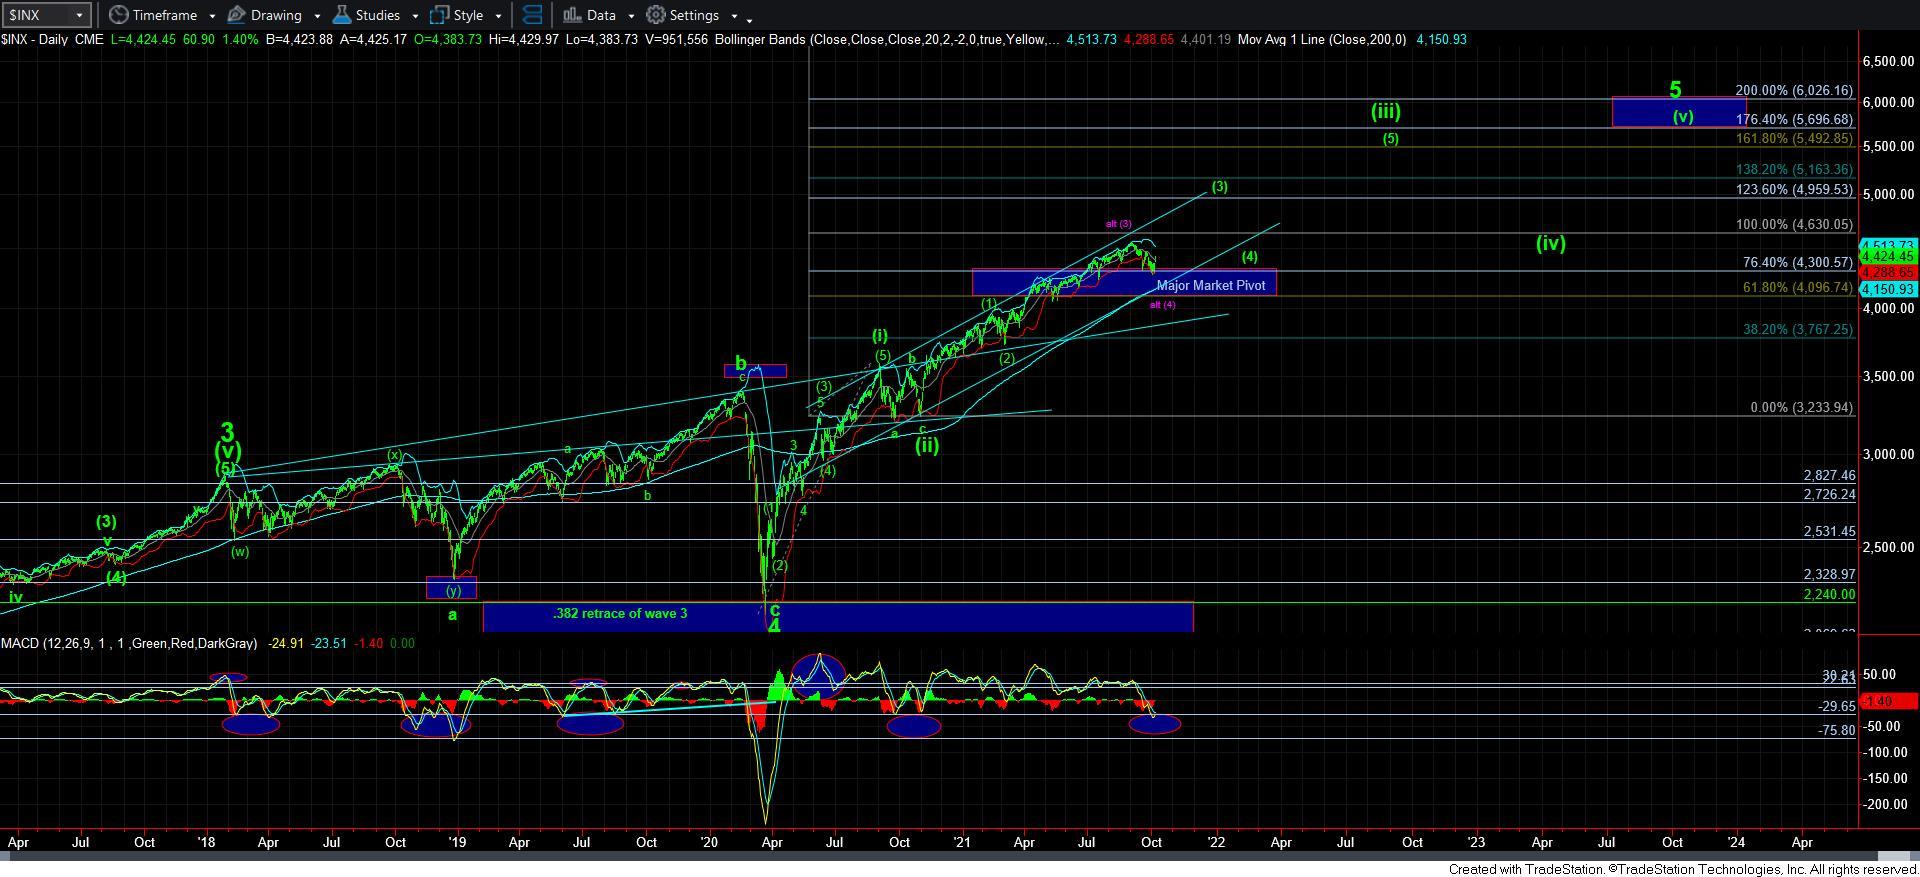
Lastly, I also want to remind you that in the event the purple count does play out, then the upside is no longer limited to 4900SPX. Rather, if we are one wave degree ahead of where I current believe we are now, then the next rally from the 4100SPX region will be pointing us to the 5160-5500SPX region to complete wave [5] of [iii] off the March 2020 low.
For now, I am giving the bulls the opportunity to prove we have begun the rally to 4900SPX. And, I am going to curtail any feelings of FOMO (fear of missing out), since I understand that once all 5 waves of wave i completes, then we should see a wave ii retracement back towards the 4400SPX region, which is basically where we are today.
As I have said many times before, the only analysis I know of which can provide us market context in this manner is Elliott Wave analysis. This allows us to understand that the market will not likely be running away from us at this point, as it will likely provide us with one more buying opportunity in the current region in which we now reside – that is, once the market proves it will complete 5 waves up from here. So, if you did not buy all you wanted to buy as we were hitting support below, you will have one more opportunity in a wave ii in the more immediate bullish case scenario in the region we now find ourselves within today. So, I do not think this is the place to force any news positions just yet. Of course, this is just my humble opinion based upon what I am seeing in the current structure, while considering risk management.