Divergences Building - Market Analysis for Jul 21st, 2025
 By
By
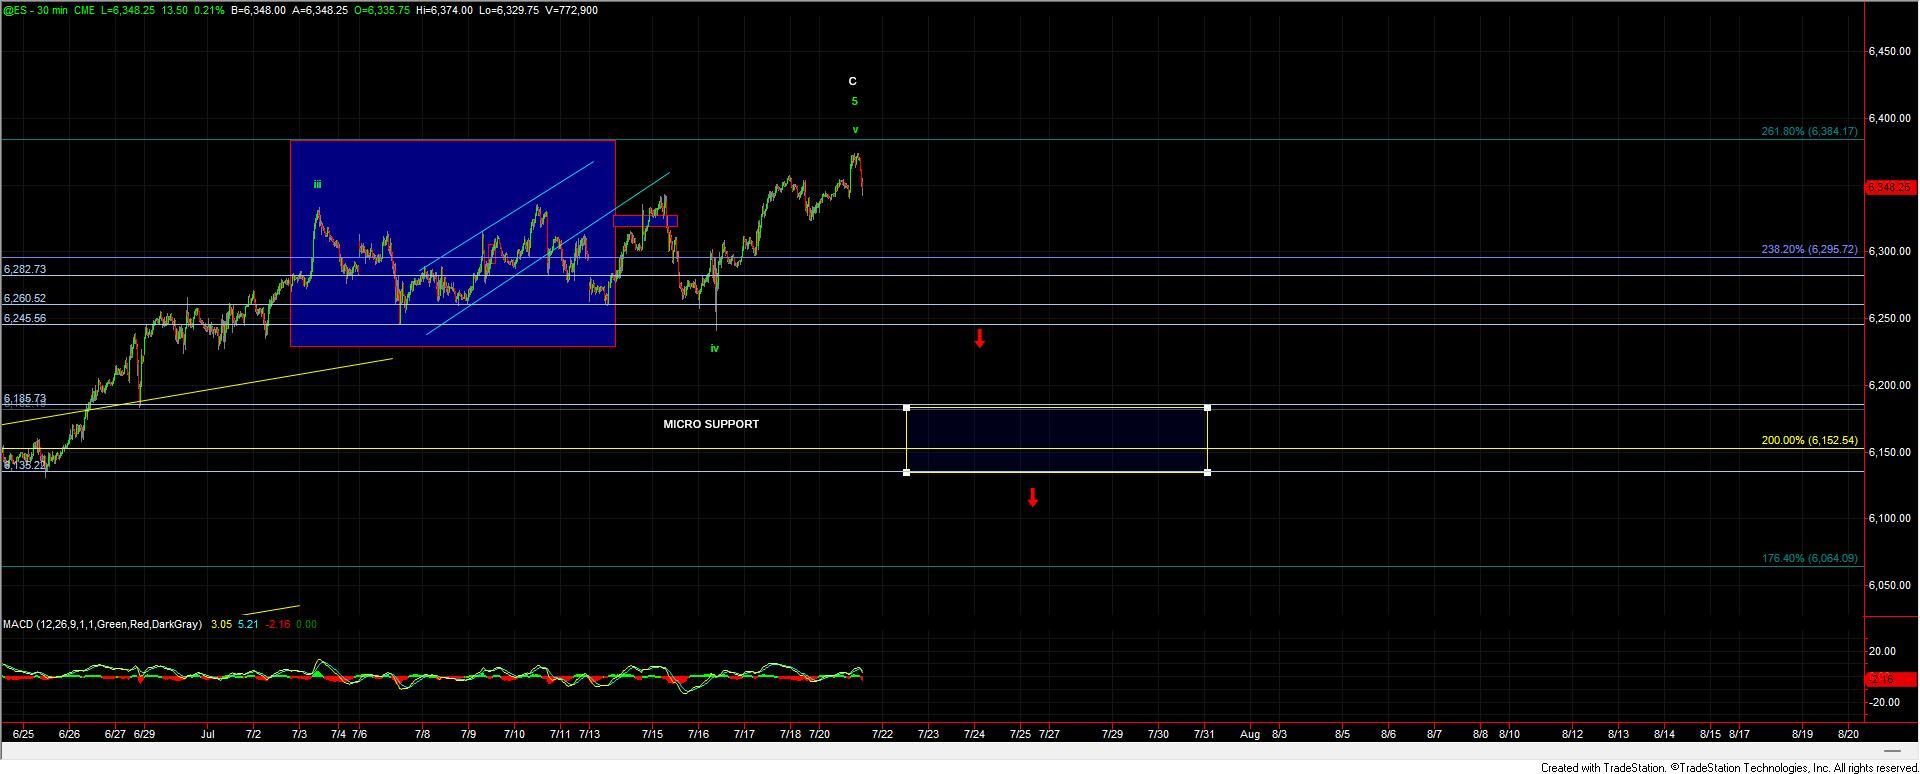
Today, we saw the market push higher toward the 261.8% extension I outlined last week, only to reverse lower during the final hour of trading. Despite that pullback, price remains well above even the uppermost support level on the ES chart. From both a price and structural standpoint, we still do not have confirmation that even a local top has been struck in ES.
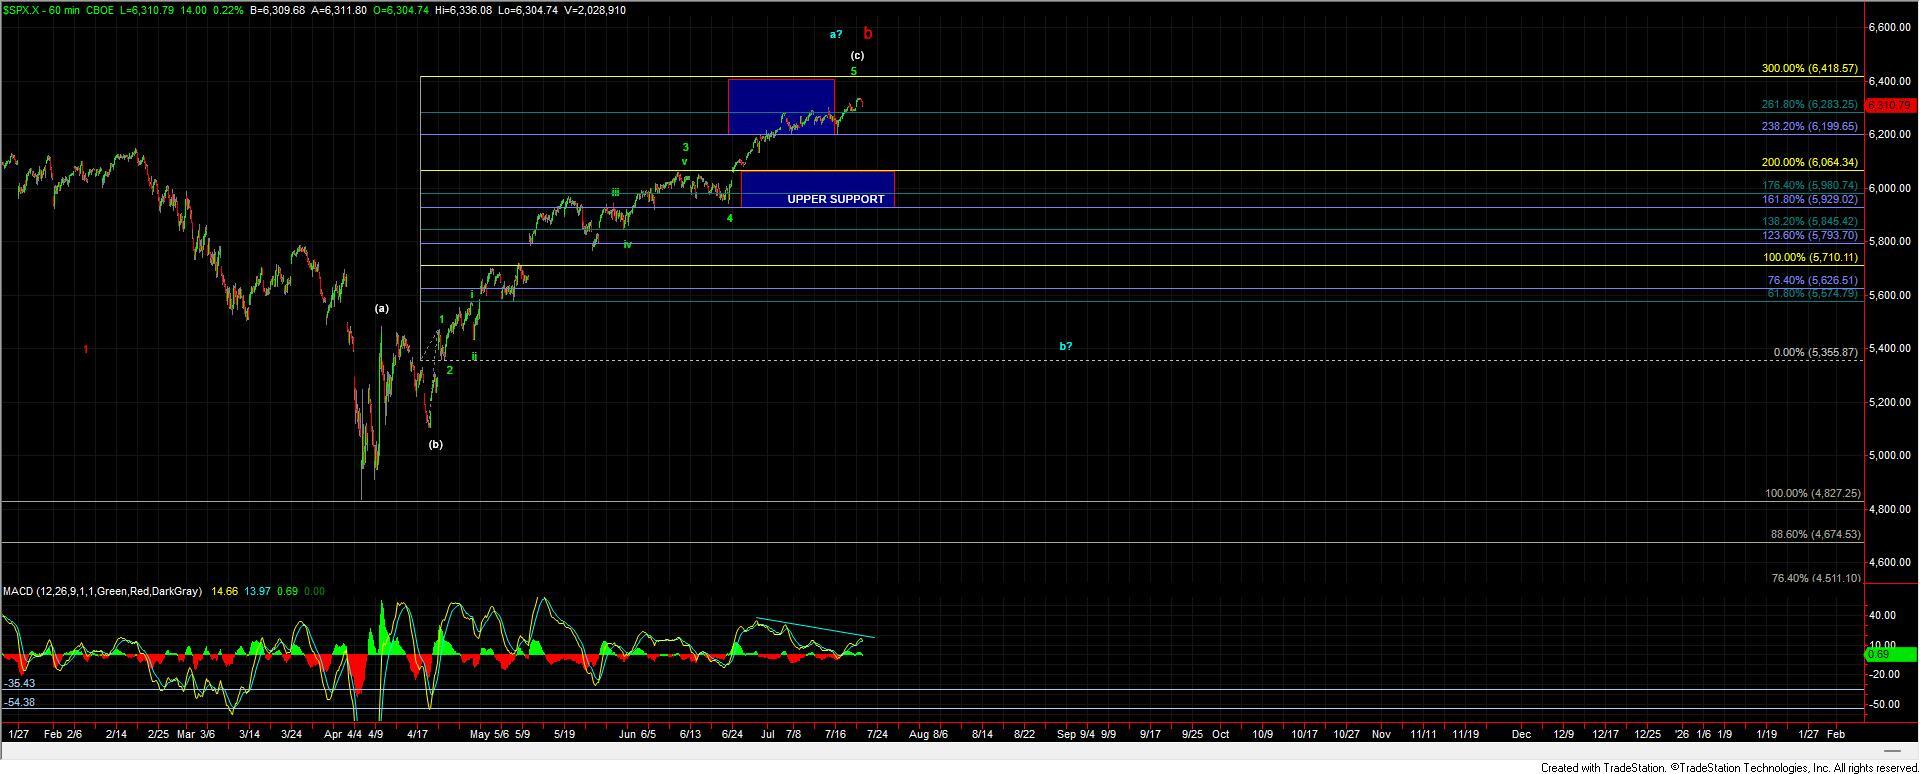
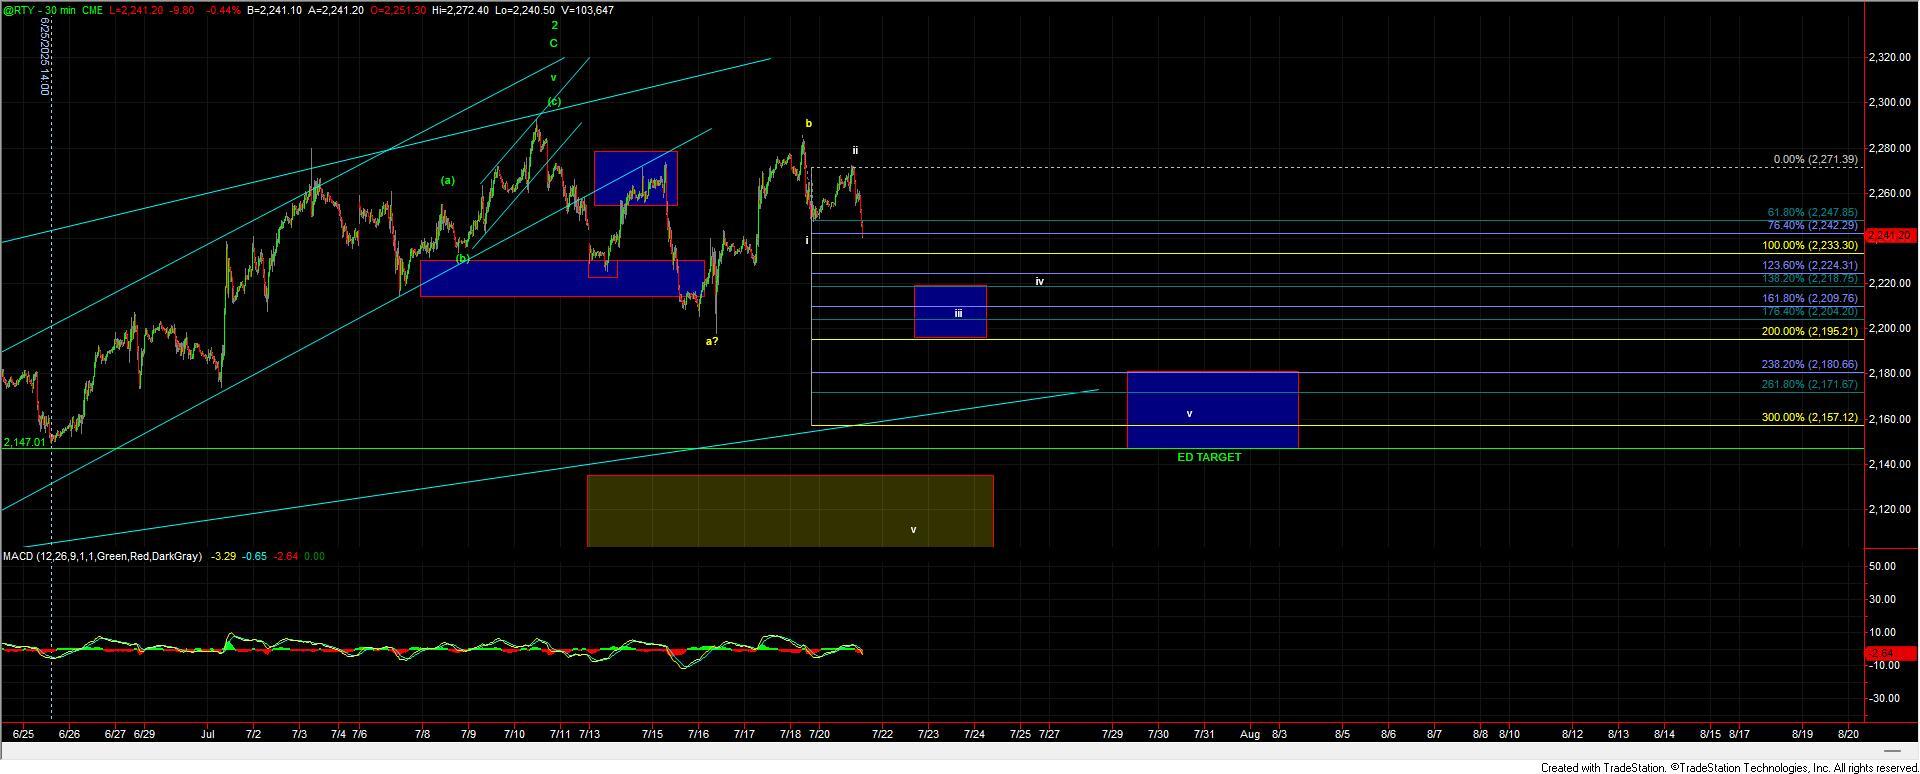
However, the Russell 2000 is telling a slightly different story. After printing a clean initial five-wave decline last week, RUT retraced higher in a corrective fashion and is now turning lower again. This divergence between ES and RUT, particularly with how full and extended the ES count has become and the negative divergence that is developing on the MACD on the SPX chart itself, yet more warning sign that we’re likely getting closer to an ultimate top.
That said, we still need to respect the price action. Until ES breaks key support, we cannot rule out the potential for further upside extension. The market has a way of grinding higher longer than many expect.
The levels I highlighted last week remain unchanged. On ES, I’m still watching the 6,245 level as the first indication of a potential local top, with the 6,185–6,135 zone as the more meaningful pivot below. A break of that support would shift focus to the larger-degree support zone on the SPX, which continues to come in at 6,064–5,929.
As always, we’ll need to see confirmation through price and structure before making any firm calls on a top, but I am not ignoring the divergences here.