Divergence Forming, But Still Holding Over Support... for Now
 By
By
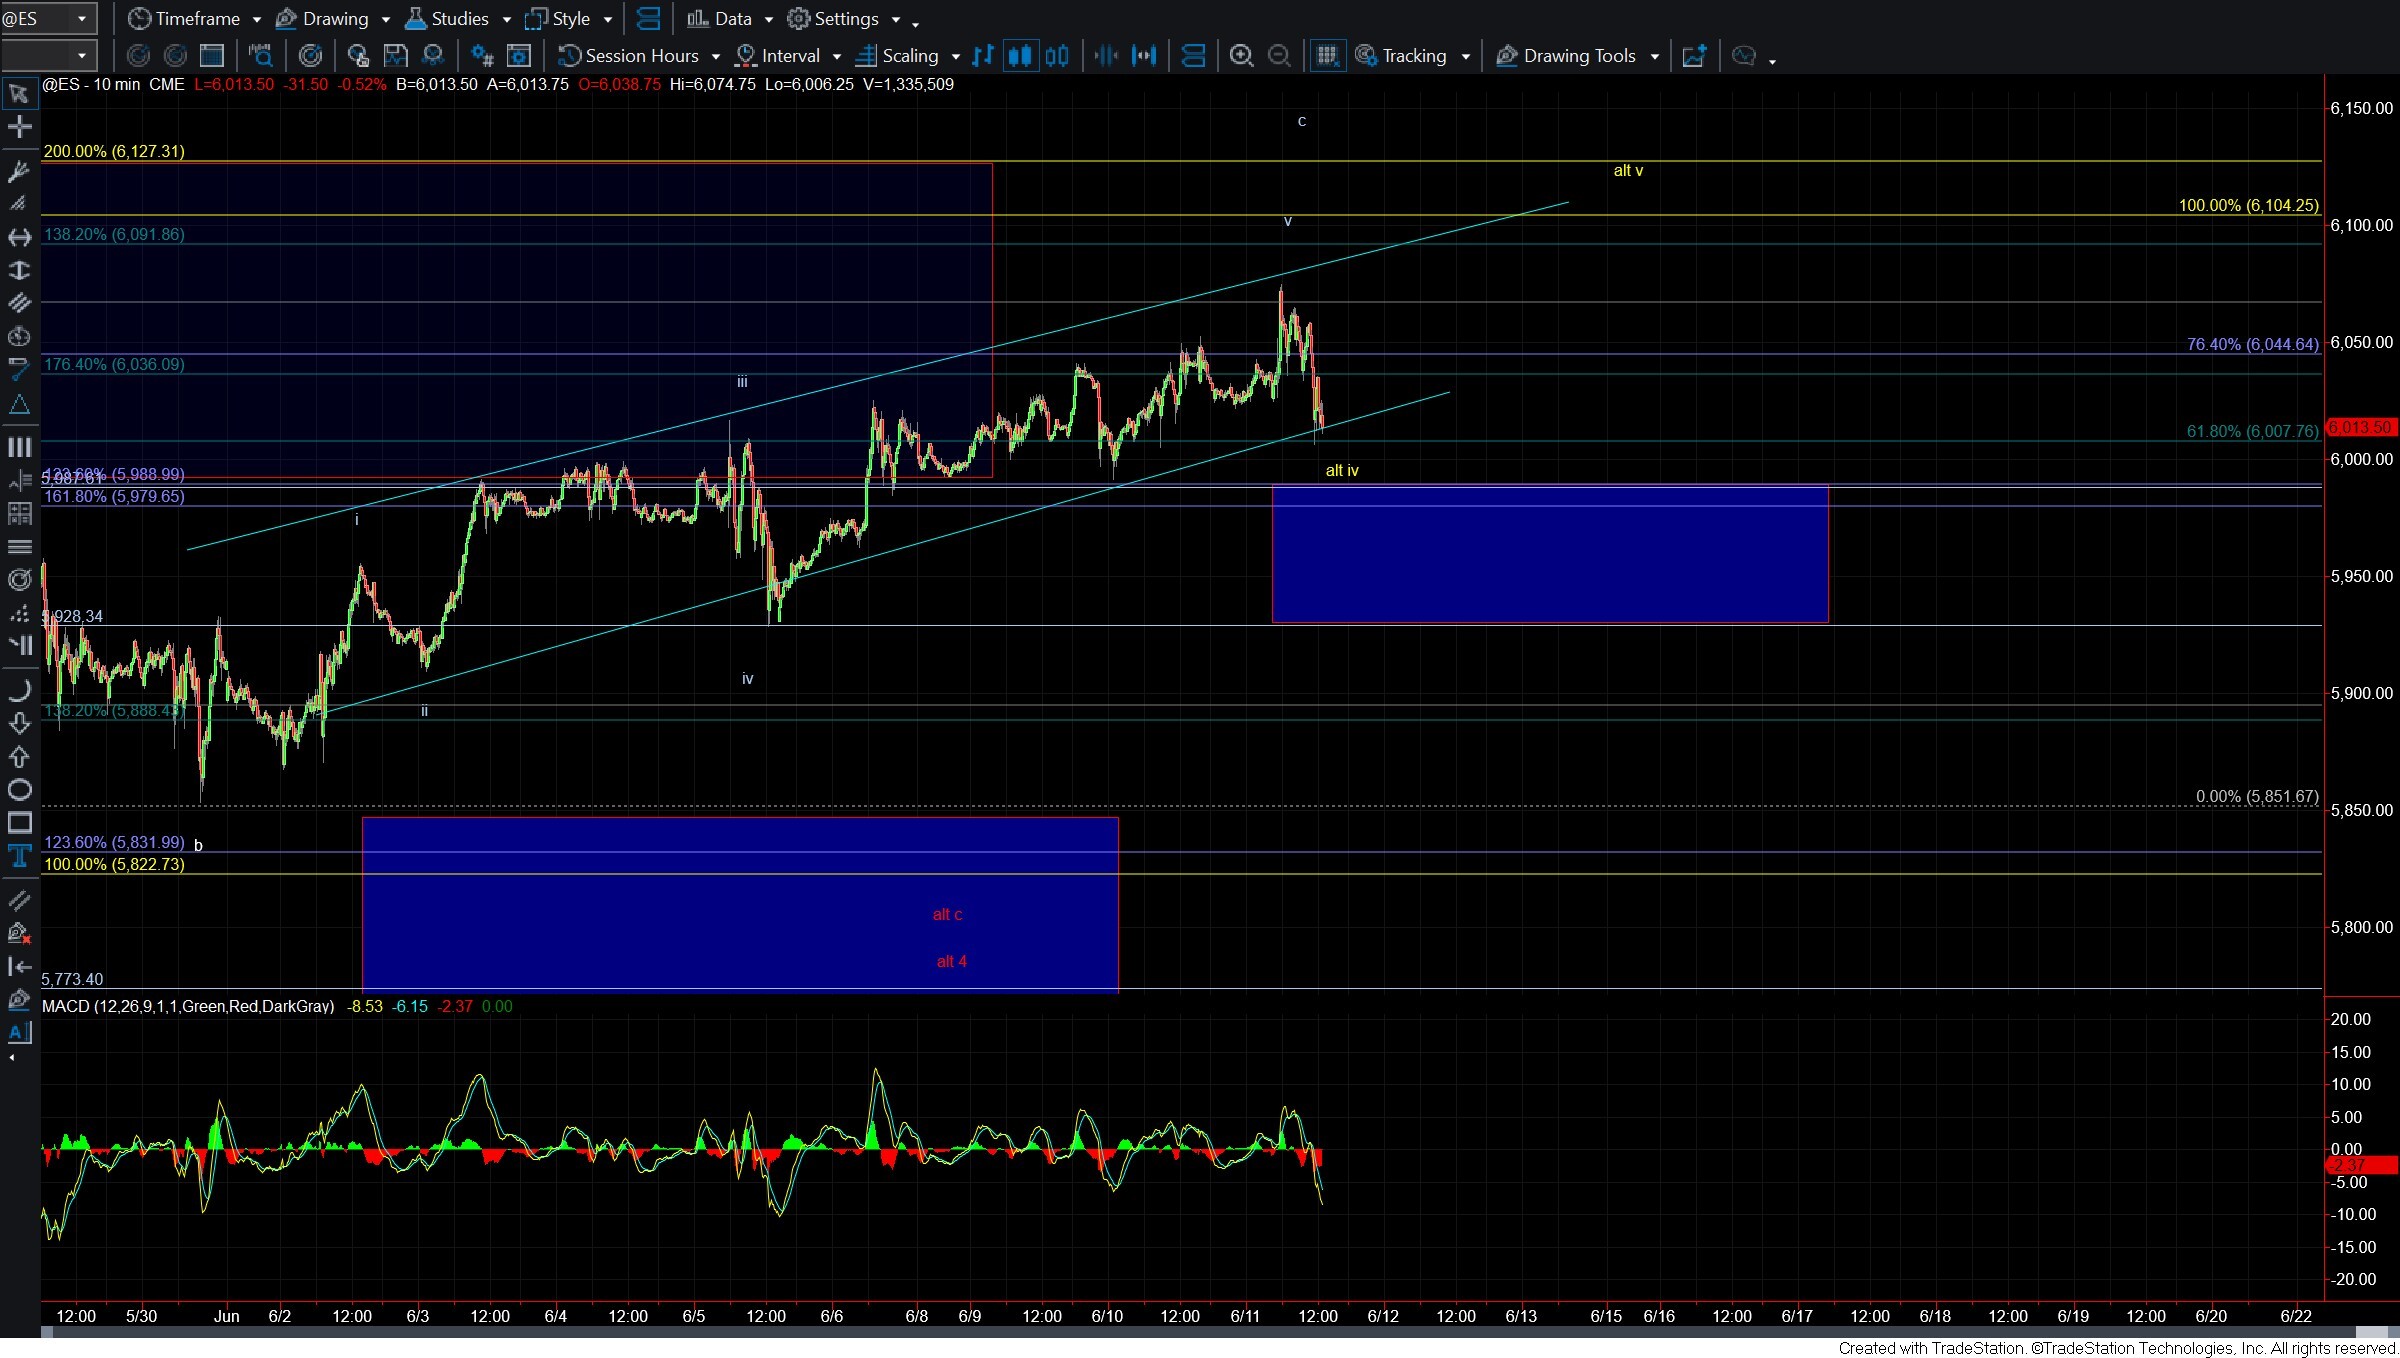
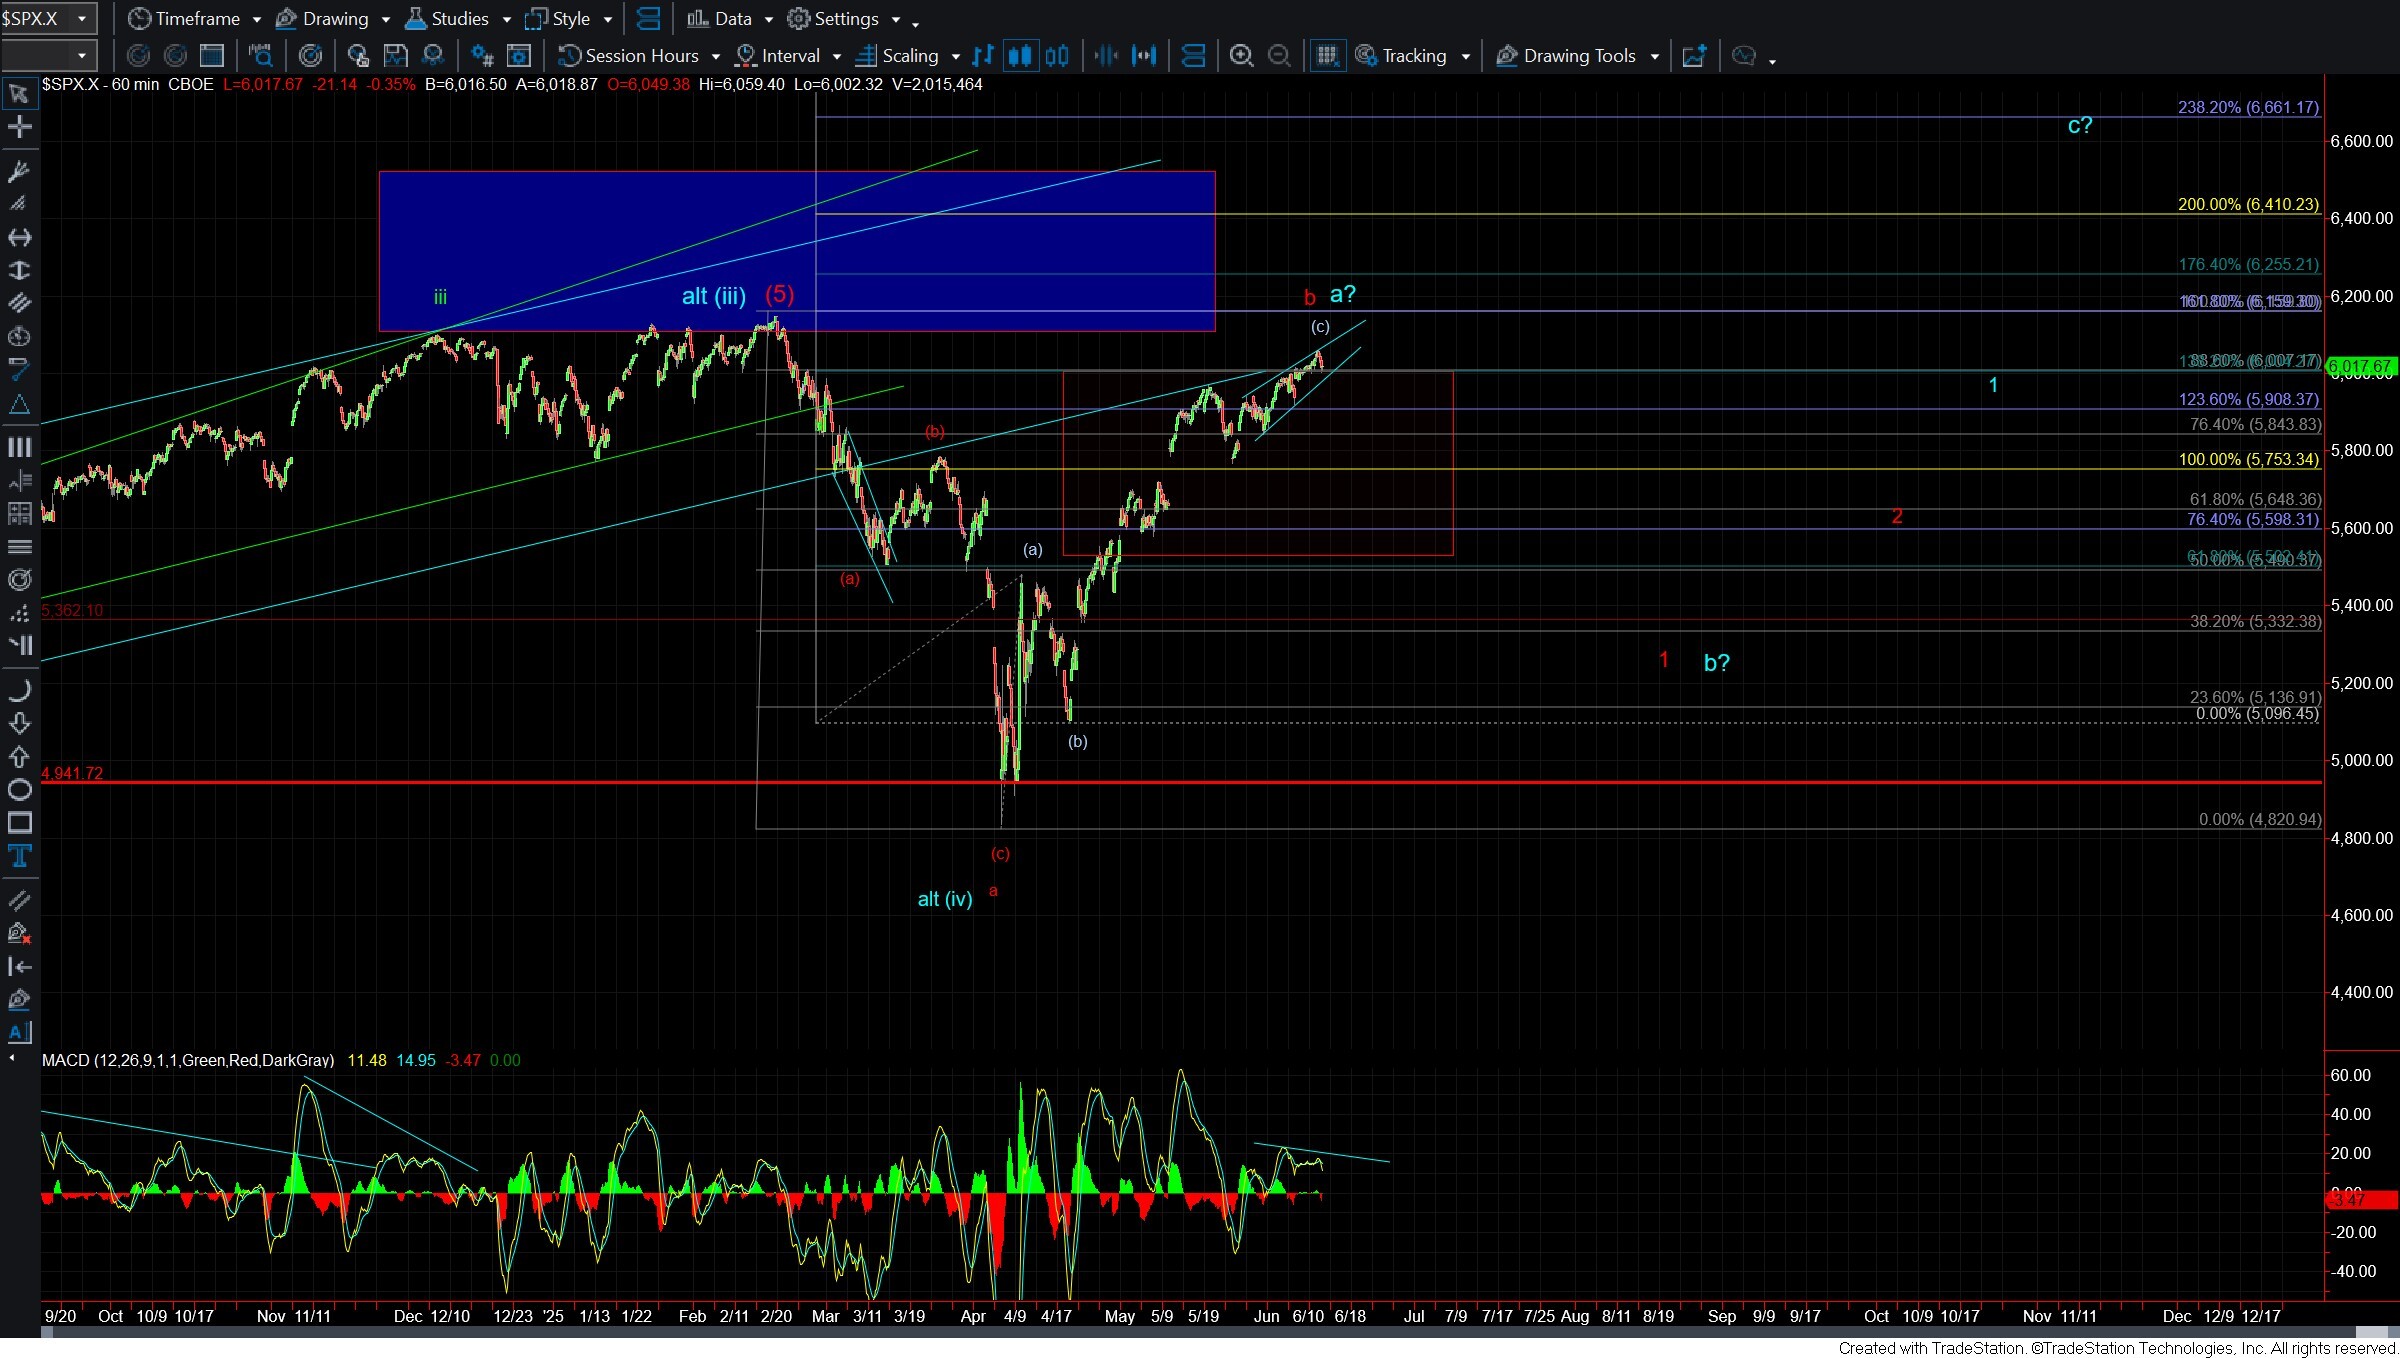
Since the low struck on May 23rd, the market has been grinding its way higher in a very choppy and overlapping fashion. This type of price action is characteristic of an Ending Diagonal (ED), and it suggests that we may be completing wave (c) of a structure that began back in April.
Adding to this setup, we’re starting to see negative divergence forming on the 60-minute MACD, a common feature when an ED pattern is nearing completion. That said, we’re still trading above key support, so while all the ingredients for a reversal are in place, we do not yet have even initial confirmation that a top is in. A break of support is still needed to validate that view.
Zooming into the ES chart, I can count a full and potentially complete ED pattern off the 5851 low. If this ED has indeed topped, we should expect a sharp reversal back toward the origin of the pattern, again, that 5851 level. To confirm this, we’ll need to see a sustained break below the 5987–5929 support zone. A move through that region would offer an initial signal that a top is in place.
However, if price action holds within that zone and turns back up, taking out today’s high, then I would count today's low as wave iv of the ED, shown in yellow on the chart.
Now, while the ED in ES begins off the May 30th low at 5851, the SPX is showing a slightly different structure. There, I can make the case that the ED actually began from the May 23rd low. So if we do start to break down, I’ll be watching both of those levels closely. I likely won’t have full clarity on which is correct until we see how the price action unfolds on the downside.
Bottom line: For now, my focus remains on the upper support zone in ES between 5987 and 5929. If that level gives way, we should see a fairly sharp move back to at least the May 30th low, with a reasonable probability of follow-through to the May 23rd low—if that proves to be the true origin of this Ending Diagonal.