Direct Rally To Upper Resistance
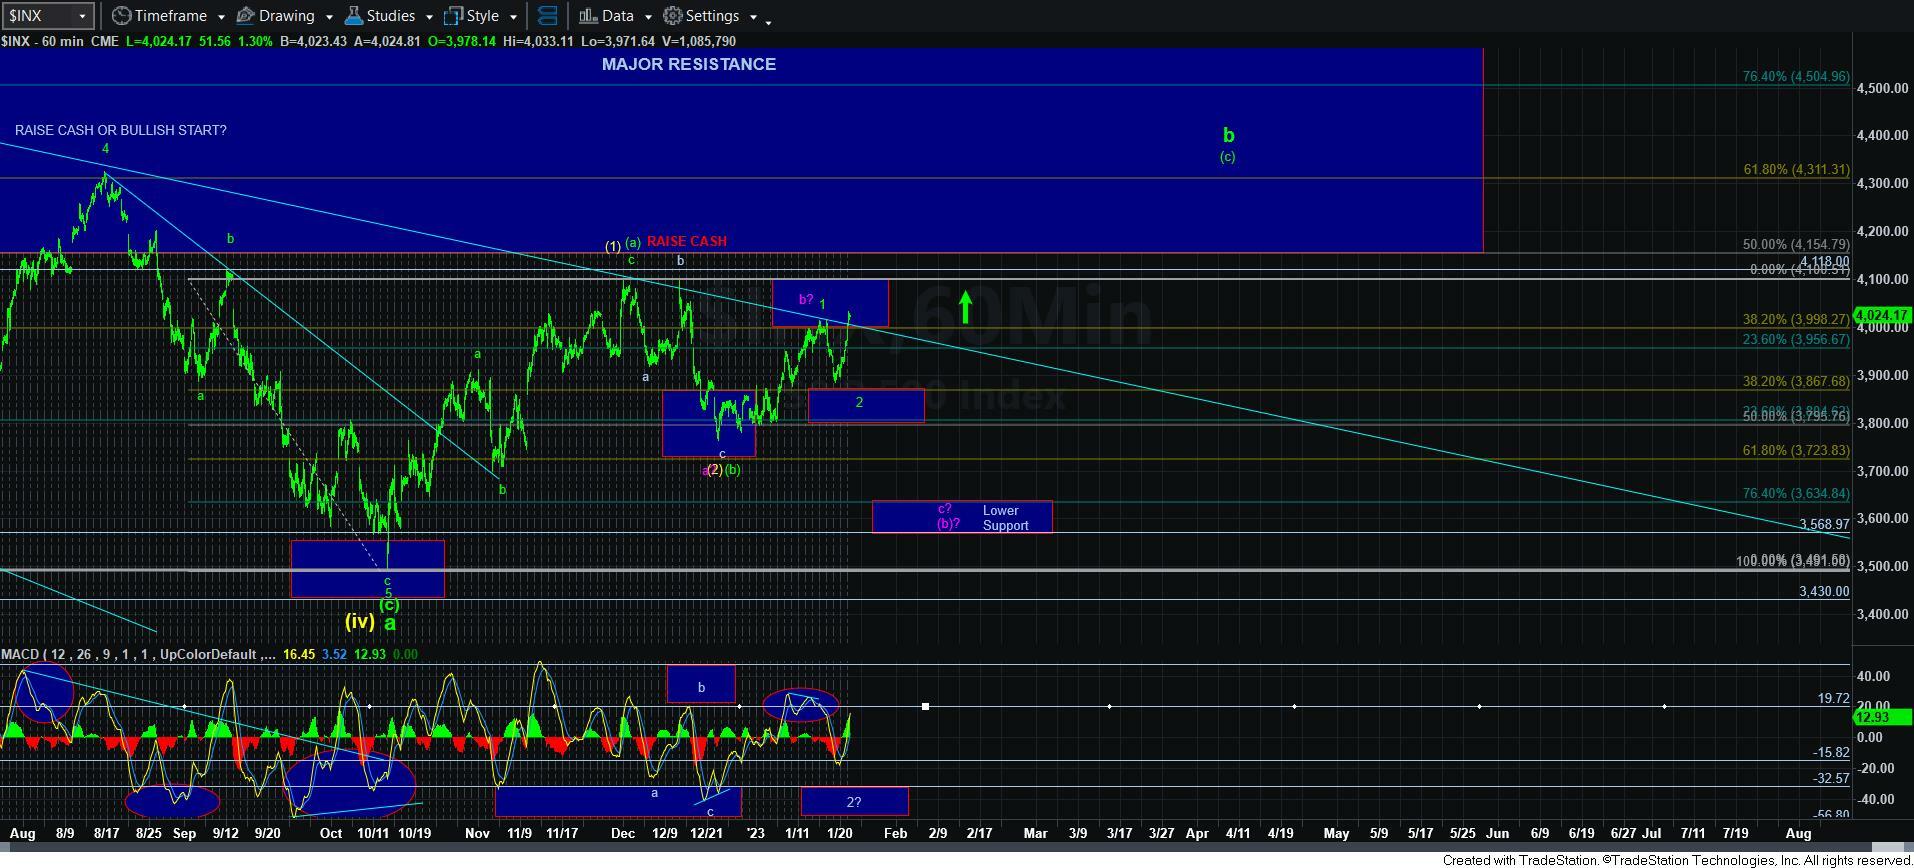
Today was quite a showing by the bulls. Not only did we take a direct route to the upper resistance overhead on the 5-minute chart, we seem to have broken out of the declining trend channel on the 60-minute chart, which has kept us in check since the market top struck in late December of 2021. So, again, quite a showing by the bulls. Yet, not completely unexpected.
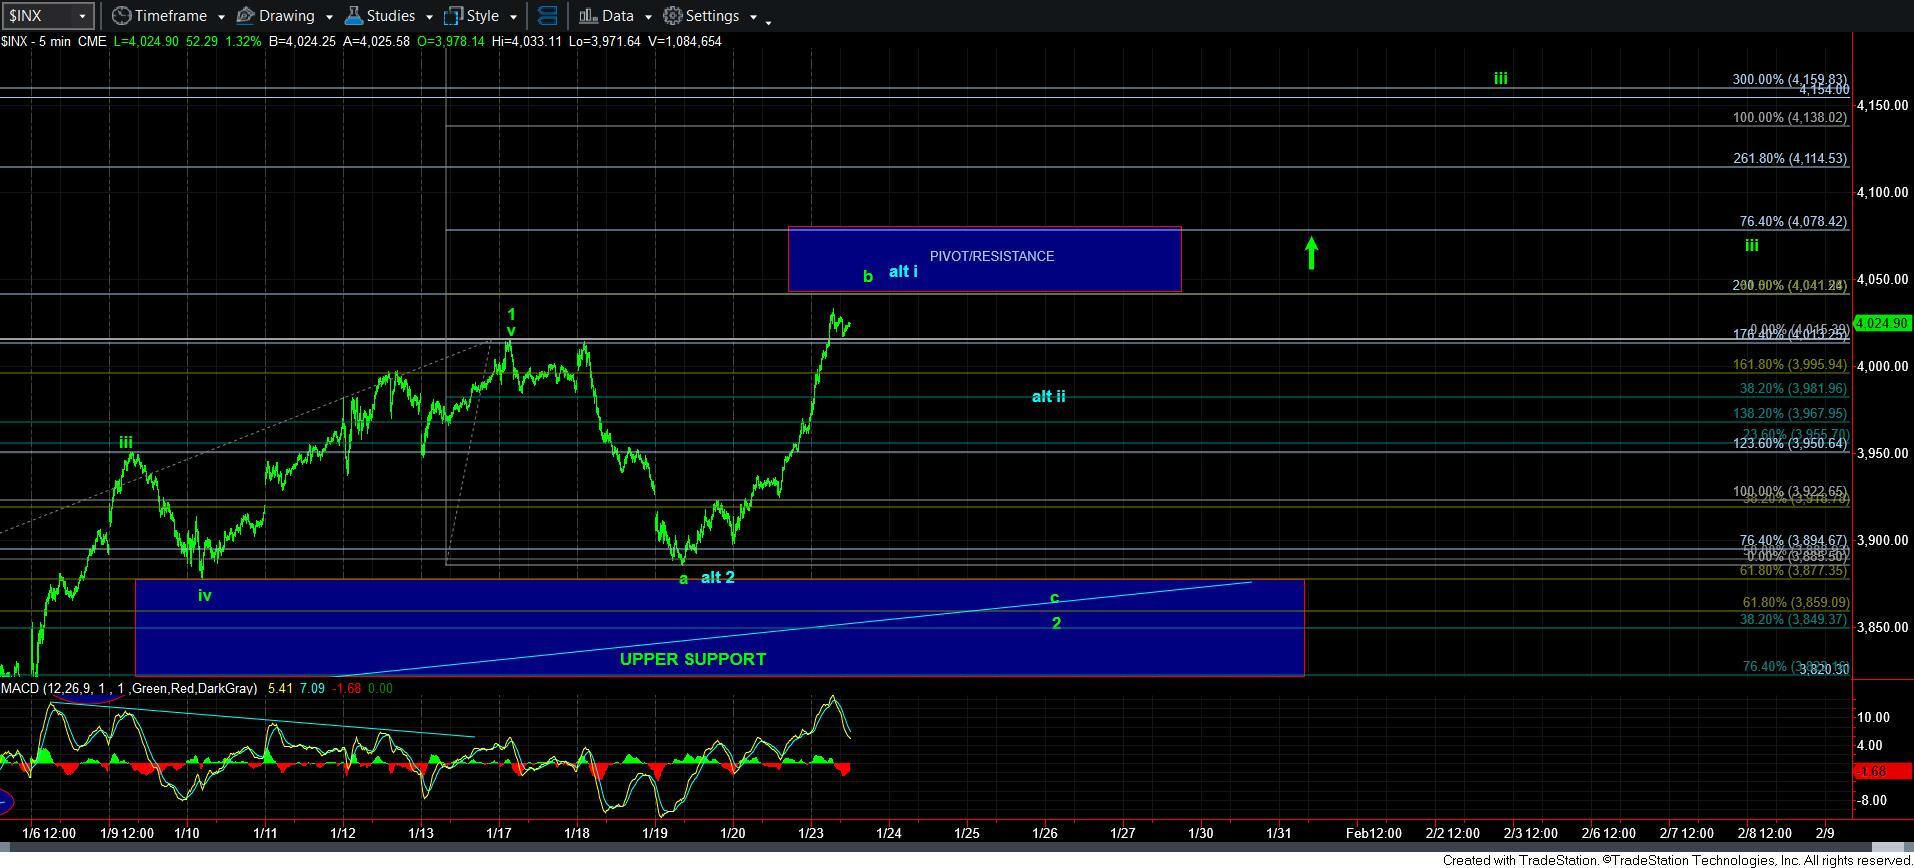
What is a bit unexpected is the direct move to this resistance, which is not what I initially expected. So, rather than viewing this as a wave v (which should have taken a clear a-b-c structure to this resistance), this seems to more resemble an impulsive structure, which still has a few squiggles left to complete. But, should it do so in the coming days, then it would signal that wave 2 may have indeed completed at the last pullback low, even though the 60-minute MACD did not provide me the ideal re-set I wanted to see.
But, we are clearly not there just yet. In fact, this can still be an expanded b-wave rally, with a c-wave down still to come in wave 2, and I am maintaining that as my primary count for now.
There are two things that will change that primary count. First, if the next pullback is CLEARLY corrective. Then I will have to view that as a wave ii of wave 3, and a break out over the high we strike for wave i of 3 will signal that we are likely in the heart of wave iii of 3, and likely on our way to 4300+.
The other thing that would have me consider changing my count is if we see a DIRECT break out through the pivot/resistance box on the 5-minute SPX chart. This is not my expectation, but I have to respect price if it does so. A direct break out would suggest we are already in wave iii of 3. Again, this is not my expectation at this time, but I have to abide by price action first and foremost, even though a standard expectation would be for more of a pullback.
So, the question then is if we take a more immediate bullish path, where do you add long positions? Well, if we do see a corrective wave ii, you can add another 25-50% there, with stops below last week’s low. You can add another 25-50% on a break out over the high of wave i after a wave ii pullback. Or you can add on a break-out through the pivot, and put stops just below the pivot. Again, there is no one "right" way. It is all based upon your personal risk tolerance.
As far as targeting is concerned, if wave 2 is indeed complete, then the minimum expectation I would have for the c-wave is the 4330SPX region, which is the 1.764 extension of waves 1-2 in the [c] wave. That still leaves over 6% of upside over the pivot, and that is assuming the lowest potential target I can foresee, as we can clearly extend to 4390 (2.00 extension of waves 1-2), or even higher.
For now, I still maintain my expectation for 4300+. However, I am still not certain regarding the smaller degree the path we take there. The action this week will likely settle that question. And, once we have a solid Fibonacci Pinball 1-2 structure in place upon which we can rely, the rest of the path will likely be much easier. In fact, it will likely be the easiest path we have seen in the market for over a year now.