Direct Or Indirect Route?
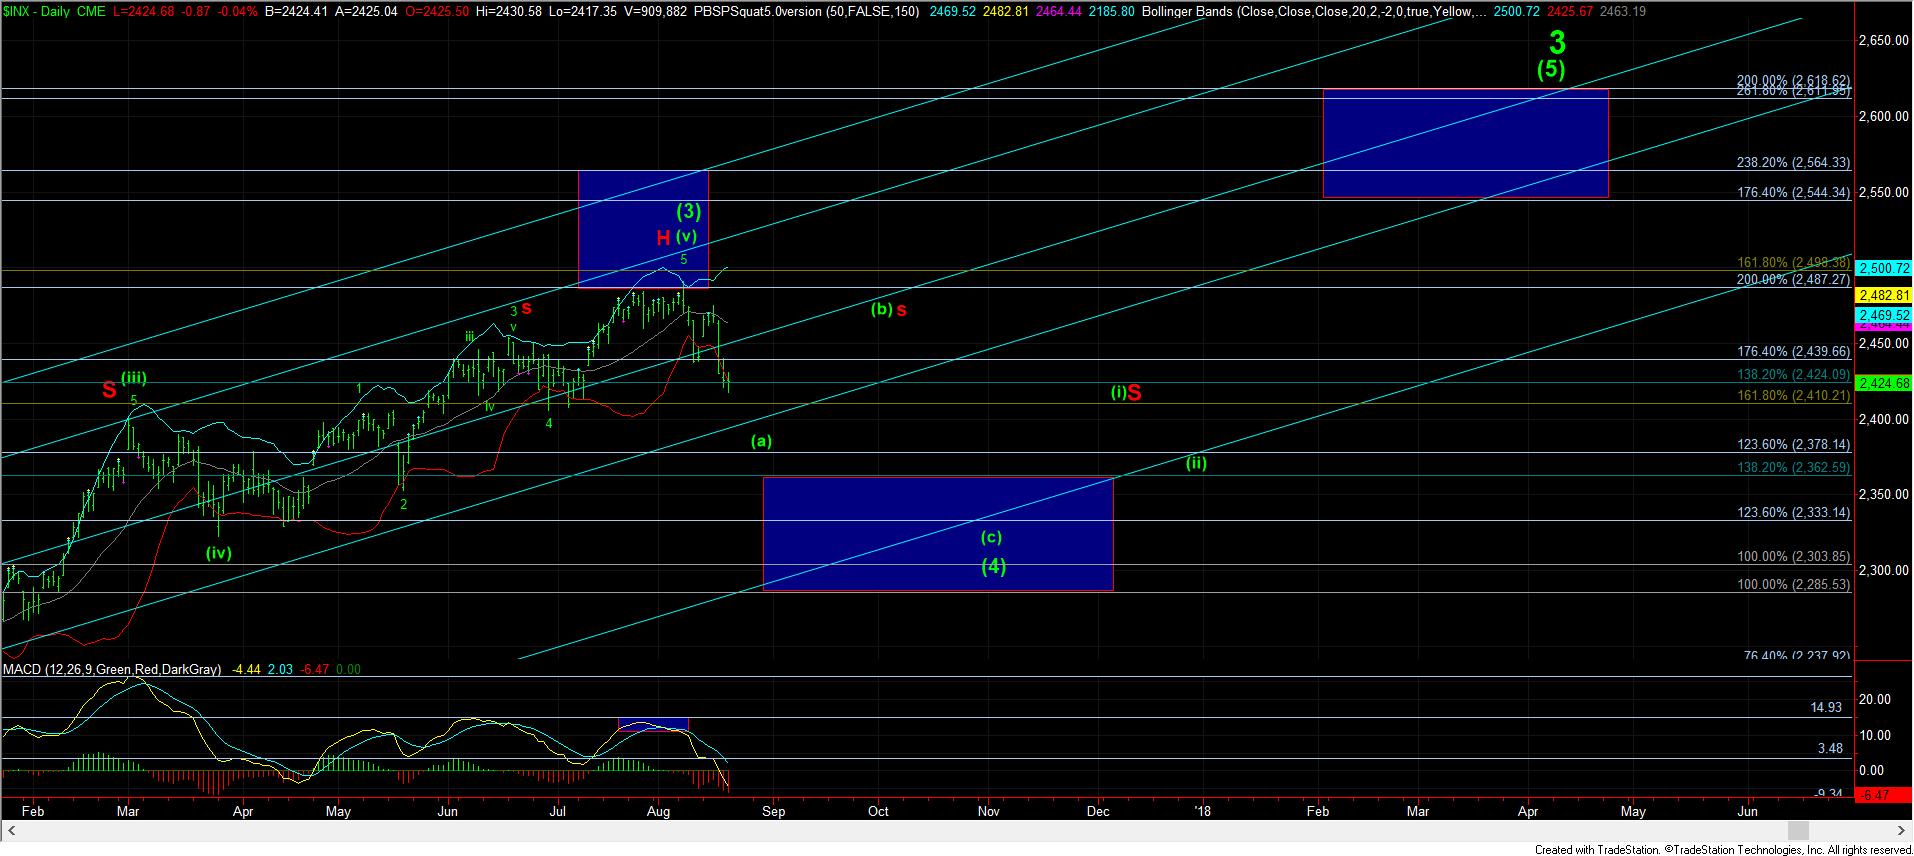
This afternoon, I am going to provide a bit more color into 4th waves. Let’s start with the fact that 4th waves often develop with an (a)-(b)-(c) structure. Moreover, based upon the standards I have seen over the years, the (a) wave most often targets the .236 retracement of wave (3), whereas the (c) wave often targets the .382 retracement of wave (3), which also coincides with the 1.00 extension off the lows in our Fibonacci Pinball structure.
In our case, it means that standard retracements would target the 2370 region for the (a) wave of (4), whereas the .382 retracement and 1.00 extension off the February 2016 lows point down towards the 2285/2300 region.
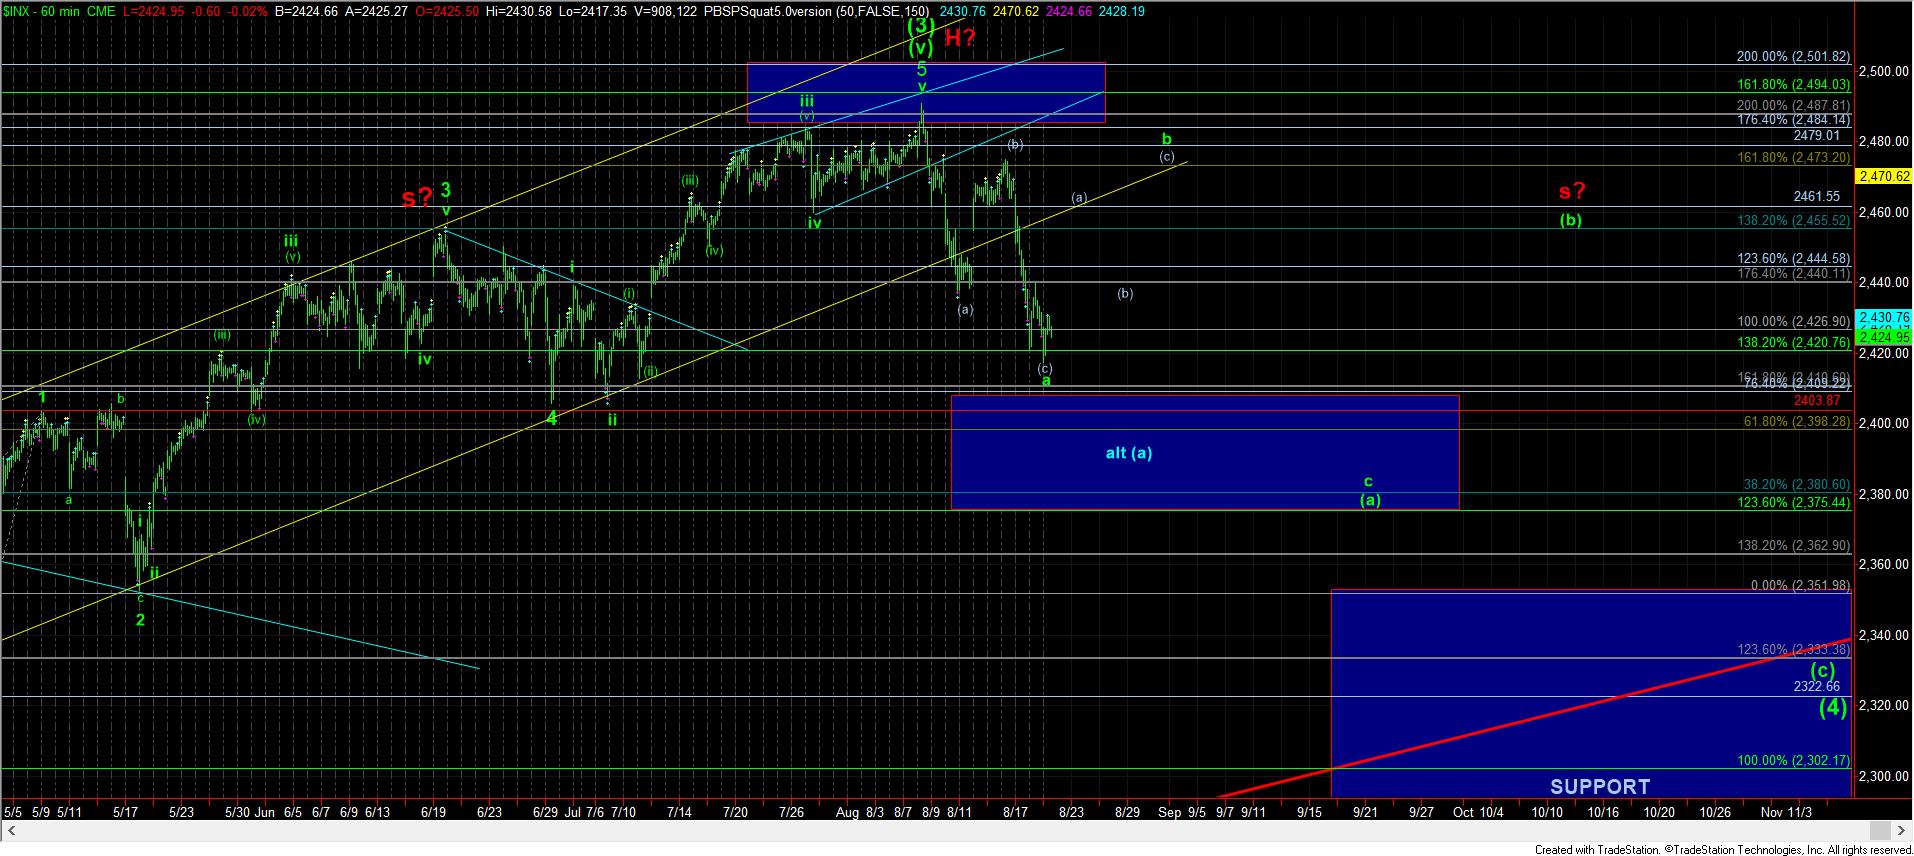
That being said, I am questioning whether we will actually drop that low in this wave (4). Based upon what I have seen so far, it would seem that market may be trying to reach for the 4th wave of one lesser degree for the (a) wave, which is in the 2400SPX region, with the (c) wave potentially looking for the region between the 2nd wave of the prior 5 wave structure (2350SPX region) up to the .236 retracement of wave (3) in the 2370SPX region. So, my minimum ideal target for this entire pullback really should be the 2350-2370SPX region, which is in the .236 retracement region of wave (3).
Furthermore, Elliott set forth the rule of alternation, which suggests that waves (2) and (4) of the same wave degree will USUALLY alternate in timing and/or structure. Since wave (2) only took us 3 weeks, my expectation has been that this wave (4) should take us months, and may even take the shape of the triangle. In fact, I would not be surprised if this pullback took us into November, and potentially into the Thanksgiving time period. But, Elliott’s rule of alternation was more of a “guideline” than an actual steadfast rule.
This leads me to several “expectations” I would like to maintain. First, I would like to “expect” that the (a) wave of (4) AT LEAST strike the top of the middle blue box I have on the 60-minute chart. Therefore, until we strike the 2400 region, I may have to assume the larger degree a-b-c structure in the (a) wave alone, as presented on my 60-minute chart.
But, I want to warn you well ahead of time that should the green count play out as outlined on the 60-minute chart, my alternative at the time of us striking the target for the green (a) wave next month will maintain that low as ALL of wave (4). For this reason, I will likely be buying stocks that are on the “shopping” list I will be developing. At that point, I will be watching the rally off that region to determine if we see a 5-wave structure, which would be our first clue that wave (4) will be exceptionally shallow, or if the 4th wave will continue into the November time frame. But, that is still about two months away before we can make sure determinations.
And, in the alternative, should the market continue lower in the coming days for a direct drop in the (a) wave, it would increase the probabilities that this wave (4) may complete by late September, or even early October, unless, of course, it turns into a triangle.
So, as you can see, whereas we have strong targeting parameters when we are in an impulsive structure, corrective structures have to keep us on our toes ALL the time, or else the bull market can get away from us. And, I don’t know about you, but I don’t want to miss the rally to 2600+ in the SPX.
Lastly, I want to remind you that all rallies from this point forth “should” maintain below the 2465-80SPX resistance region, or else we may see higher highs, for which I consider the probabilities at 15-20% at this point in time.