Did The Bulls Fail To Break Out?
The bulls had an ideal set up to break us out over the 2900 line and extend us to the 3060SPX region thereafter. While the market gapped up over 2900, it clearly could not hold that break out, which is clearly concerning from the bullish perspective.
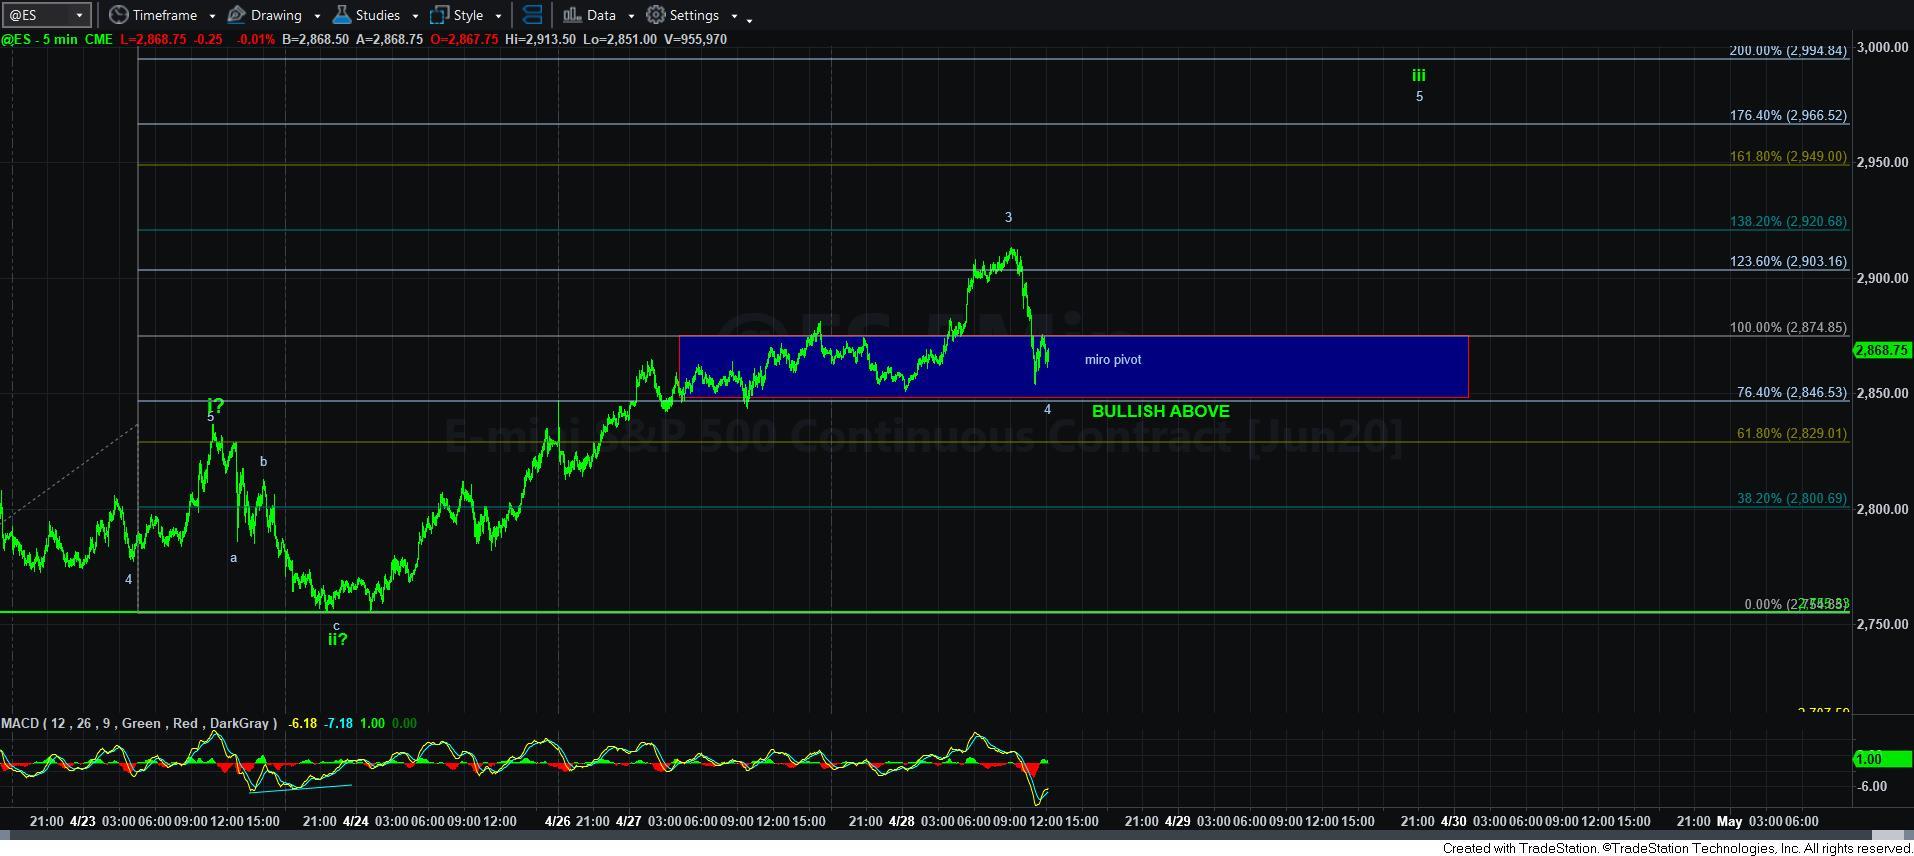
As I highlighted yesterday’s afternoon, the micro structure has been a bit different between the ES and SPX. Moreover, as I highlighted yesterday as well, as long as the ES remains over 2829ES, we have a bullish structure in place. Not much has changed in both those points.
I still do not have a strong micro count upon which I can rely since the SPX and the ES present a bit differently. But, as long as the ES now remains over the 2846ES level, then I can still maintain an immediate bullish perspective. Should we continue to hold that level, then I am looking to target at least the 2950ES region next.
But, clearly, this action has caused me a bit of concern. So, while the market is still near the highs, I wanted to post an update to the entire membership to reiterate something I posted in the trading room within the last hour.
This is the point in time that you must take stock of the type of trader/investor that you are. If you are a short term trader, then you have levels that we are providing which outline the turning points in the market.
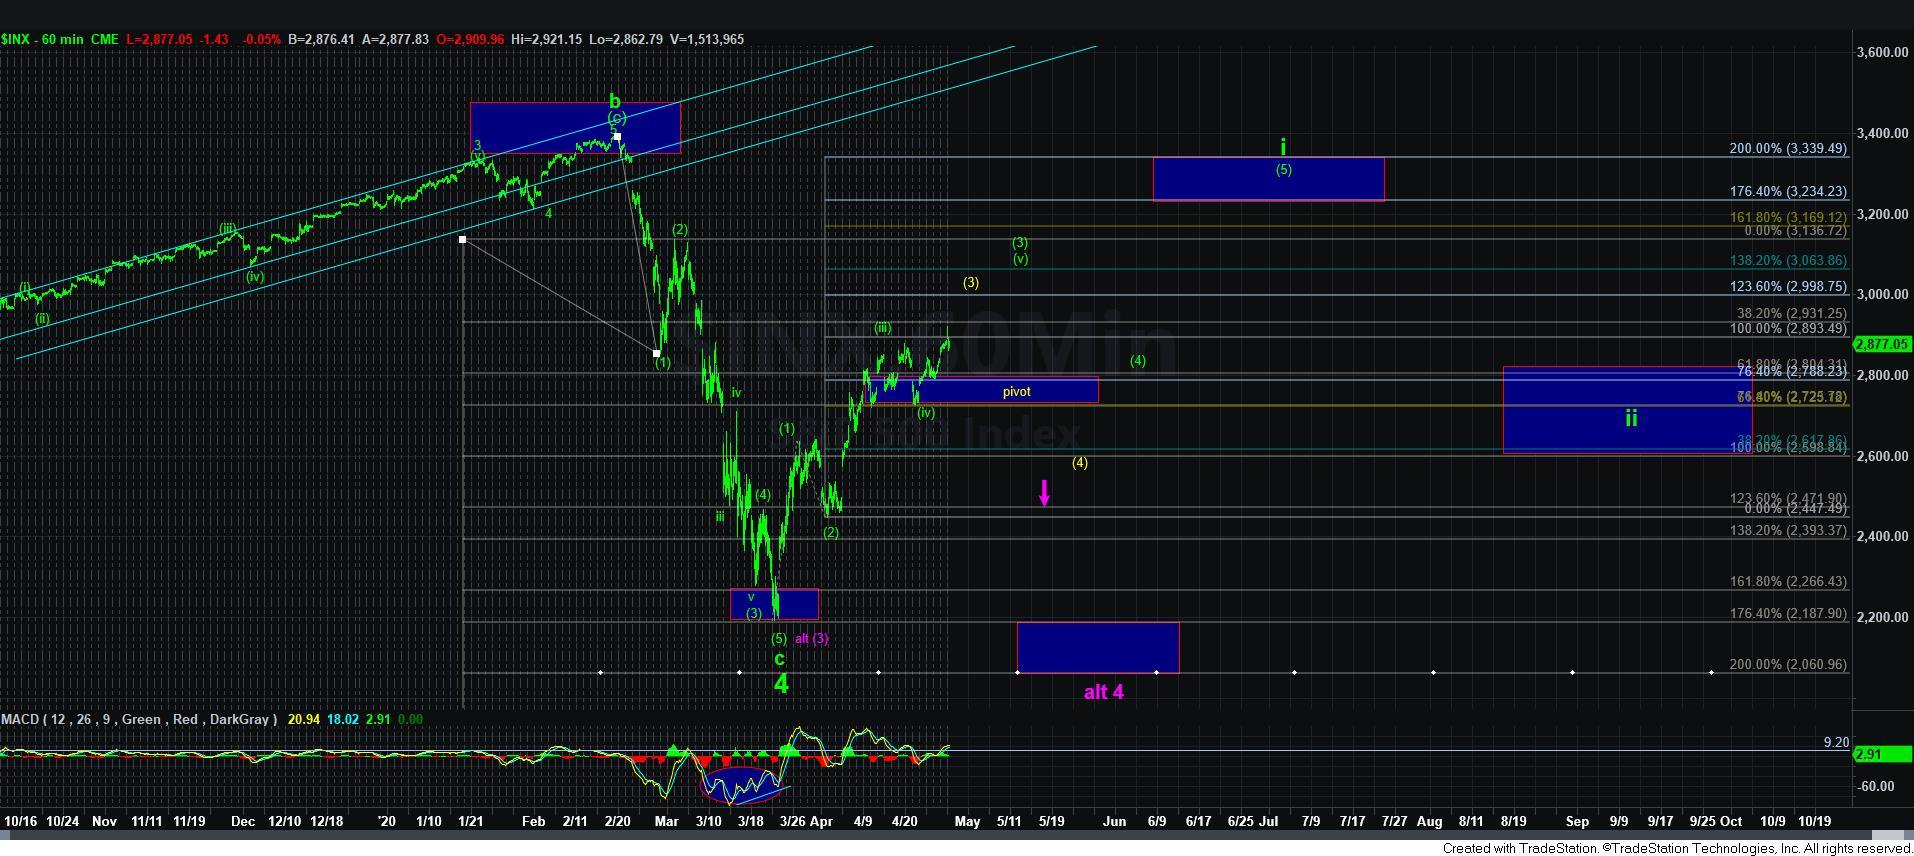
However, since most of our members are more focused on the longer term within the market, you must realize that the easy money on the rally has been made once we came up towards the 2890SPX region. The market can certainly continue higher from here to the 3200 region to complete 5-waves up for wave i, as shown on my 60 minute chart. But, you also must realize that attempting to garner those points come with much higher risk. Moreover, I want to again reiterate that it is not necessarily worth taking that risk, since if the market does complete those 5 waves, it will likely then pullback in wave ii, which can be even lower than where we reside at this time. So, you must consider how much risk you want to take within the market at this time.
As long as the market holds 2846ES, I can maintain a short term bullish bias to complete wave [v] of [3], as shown on my 60 minute chart. However, if we break down below that level, then it opens the door to several other potentials. One of them is the leading diagonal which has been followed by Garrett and Zac, which I have outlined in yellow.
Unfortunately, that wave [4] within a diagonal can be quite deep, as it often overlaps with the top of wave [1]. And, while it is still “possible” that the market can target that lower low in the 2060SPX region, coming as high as we have has made me question that potential even more at this time.
Ultimately, the main point you should take from this is that as long as we hold the 2846ES region, we can still continue higher directly to complete wave [v] of [3] in the green bullish count. Below it, and the market places us in a much more precarious posture.
So, again, I am putting this update out early in the day while we are still near the recent highs so that you can make some decisions regarding your accounts in this region. It’s time to take stock of what you are as a trader/investor, and set yourself accordingly.