Critical Point For The Market
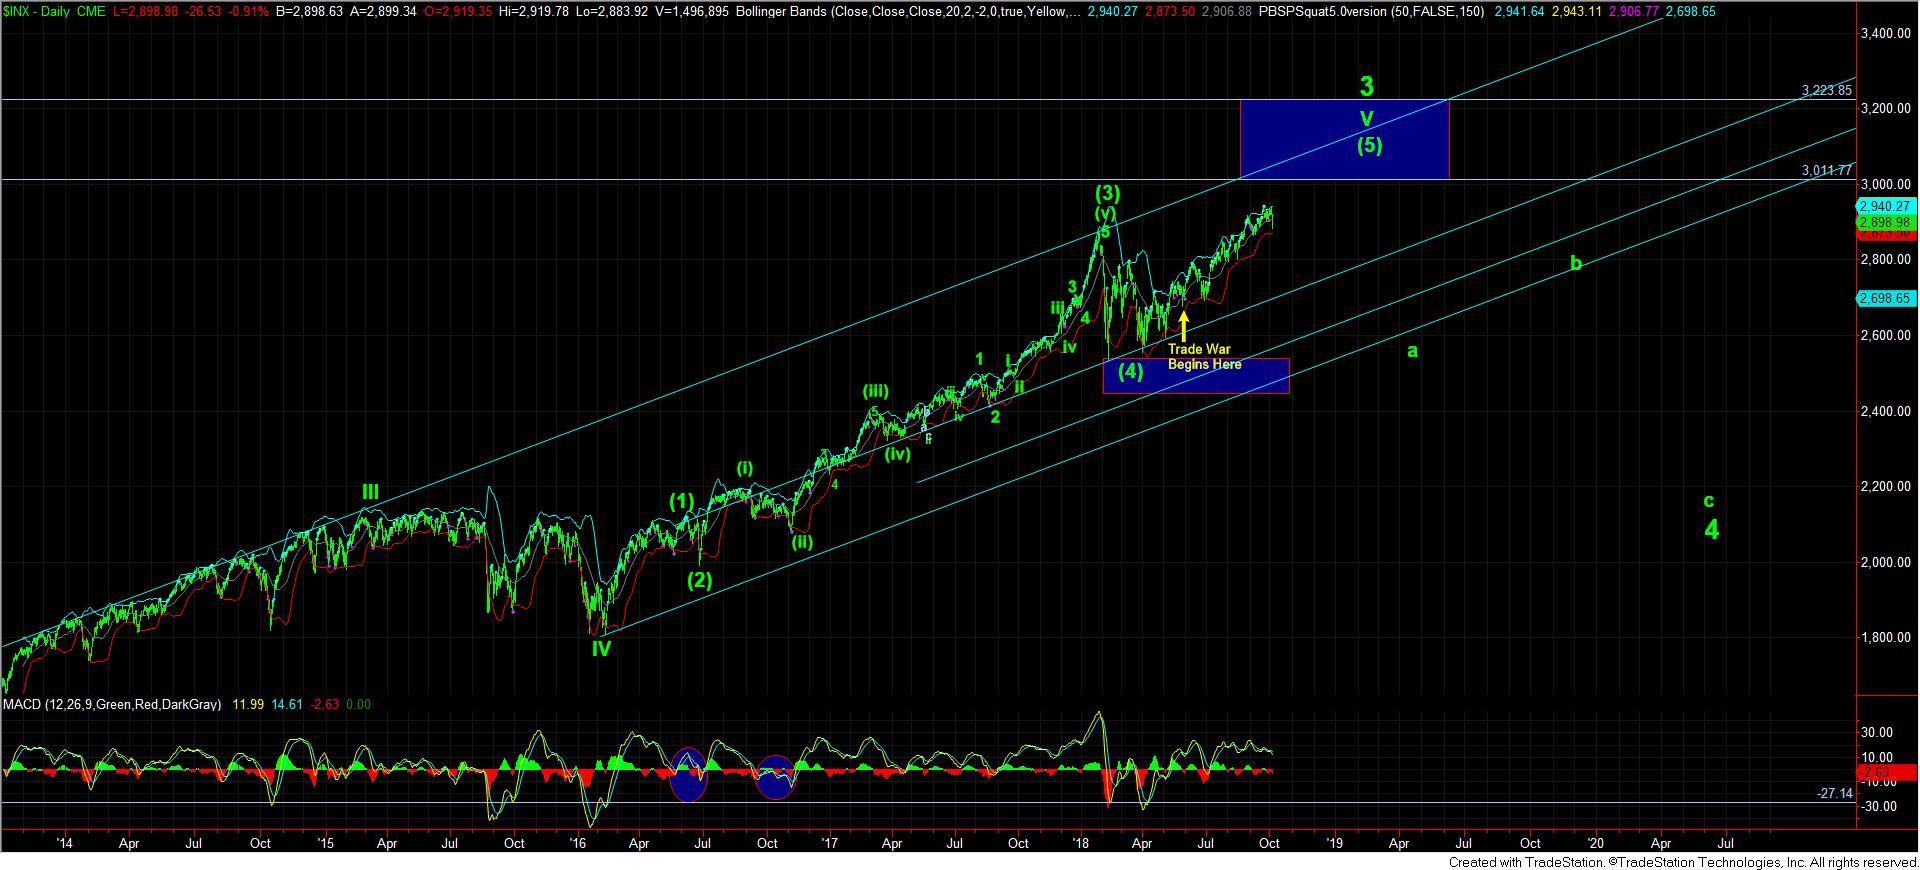
For months we have been looking for the market to tip its hand as to whether we were going to see a top to wave 3 off the 2009 lows at the 3011 region in an ending diagonal pattern, or if we would get the full extension up over 3200SPX before we topped. Right now, the market is at a critical point in that determination.
As we were topping back in late September, my analysis outlined a path that would take us up to the 3225SPX in 2019. However, as I noted when we were topping weeks ago, that path would likely need a drop to the 2880SPX region to provide the appropriate confluence we would need to see to point us up to 3225SPX. As some of you may remember, the structure needed a wave 2 pullback down to the 2880SPX to provide us with perfect confluence to first take us to 3005 for wave 3 of (3), and then higher.
And, with the break down below 2920SPX, the door opened wide to take us down towards that 2880SPX perfect confluence point for the wave 2. Now, while the market has provided us with the ideal set up I outlined weeks ago, it does not mean that the market will follow through. We will need to see further confirmation that we are indeed going to target 3225 in 2019 before we can take it to the bank.
As I have outlined many times over the last two weeks, the market is going to have carefully thread a needle to take us to 3225SPX, and one slip up will likely suggest that we will not exceed the 3011-3050SPX region, and only complete an ending diagonal as the high for wave 3 off the 2009 lows. First, we MUST hold the 2880SPX region. That was the be all end all of our shot at 3225SPX. As of my writing this update, we have held that region and rallied strongly off it . . . so far. But, clearly, follow through is going to be the key.
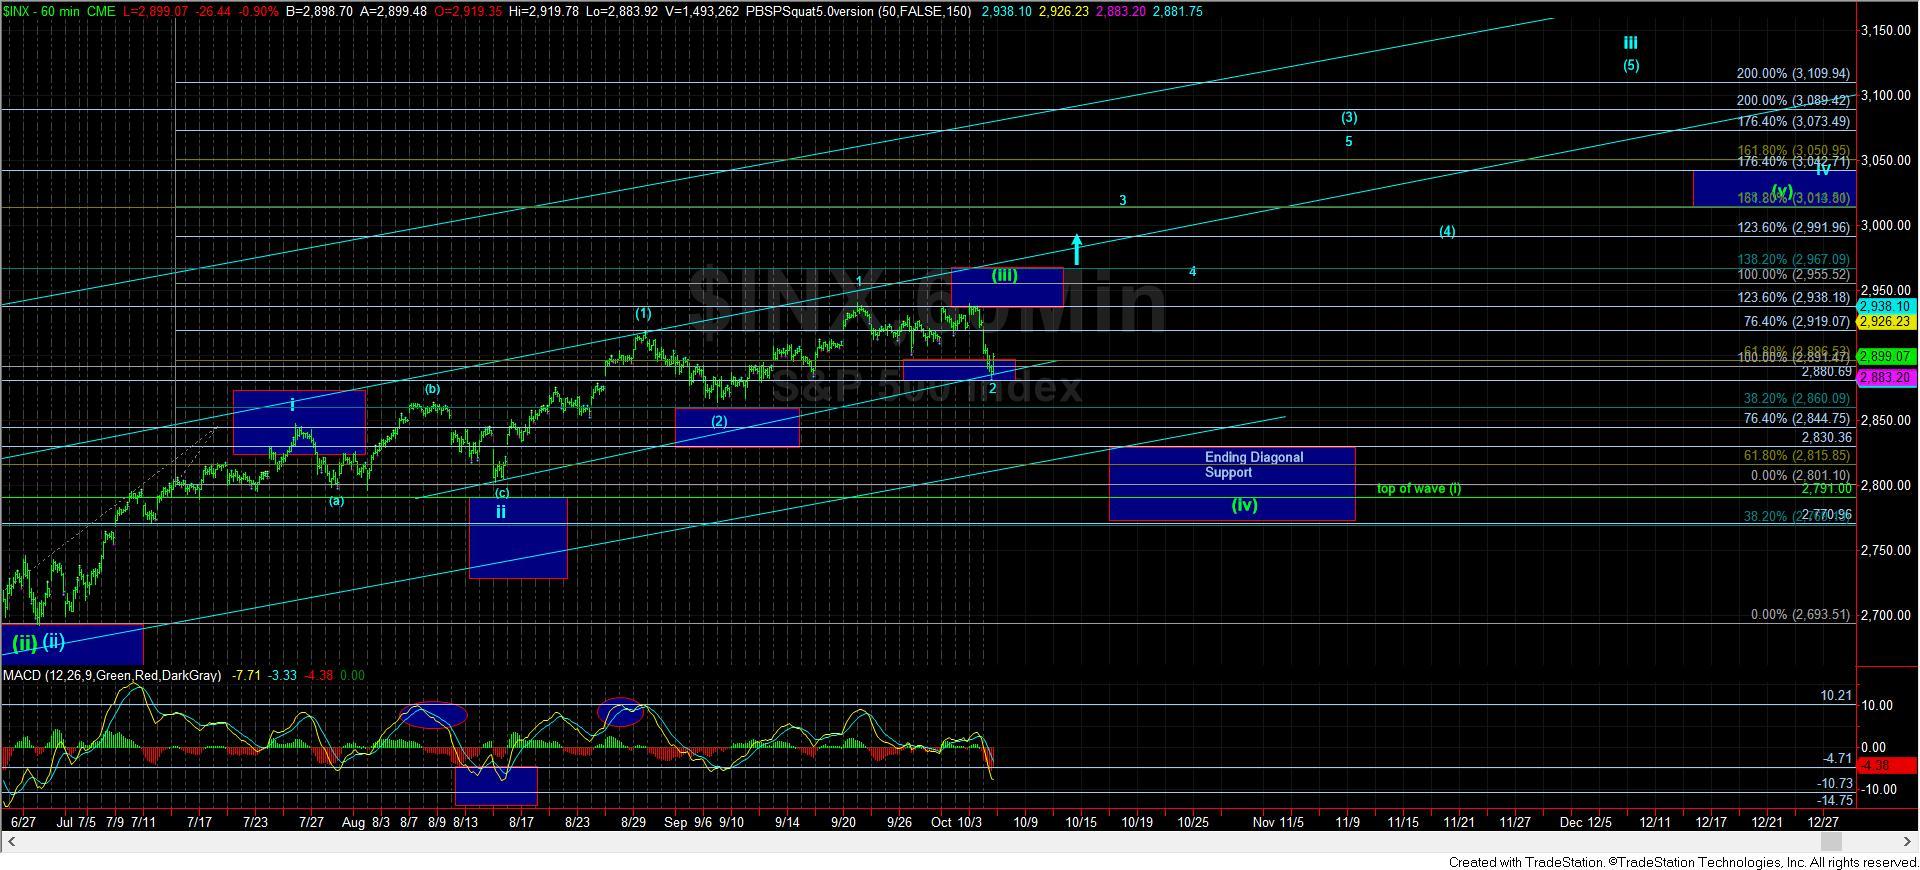
Remember, if we break down below 2880SPX then it would suggest that wave (iii) of the ending diagonal has likely completed, and we would likely be heading much lower in wave (iv) in the ending diagonal, as outlined in the green count on the 60-minute chart.
As an aside, I want to repost something I presented earlier in the day in the trading room about the ending diagonal pattern:
I have to add some information regarding the ending diagonal scenario, as it seems to be gaining some "support" from the market action. One of our members asked me a question this morning in the live video which made me take notice of something I had not reviewed before.
A typical wave (iii) in an ending diagonal will target the 1.236-1.382 extensions of waves (i) and (ii). In our case, that is the 2935-2970SPX region. Someone also asked me why the market is hesitating so much in this region, and this is likely the reason. So, in effect, the market is respecting the resistance region for the ending diagonal scenario. While it still has not proven it to me with a break of support, I think this sheds a bit of light on why the current region is acting like such resistance.
Additionally, should the ending diagonal play out, then the target for the wave (v) would be the 1.618-1.764 region (3011-3045), which is right in line with the long term minimum target we have for this wave 3 off the 2009 lows.
Moreover, this would mean that a break out through the 2970SPX region would make the blue count MUCH more likely.
So, as we have been saying, its decision time for the market, as it has truly run out of operating room to decide between 3225SPX and the ending diagonal scenario.
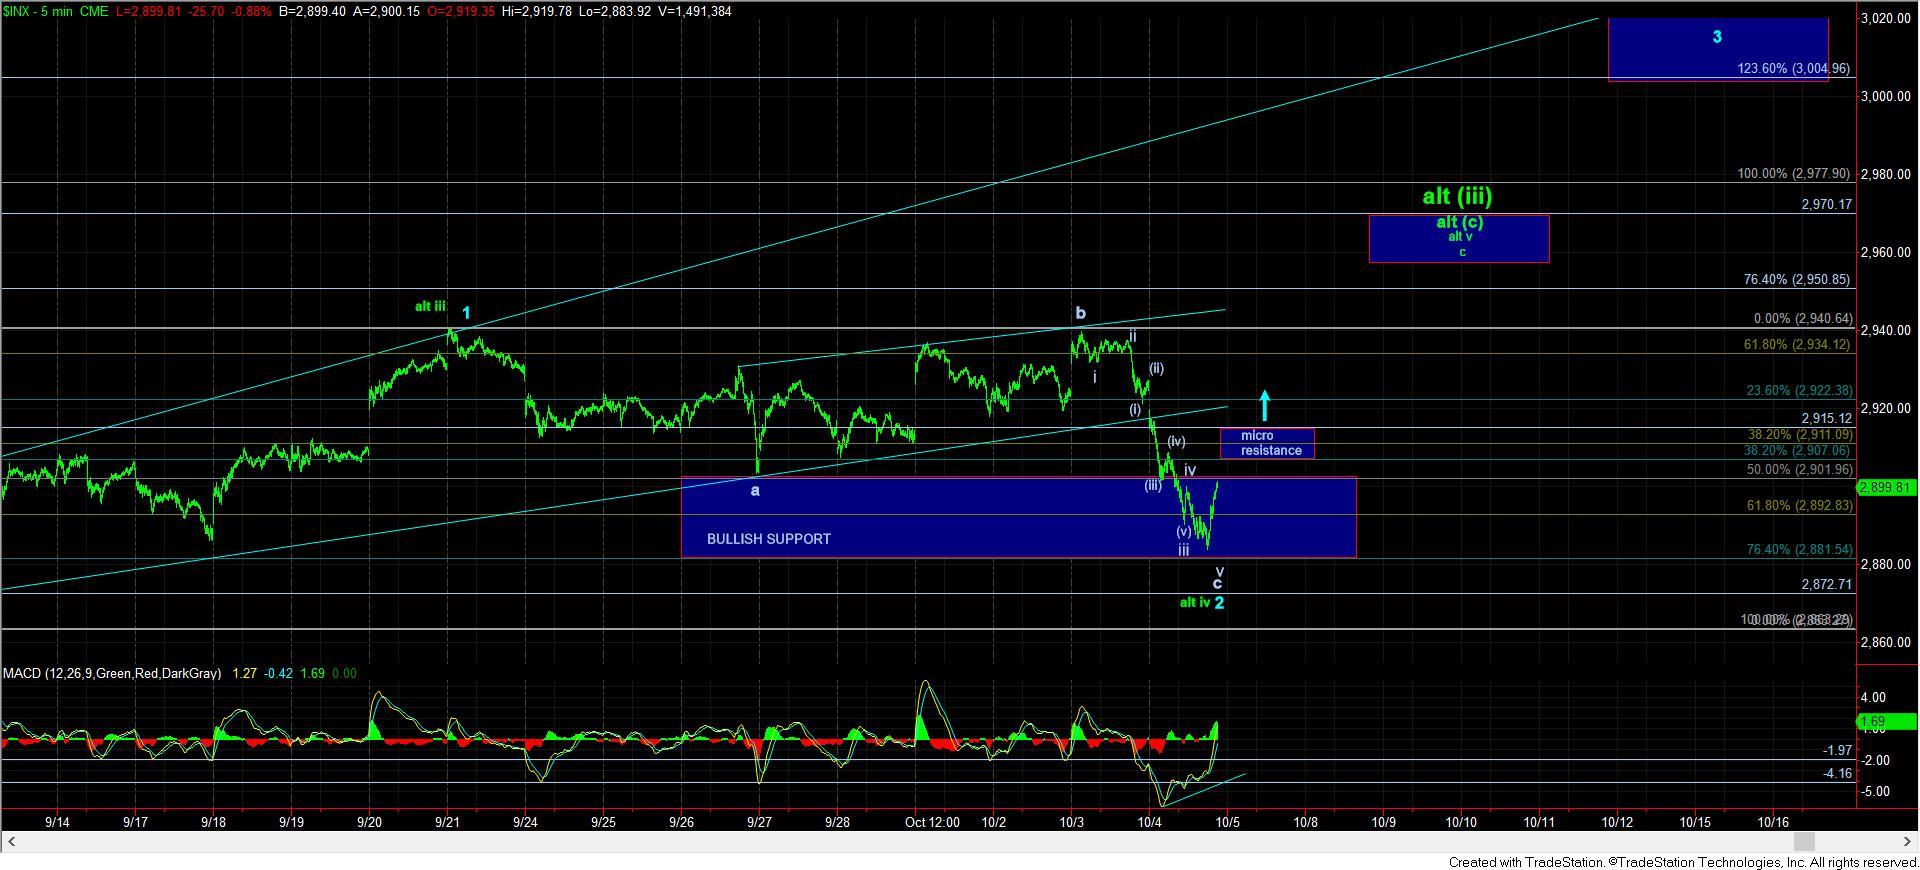
With the market holding 2880SPX so far, unless we see a break down below that region in the overnight hours, we will need to see an impulsive rally take us through he 2915SPX micro resistance noted on my 5-minute chart. Again, in order to target 3225SPX, that rally MUST be impulsive, or that is our first clue that the ending diagonal is going to play out.
For now, the market has many ways it can slip up and keep us in an ending diagonal as presented in green. The path to 3225SPX is one which must begin to show signs of it developing over the coming days, or we will get early signals that it is not meant to be in wave 3 off the 2009 lows. Its time for Mr. Market to thread this needle, and its failure to do so will keep us in an ending diagonal pattern to complete wave 3 off the 2009 lows.