Could We Have Topped?
 By
Avi Gilburt
By
Avi Gilburt
With the market pulling back even more today, the question asked in the title of this update has to be on the table at this time.
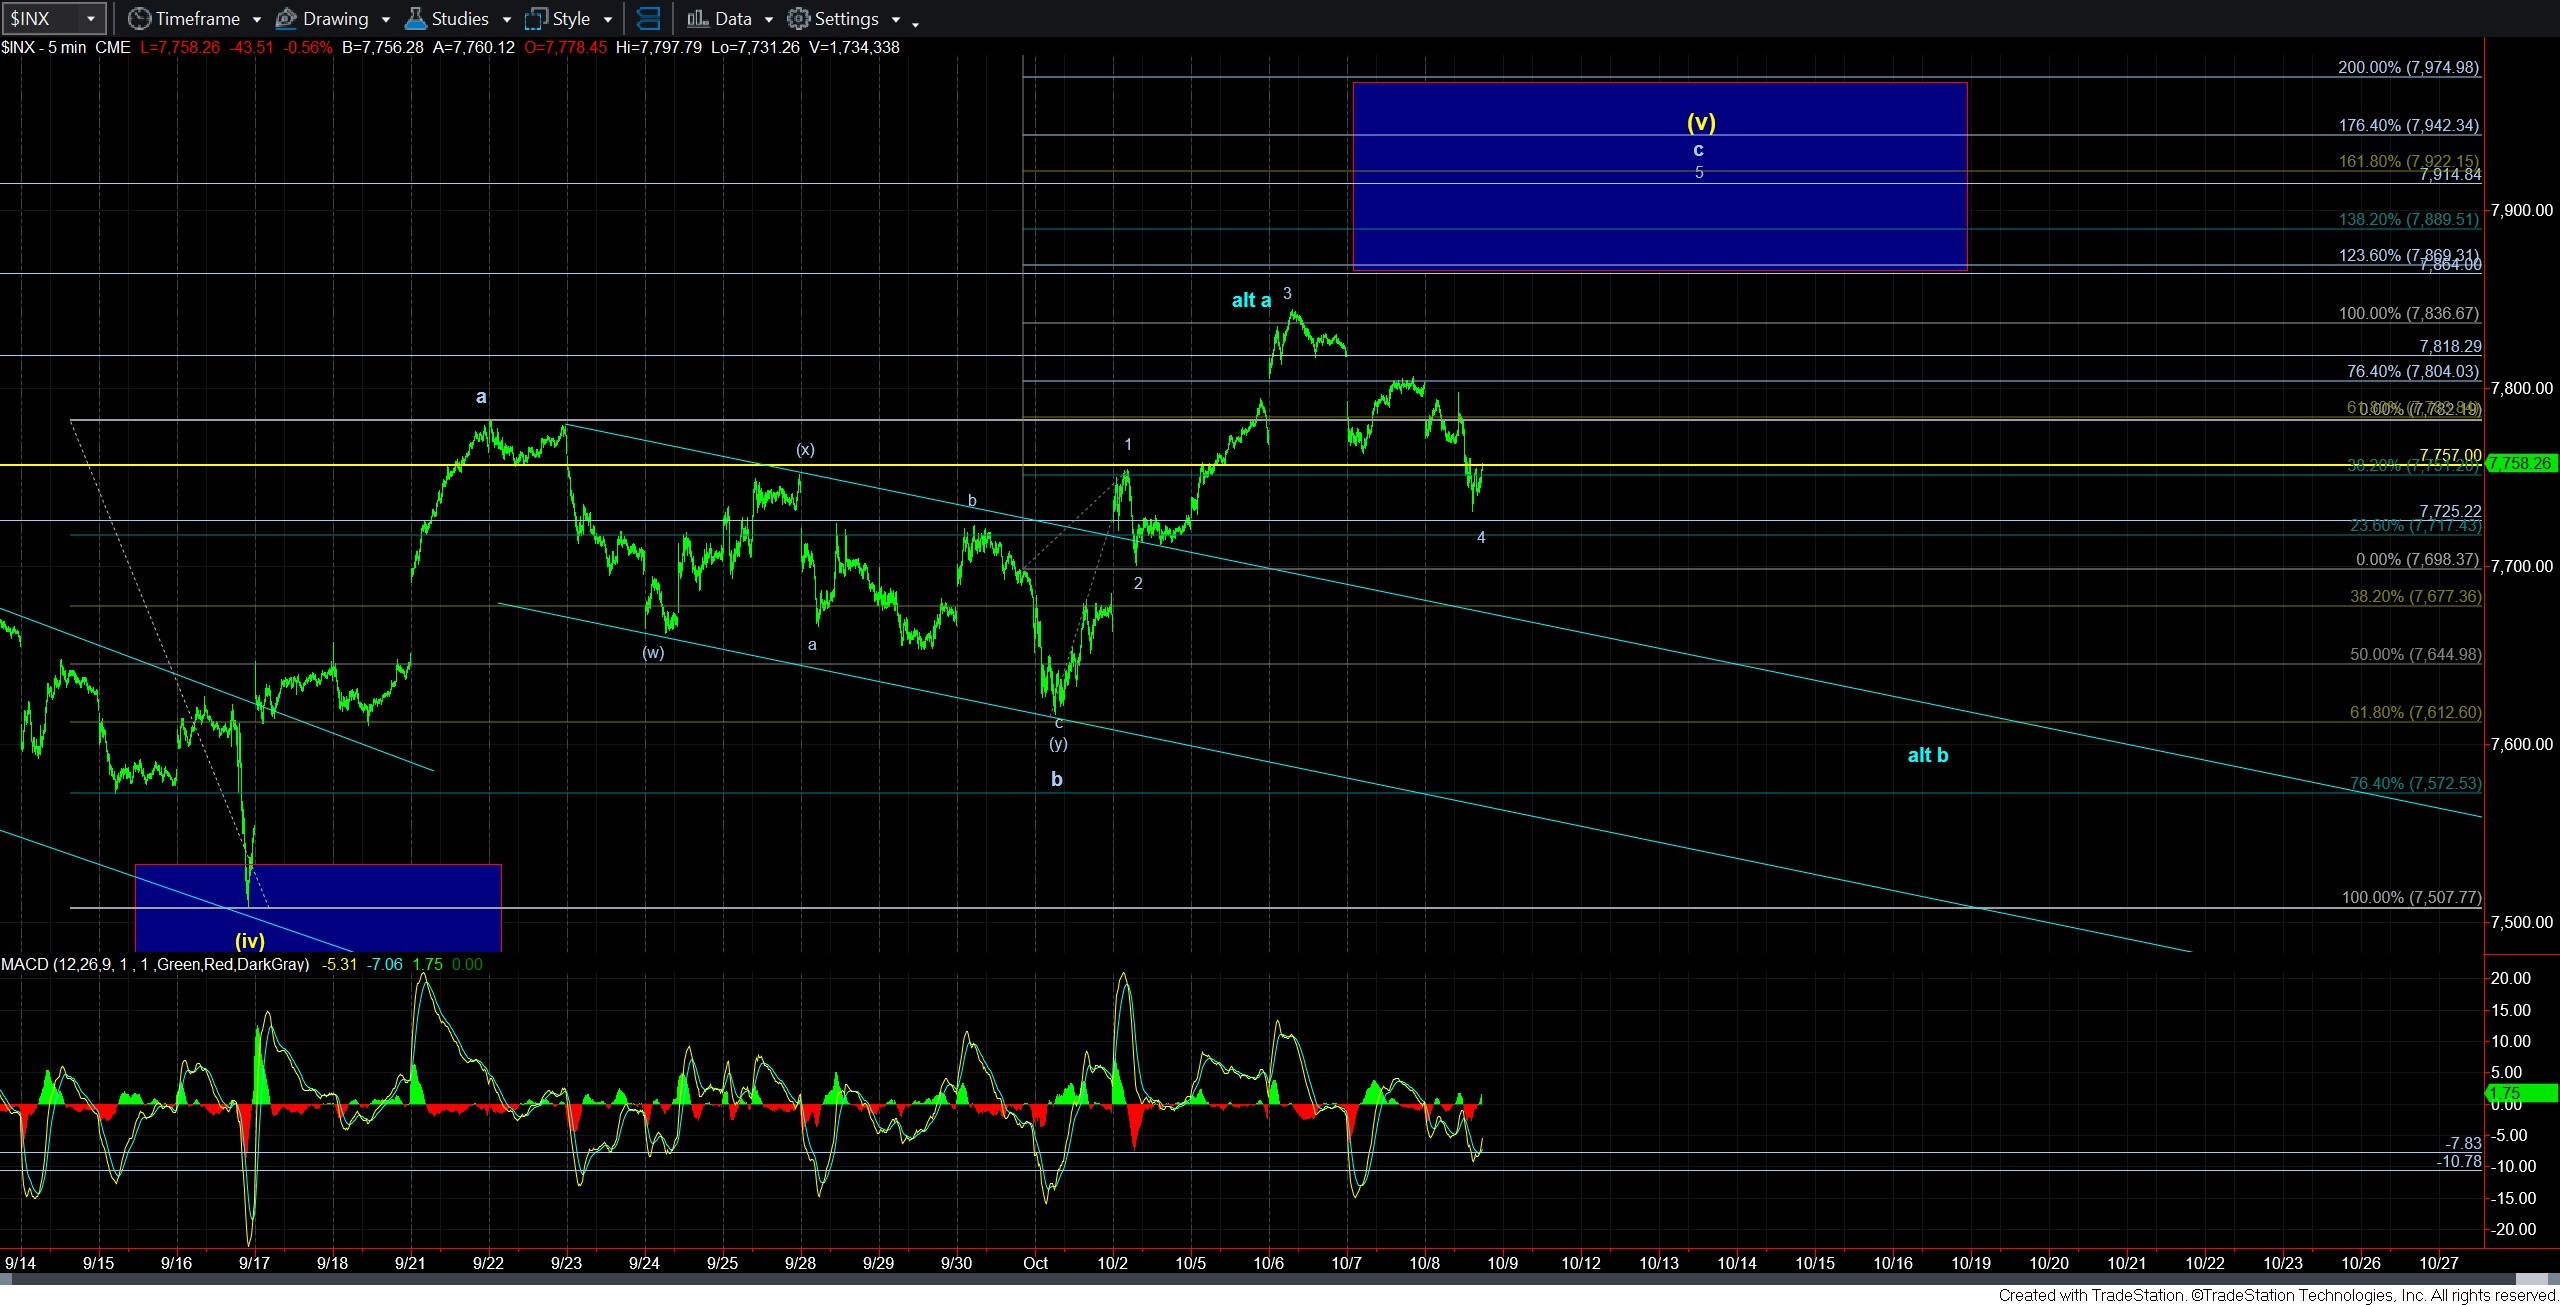
As we have explained in the last two days, if we are dealing with a diagonal to the target overhead, then the 3rd wave came up short of the standard target. So, it clearly places into question whether this pullback is a wave 4 in that diagonal.
However, should the market break down below the wave 2 (7700SPX) in that potential diagonal, then we completely invalidated that count as shown. And, it then brings to the forefront the question asked in the title.
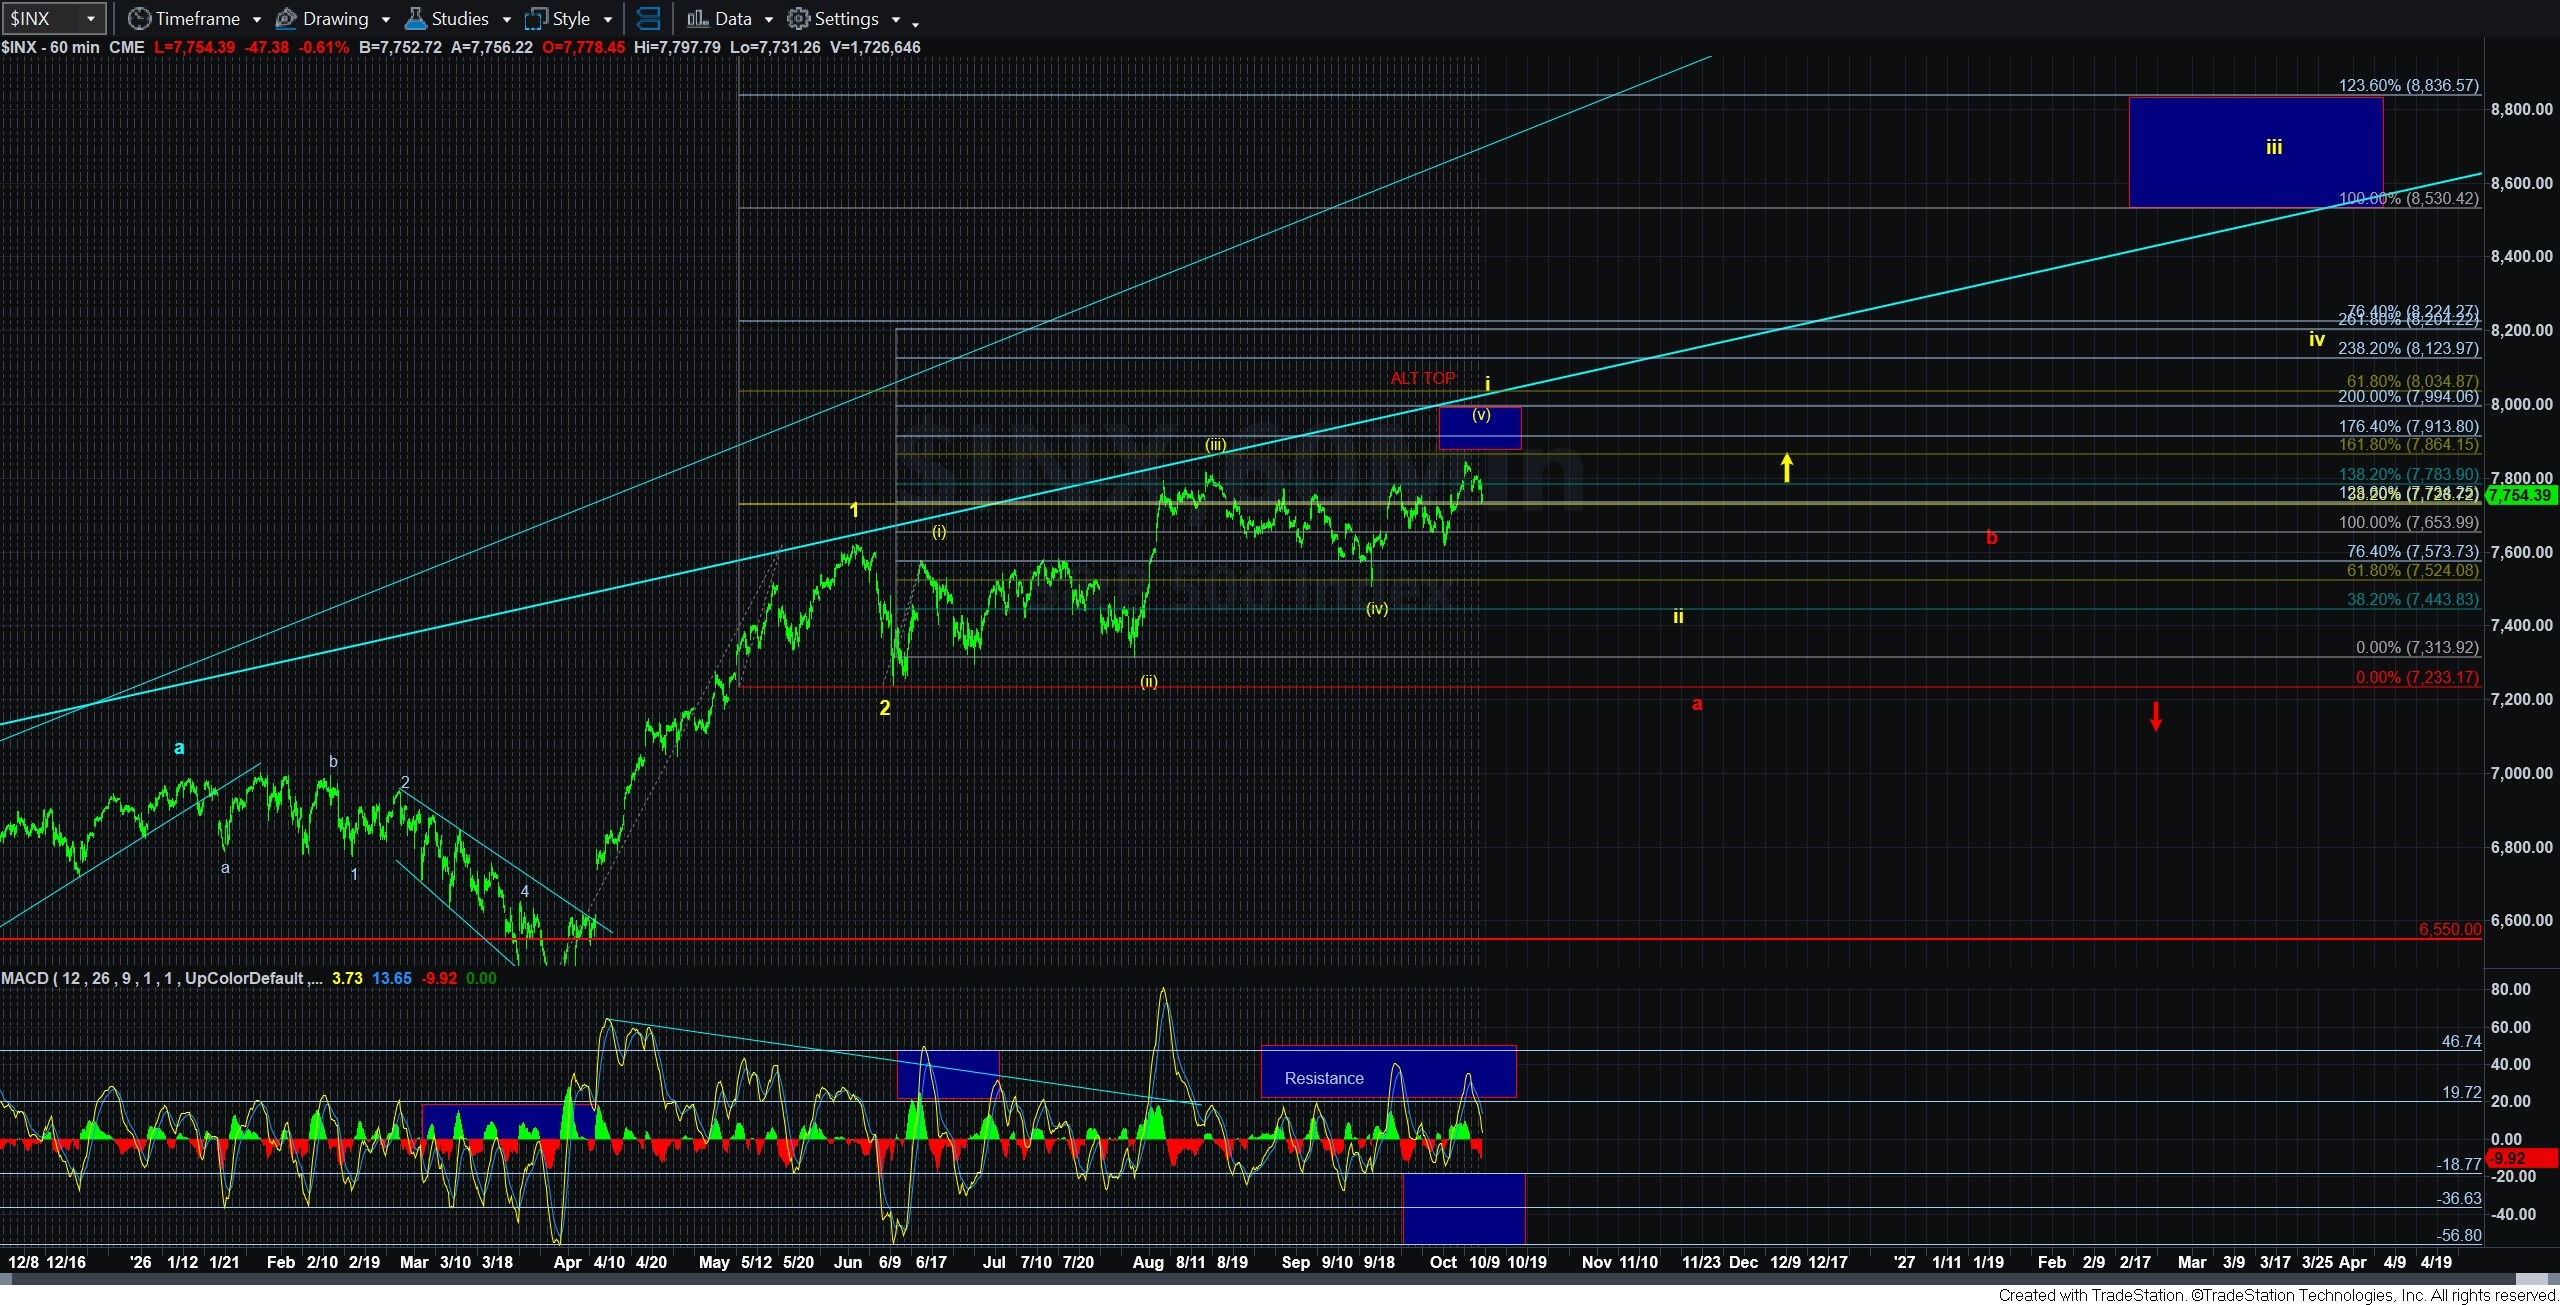
While the market did come up short of the ideal target box presented on the 60-minute SPX chart, we did make a higher high. And, this could satisfy our need for a 5th wave higher high in this bigger yellow diagonal, even though it does seem a bit small relative to waves (i) and (iii).
But, if that is the case, then how strongly we continue to drop can present evidence that a major top may have been struck in a very anti-climactic manner.
So, for now, 7700SPX is going to be the level to focus upon regarding some form of topping. As long as we are above it, I am going to give the market room to push to one more higher high and the ideal target overhead.
However, a break below it will point us back down to the 7600SPX region for the alternative b-wave. But, to be honest, I really do not think that count fits terribly well in this structure. Such an a-b structure within a 5th wave would be quite large relative to waves (i) and (iii) in this diagonal.
So, if we do break 7700SPX, I would become concerned about either the yellow wave i as having topped, or the major top have been struck, all depending upon the manner in which we decline in the coming weeks.
Unfortunately, these 3-wave structures leave a lot to be desired from a clarity perspective. But, however you view this market, risks have clearly risen until we can be more confident that the yellow wave ii is what is in play in the coming weeks.