Corrective Rally - Market Analysis for Aug 5th, 2024
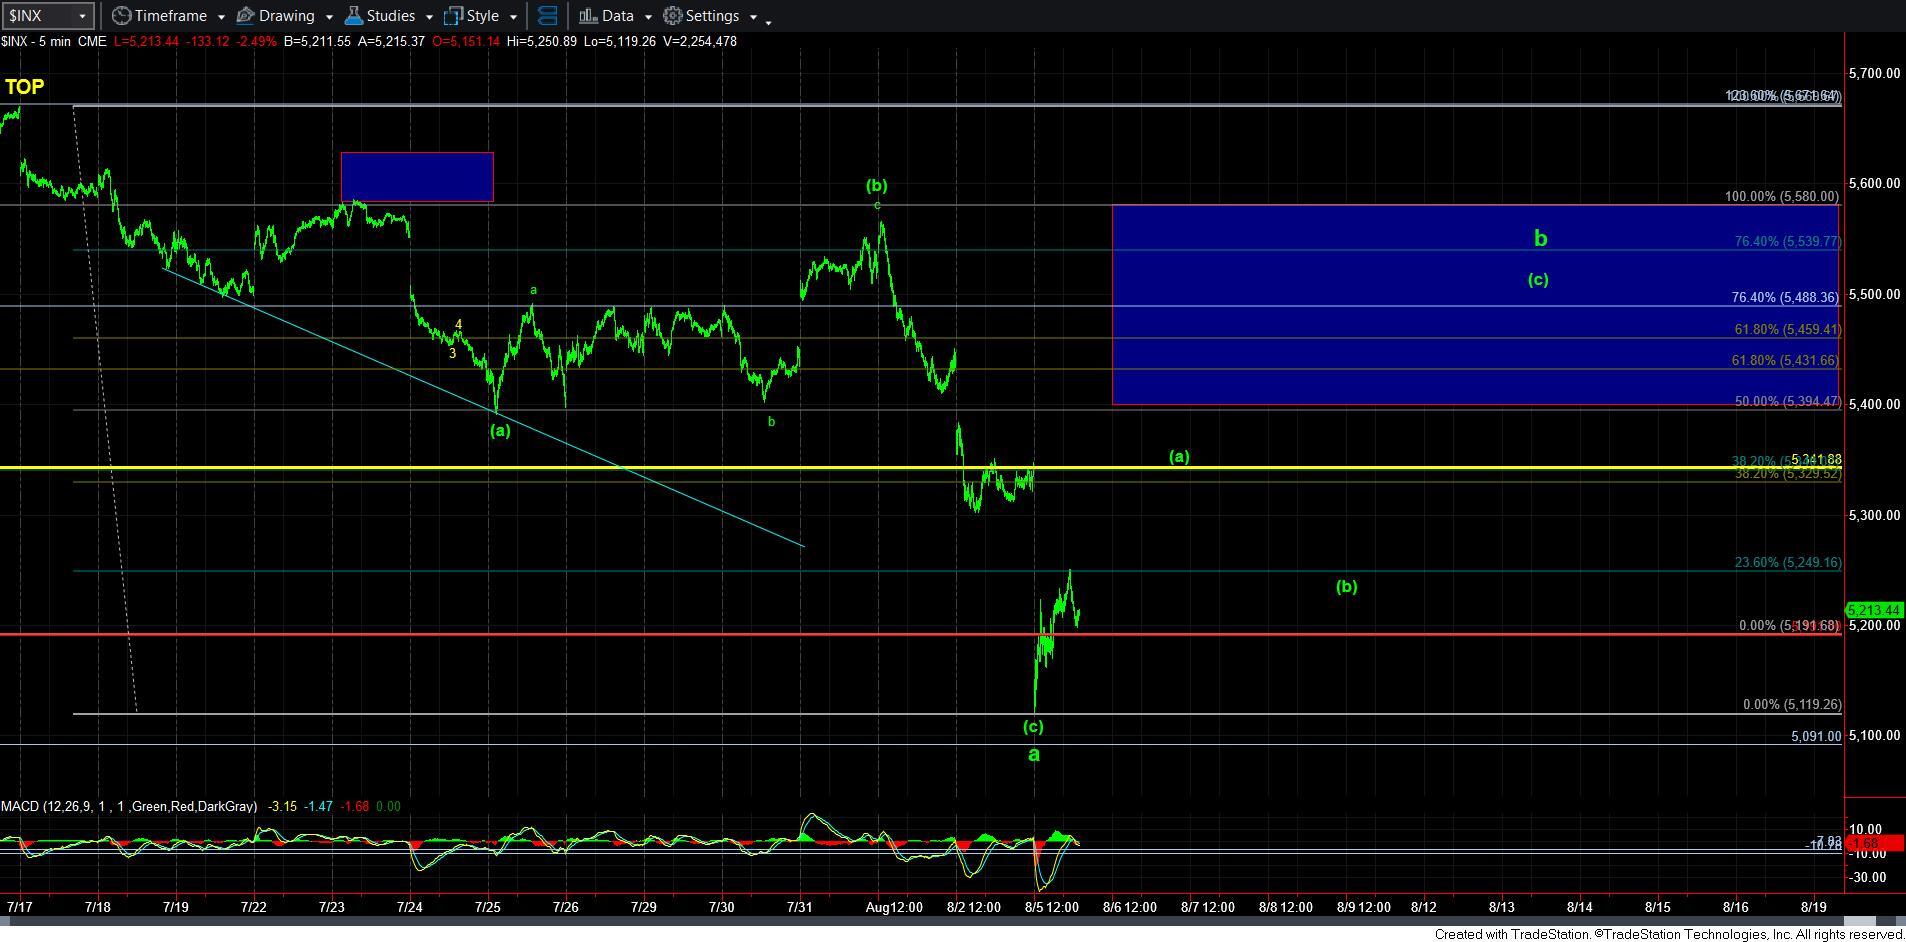
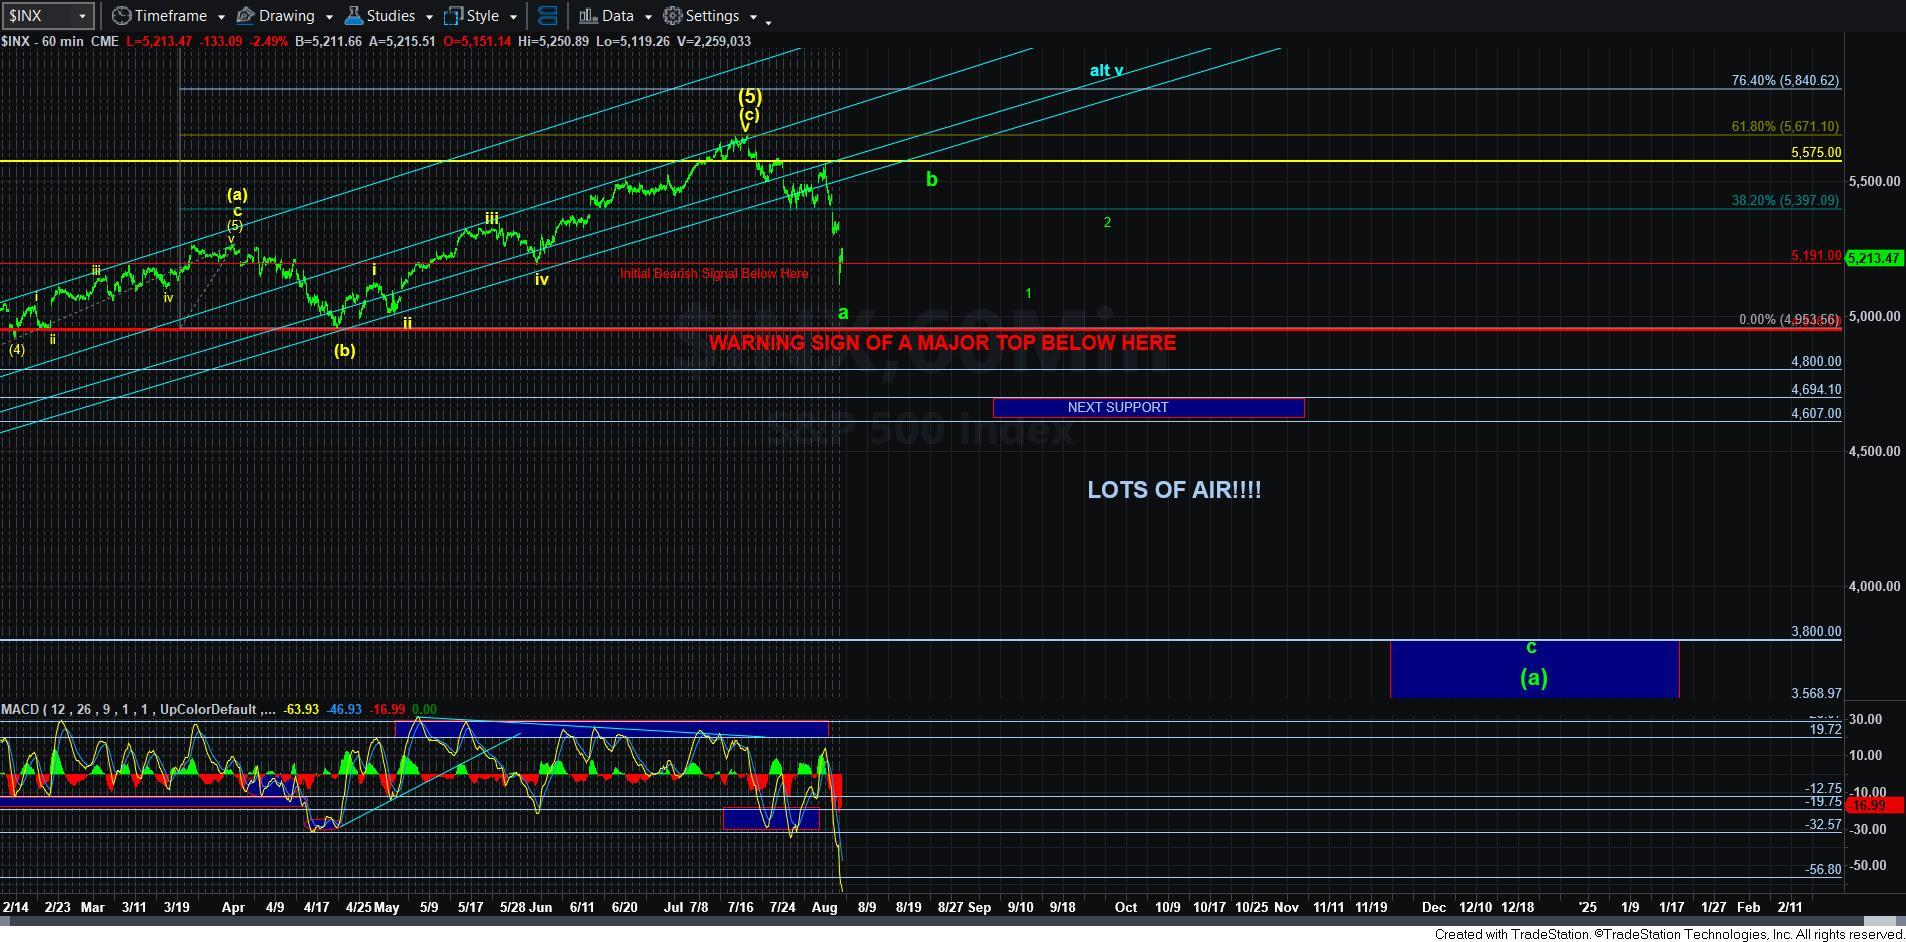
To recap what I said this morning, the probabilities have shifted to the market having struck its long-term top already with the break down below 5191SPX. While it becomes a much higher probability once we break down below 4946SPX signal level noted on the 60-minute SPX chart, at this time the probabilities have shifted to the point where my primary wave count will have the top in place now.
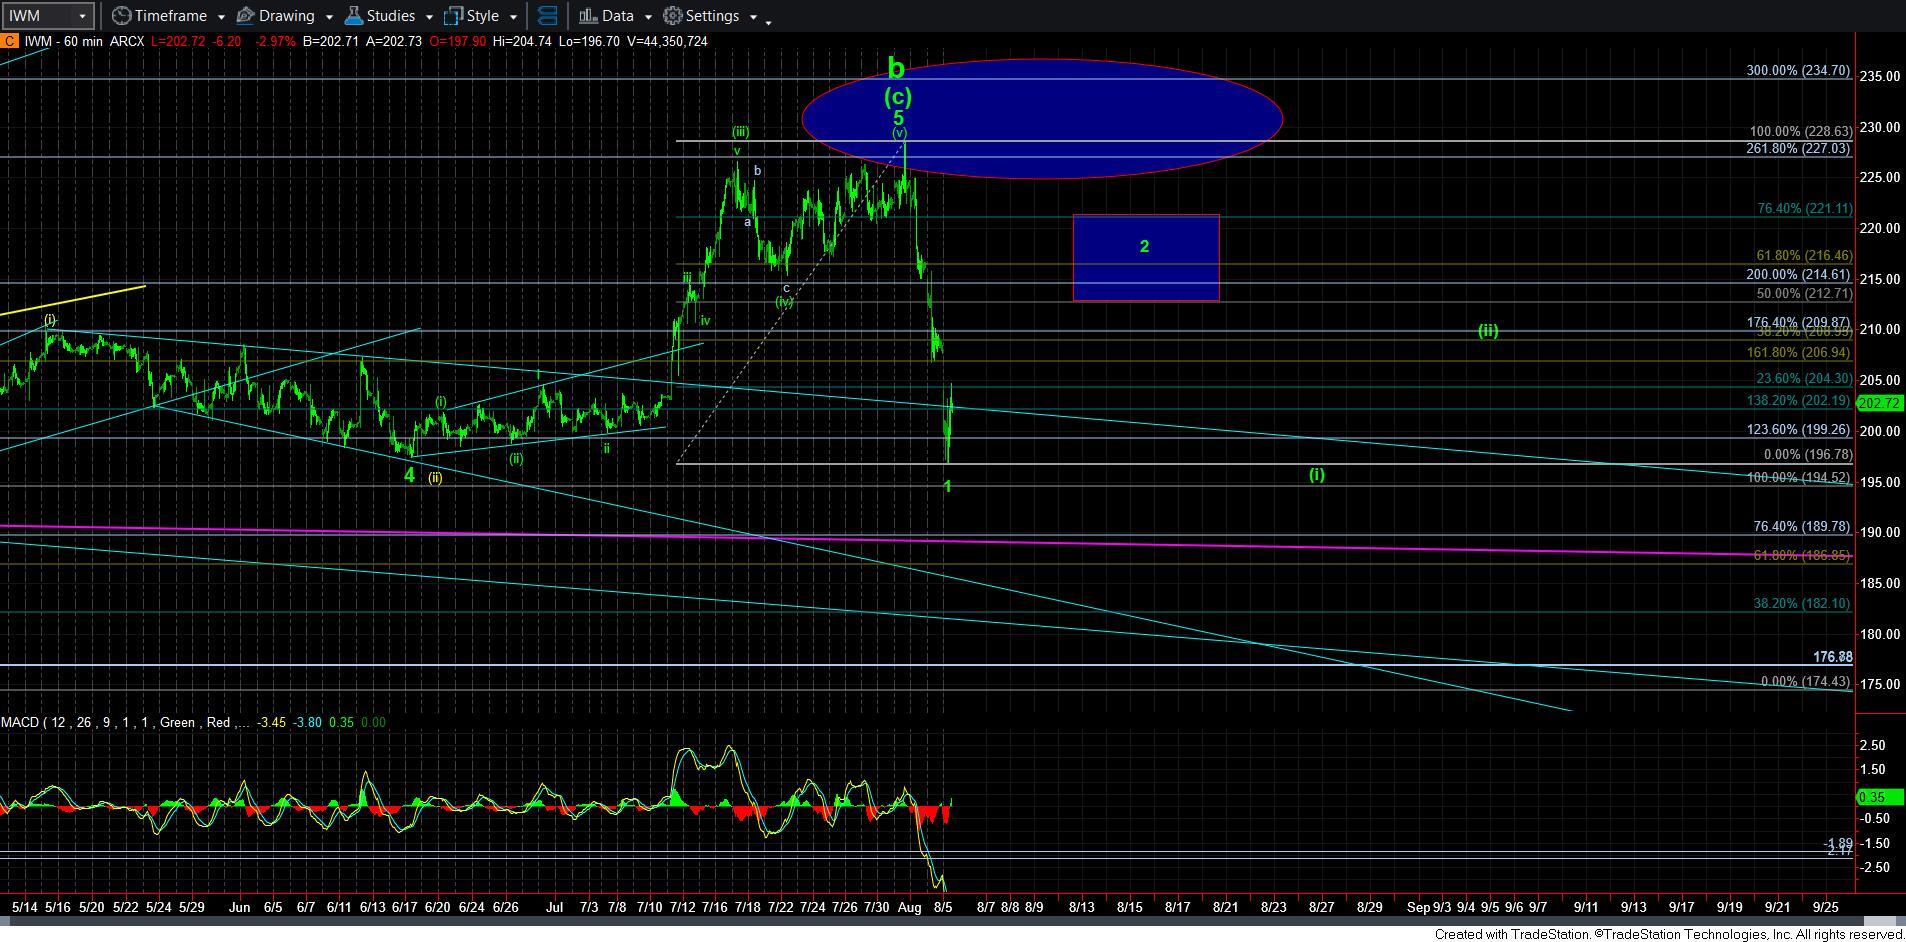
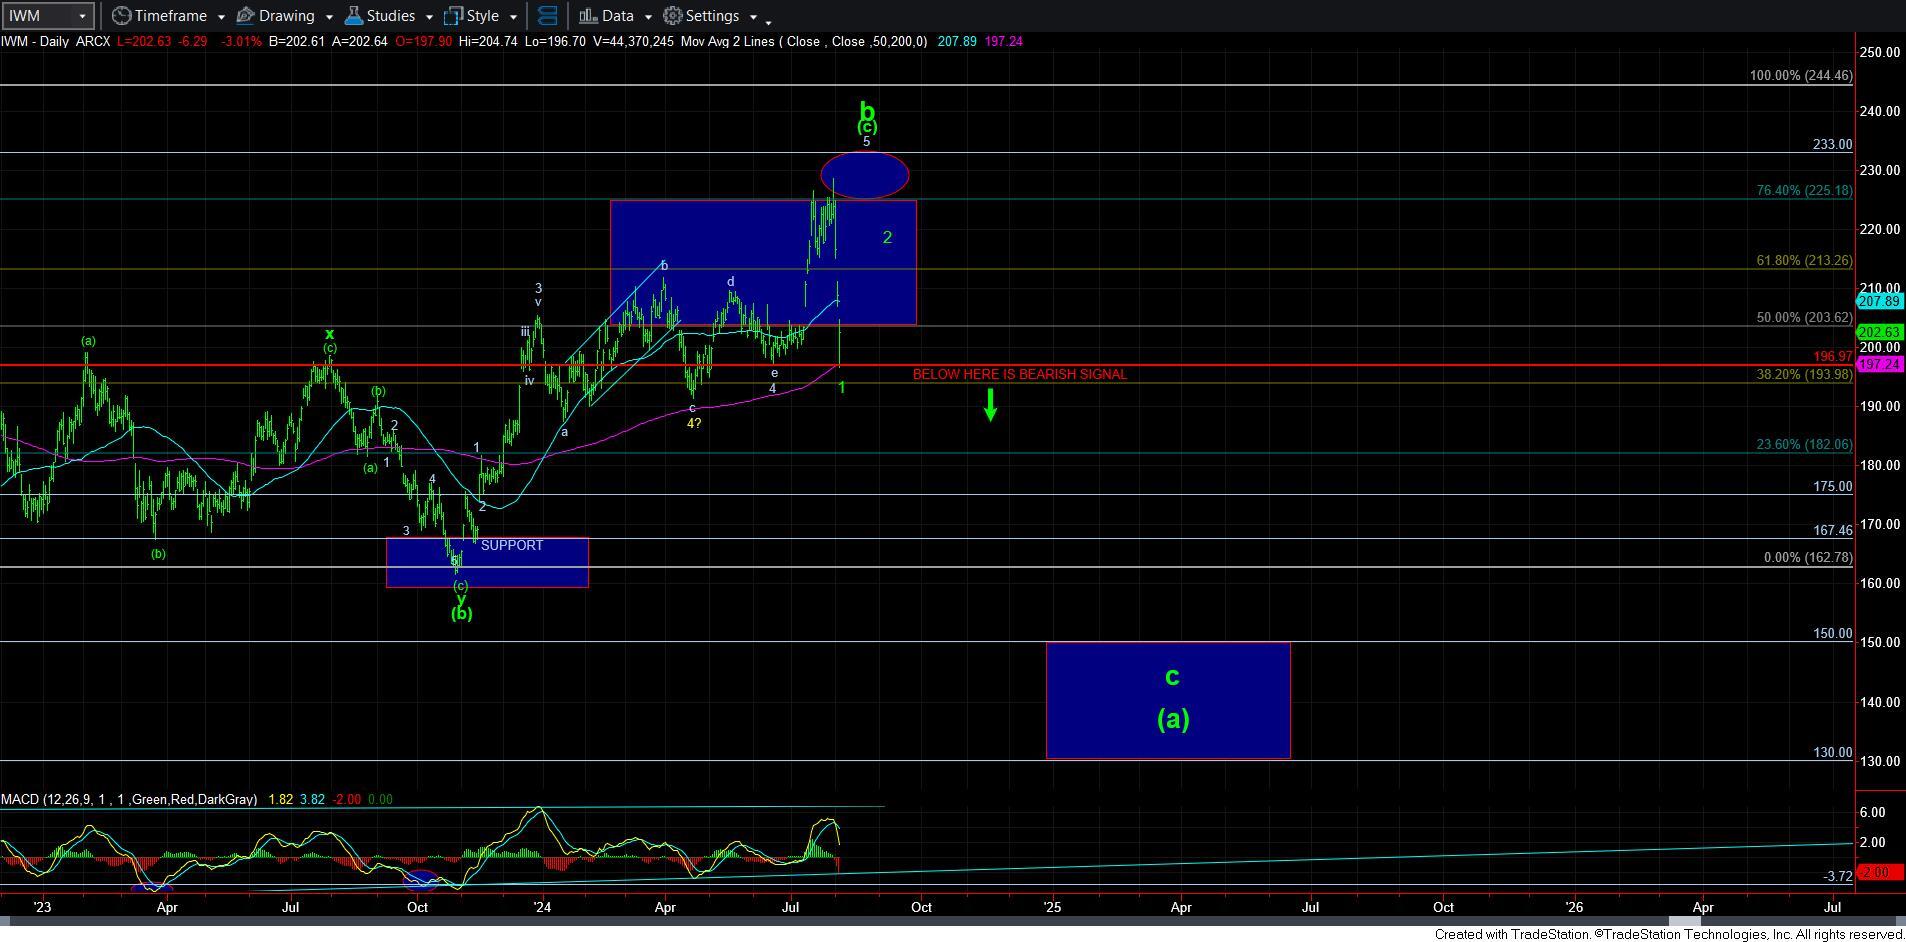
There is also a slight difference between the SPX and IWM counts I am presenting. For simplistic sake in the SPX, I am considering the high struck in July as the top of wave [5], which completes the rally off the October 2023 low, the October 2022 low, the March 2020 low, the March 2009 low, and the 1932 low. Yes, this would mean we have completed a very long-term top, and have begun a long term bear market. But, again, following through below 4946SPX would increase this probability further.
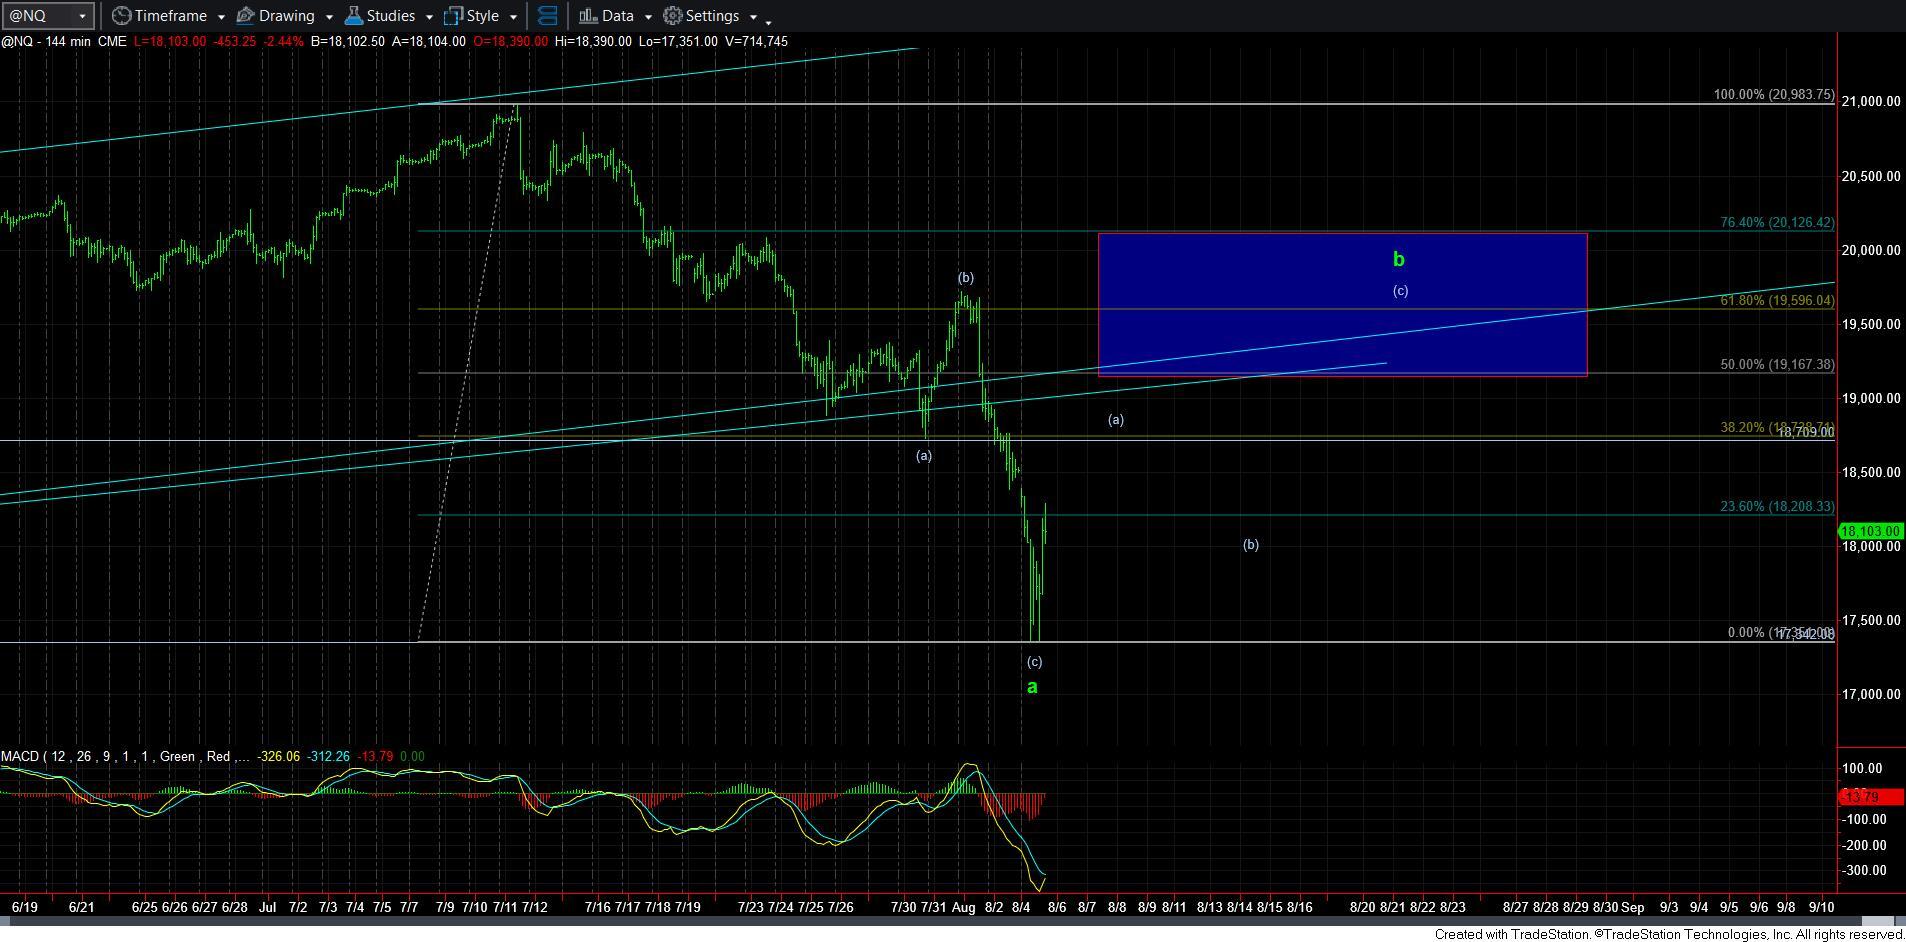
In the meantime, I am viewing the current rally in SPX as a b-wave rally, assuming that the a-wave decline found its bottom this morning. Should the market push a bit lower in the coming day or so, then I will simply view it as another extension in the a-wave.
I am also including a simplified NQ chart, which shows a similar perspective. Whereas the [c] wave of the a-wave in SPX was equal to 1.618 times the size of the [a] wave, in NQ we have an [a]=[c] low struck in what may be the completion of it’s a-wave.
Moving over to IWM, I am viewing this decline as wave 1 of a larger degree c-wave, which is pointing us ultimately down to the 150 region.
This now suggests that as long as the bottom has been struck this morning, we are now going to be tracing a corrective a-b-c rally across the market. This will not likely take a day or two. Rather, it is something that should take us at least a week, or maybe even longer.
Now, does this mean that everyone should be shorting this market with reckless abandon? Absolutely not. Bull markets do not die easily, and, yes, it is still possible this market may attempt to push to higher highs even though that is not my primary count at this time. Instead, we should be very measured in our approach.
For those that do not engage in shorting the market, you may want to take this opportunity to raise cash, especially if the market provides us with another 1-2 downside set up. For those that do engage in shorting the market, then you can choose to enter an initial tranche of a short as we complete this bigger a-b-c rally into resistance. You can then wait to see if the market provides us with another 5-wave decline, and then add shorts on the ensuing corrective retrace thereafter. You would then place your stops at the high of the initial a-b-c rally high.
There are many ways to approach the market, and there is no one right or wrong way. You must abide by your own risk tolerance not engage in anything that makes you uncomfortable or unable to sleep at night. Therefore, the approaches to the market right now will vary between those who will aggressively short, to those who will raise cash to then deploy at the bottom of the next major c-wave decline we see in the coming months, assuming this downside set up follows through.
In summary, the break of our initial support at 5191SPX has made me view the long-term market top as being in place. The probability of that will increase on a follow through break-down below 4946SPX. These have been highlighted on my 60-minute SPX chart for many months now. For now, I believe we will likely see a corrective a-b-c rally, which will point us back to the various resistance/target boxes noted on my charts. Should we see a 5-wave decline once this next a-b-c rally completes, then we have a strong signal that the market is about to follow through to the downside in a big way.

