Corrective Action Seems To Be Continuing
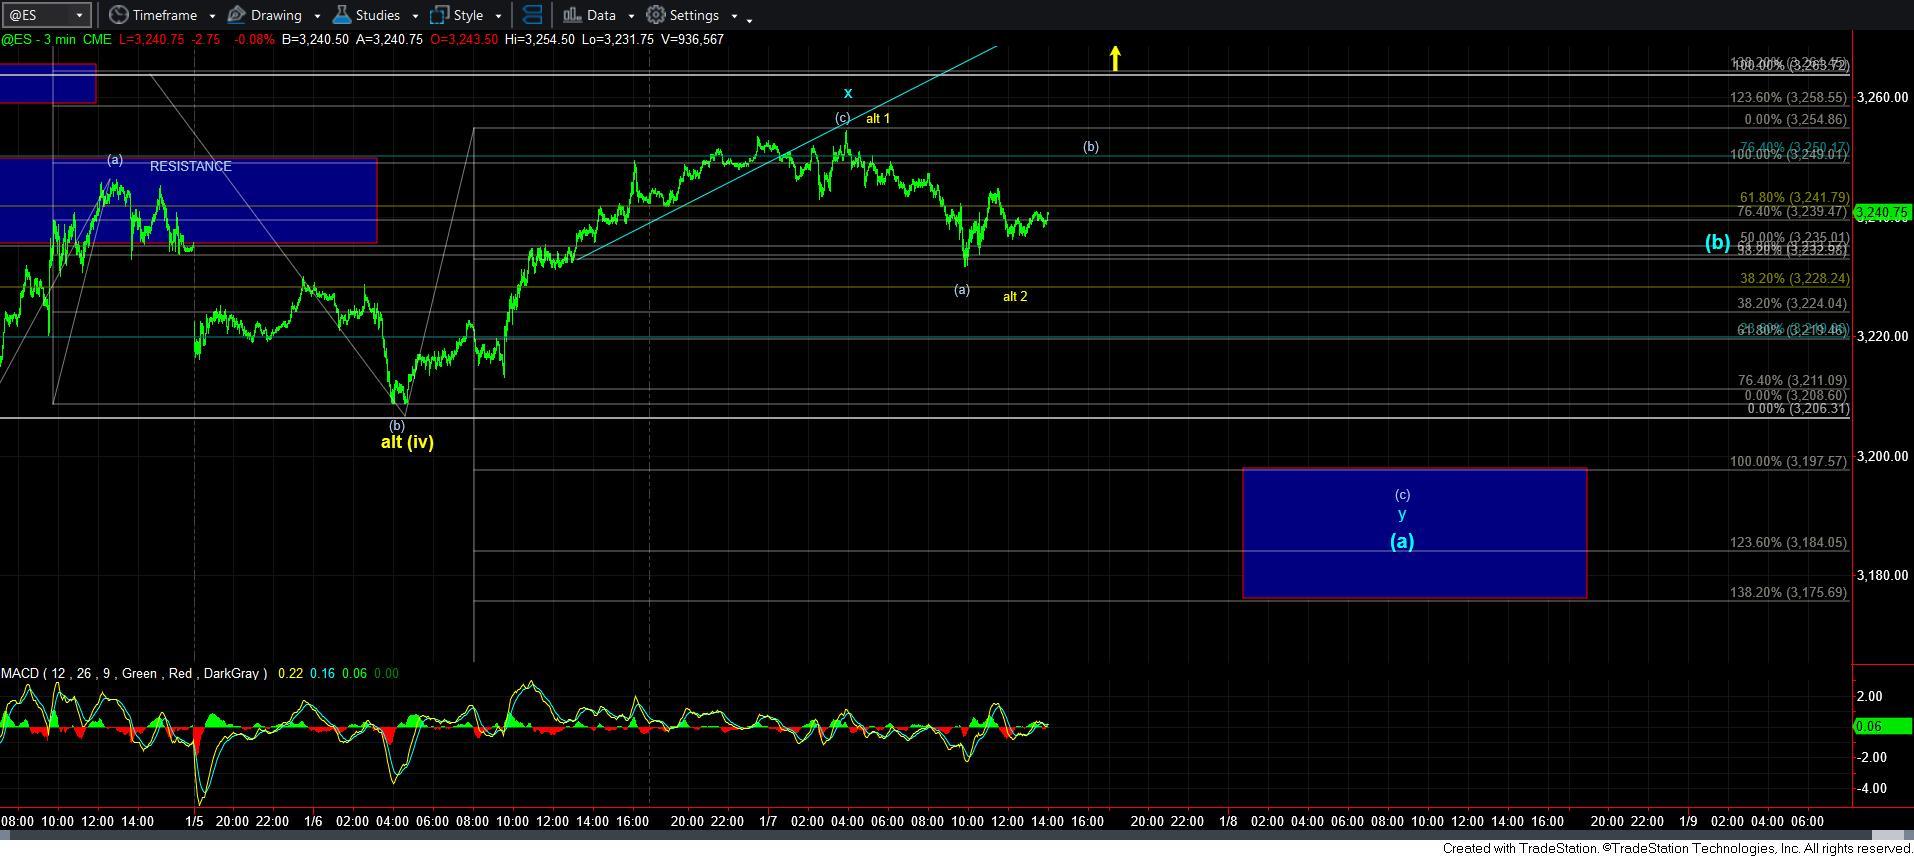
If you have been following my 3-minute ES chart, you would have expected us to top out in the 3250 region, and then drop back down to the target box below. With the market pushing slightly past that resistance, it did make me consider an alternative, as presented in yellow.
But, I first want to explain that the count presented in yellow makes me uncomfortable even as alternative due to the very unusual proportions we would have to accept for that to be a completed wave [iv]. But, if we are able to exceed the overnight high, then I would have to take this potential more seriously, and consider that we are on our way to the 3330 higher target in the yellow count.
However, the blue count is also not as clean as I would like. You see, if we completed a b-wave high last night, then the c-wave decline should have been a 5-wave structure. The decline we have seen off the overnight high was not exactly been a clear 5-wave structure. Rather, if we are going to drop to our target box below, then it will be in a more complex w-x-y structure, which is normally hard for me to consider a “high probability” structure.
So, where this leaves me is that as long as the overnight high holds as resistance, I have a reasonable structure pointing us down to the blue box below on the 3-minute ES chart. That would either be an [a] wave of an a-wave of wave [2] in blue, or it can also be the yellow wave [iv]. The manner in which we rally off that low will be the distinguishing factor.
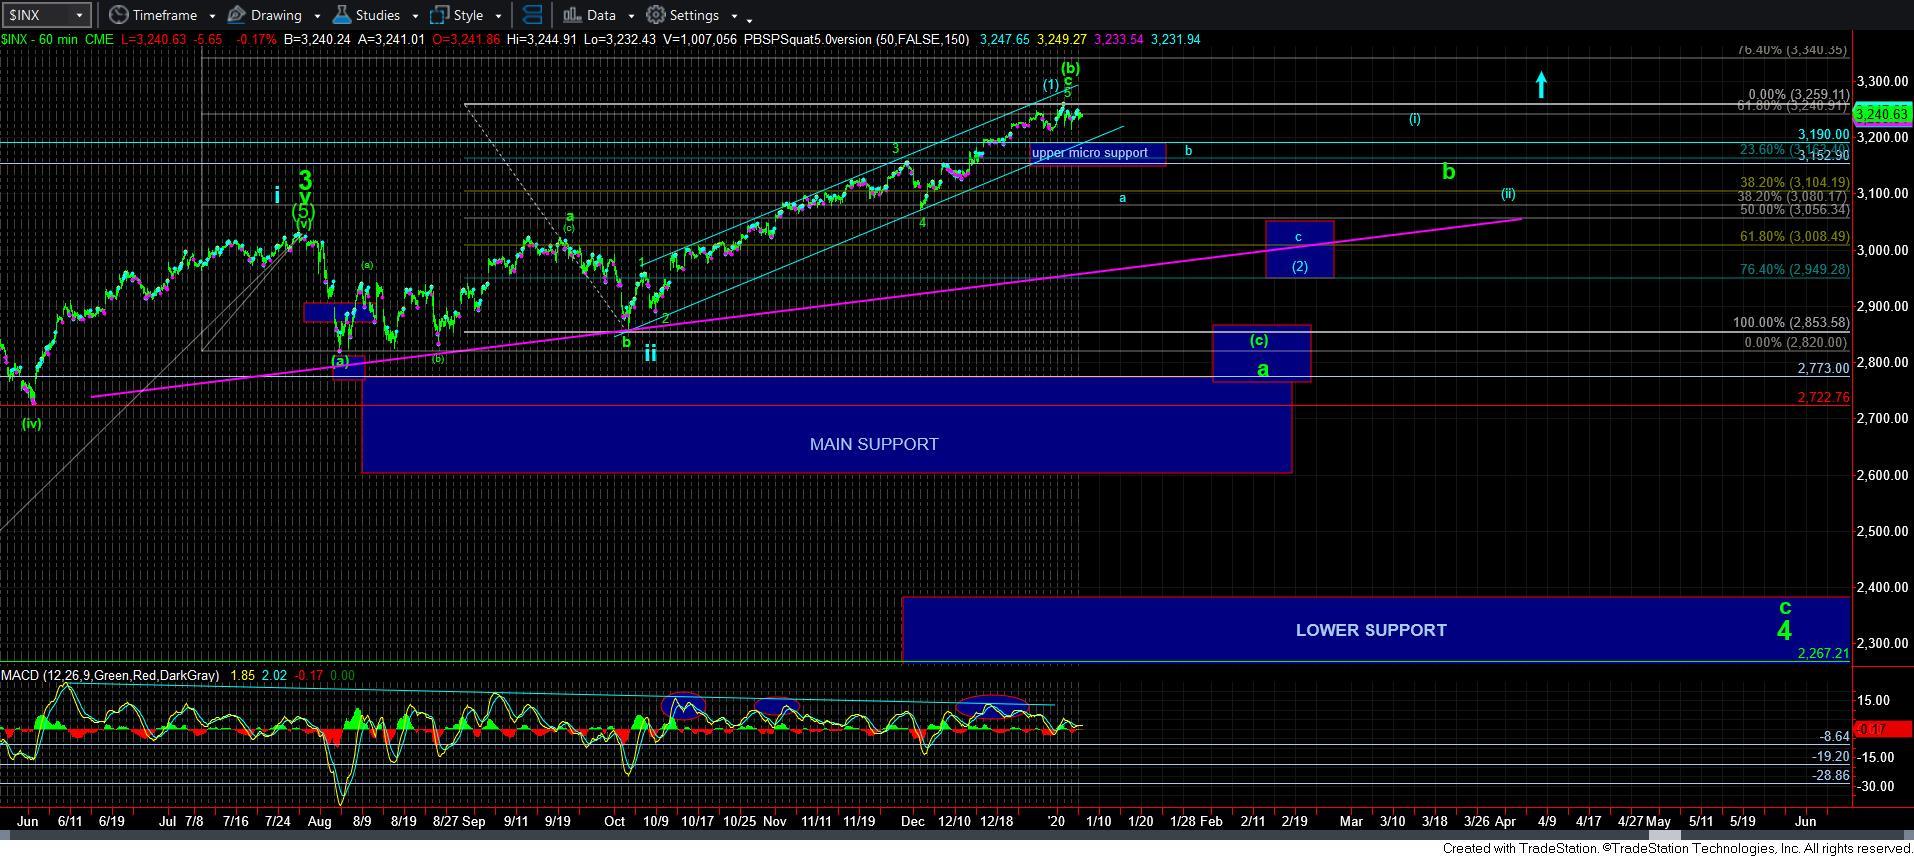
However, should we break out over the overnight high, then it opens the door to rally up towards the 3330 region to complete yellow wave [3] of iii.