Corrective Action Is Most Likely In Progress
With the market leaving us with a downside set up on Friday, we saw the overnight action take us down towards the low struck in the futures last week. However, the overall structure of the market since we have struck the last all-time high seems to be overlapping and corrective.
For this reason, I still think we are likely setting up to test the support region in the 3150-90 region once this consolidation completes. Yet, the question remains as to what type of consolidation we are dealing with?
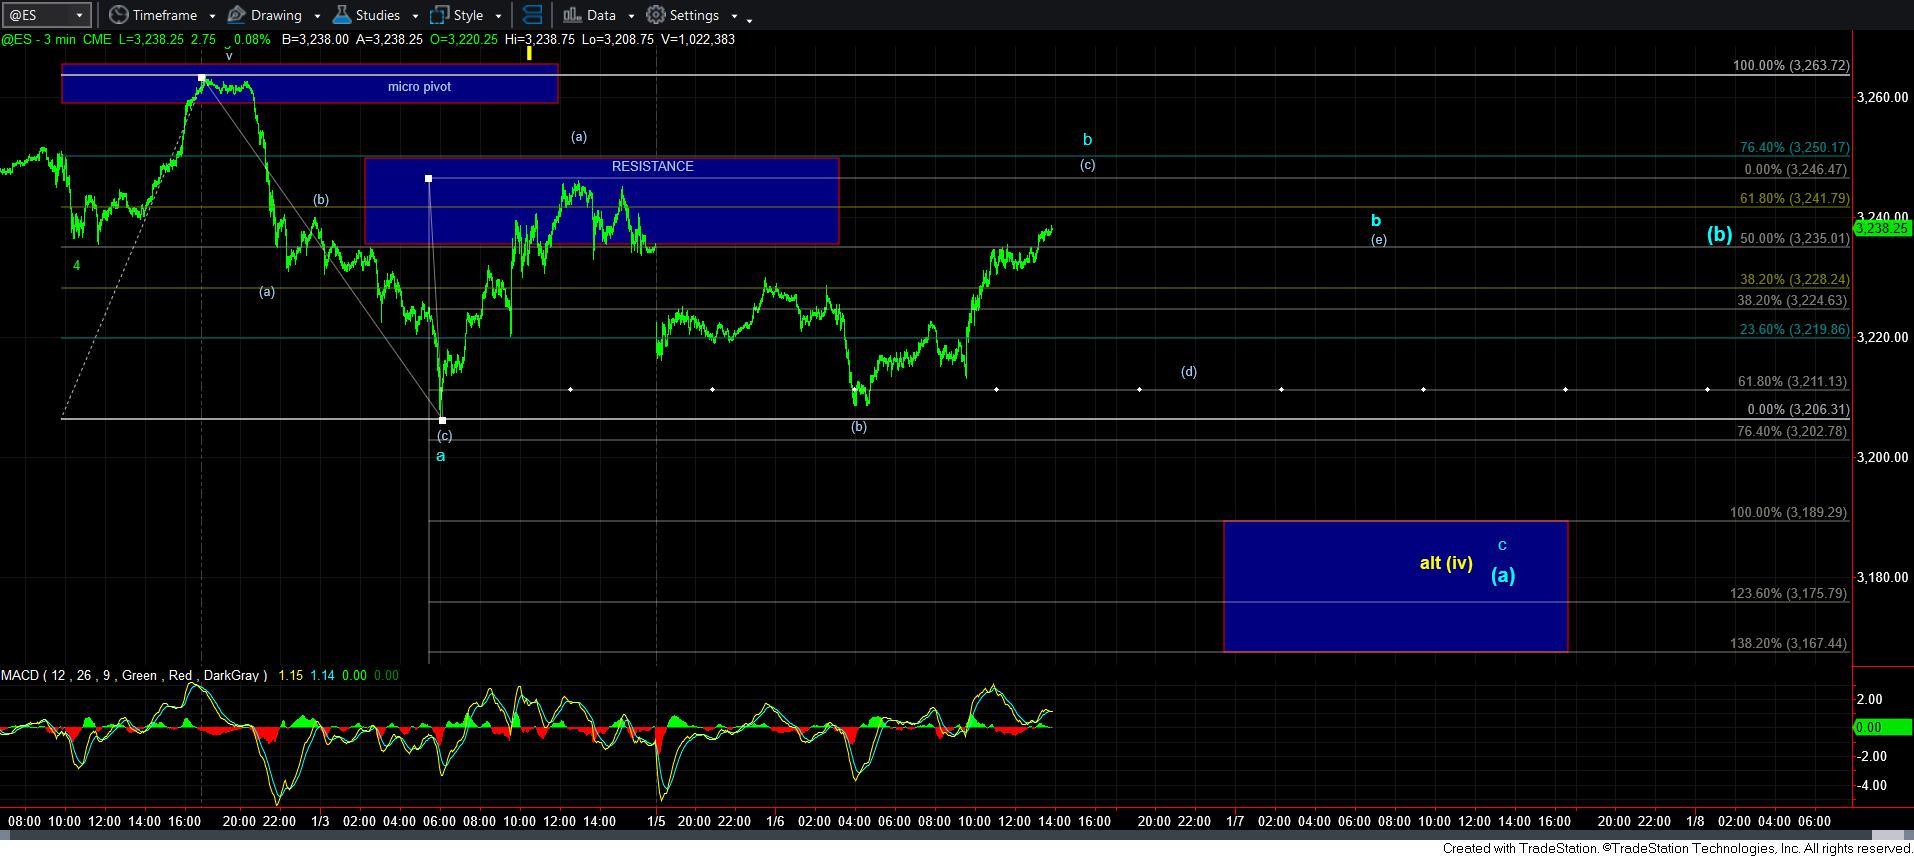
The attached 3-minute ES chart probably outlines this potential best. If the market is able to continue higher towards Friday’s high, then I think we would have completed a b-wave flat, which will point us down towards the 3190 region and a test of our support below.
However, if the market cannot at least reach Friday’s high, then I will be tracking the potential for the ES to morph into a b-wave triangle in this region, with the [d] and [e] waves still to fill in before we drop to our support below.
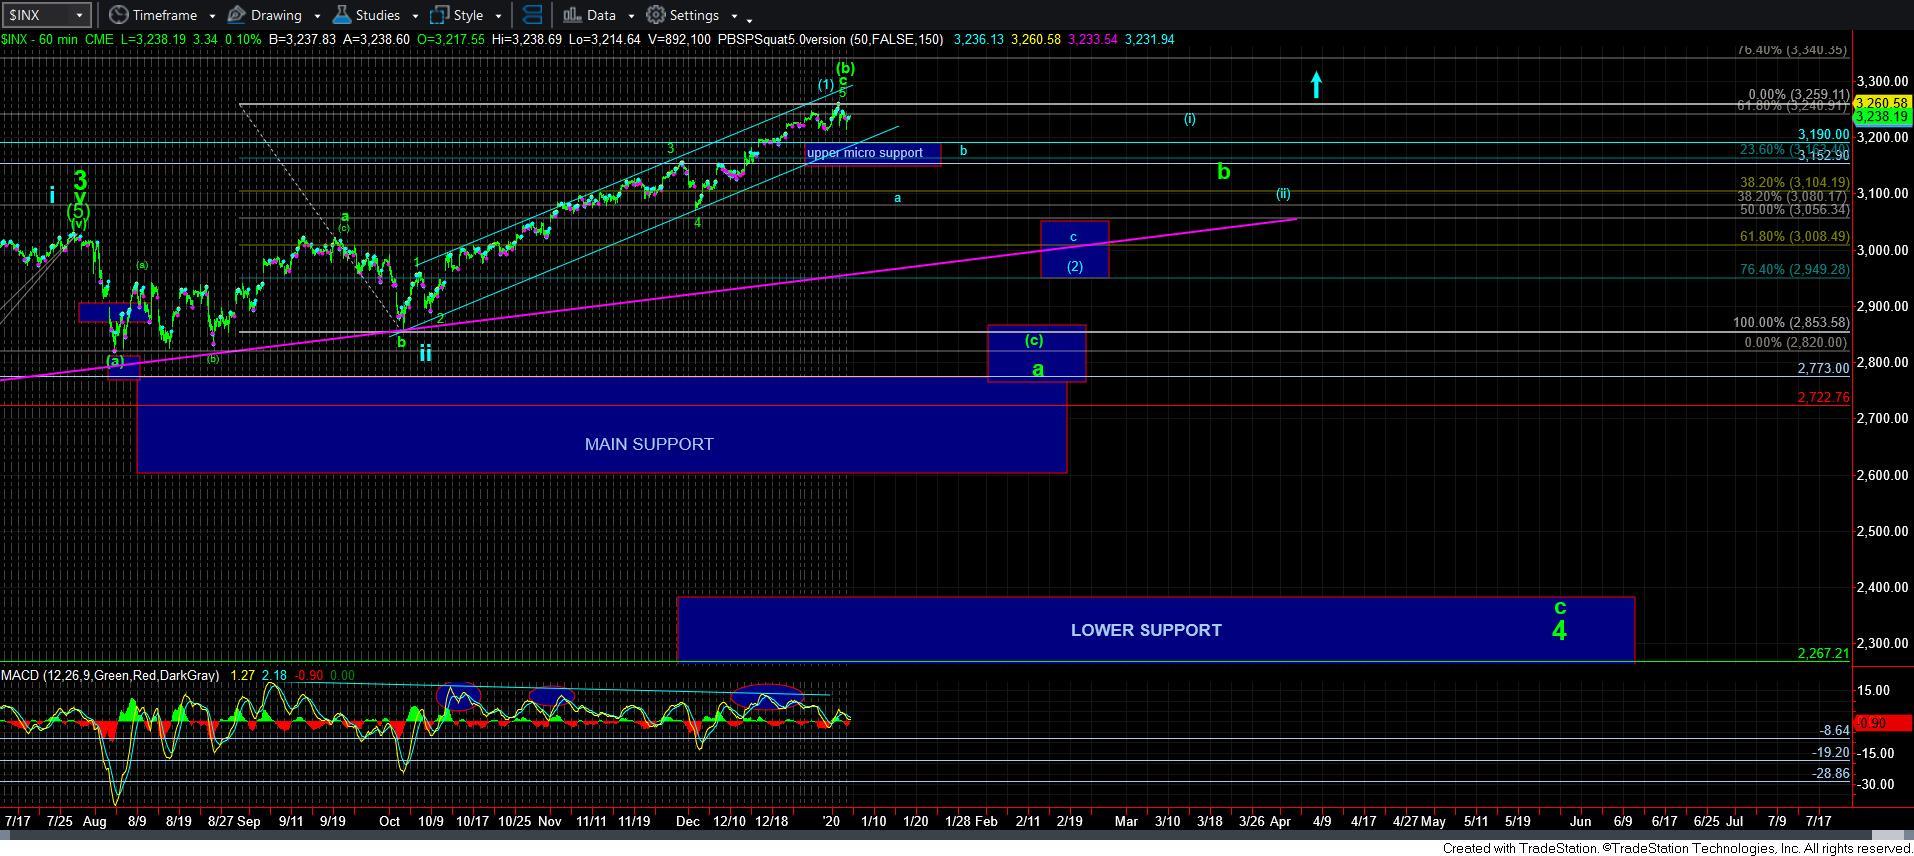
The question which is still open is whether the current action is the start to the blue wave [2] pullback for which we have been eagerly awaiting, or if the market is still going to push higher in the yellow count to the 3330 region before we see a bigger pullback. At this point in time, I am leaning towards the blue count, but have nothing to clearly point towards to suggest this is a high probability at this point in time. As long as we remain over 3150SPX, the yellow count will remain on my radar. Yet, as long as we remain below 3250, pressure will remain to the downside.
Lastly, please remember that I am going to keep the green count on the chart for now, at least until we break down bellow 3150 to make sure we will do so correctively, which will then allow me to take this off the chart.