Correction Flood Gates Opened Today
With so many people shorting this rally off the March lows for various reasons, today’s action evidences that most of them were likely forced to exit their shorts. And, based upon a number of put/call ratios I have seen, it would explain the direct drop we experienced today without much in the way of bounces.
While I did not have a specific set up pointing to this type of decline to take hold today, the break down of the 3150SPX level has certainly lead us to confirm our expectations for a larger degree pullback to take shape. And, as I wrote early this morning, the market is making it clear it has begun the pullback.
And, yes, you heard that right. The market has only likely begun the pullback.
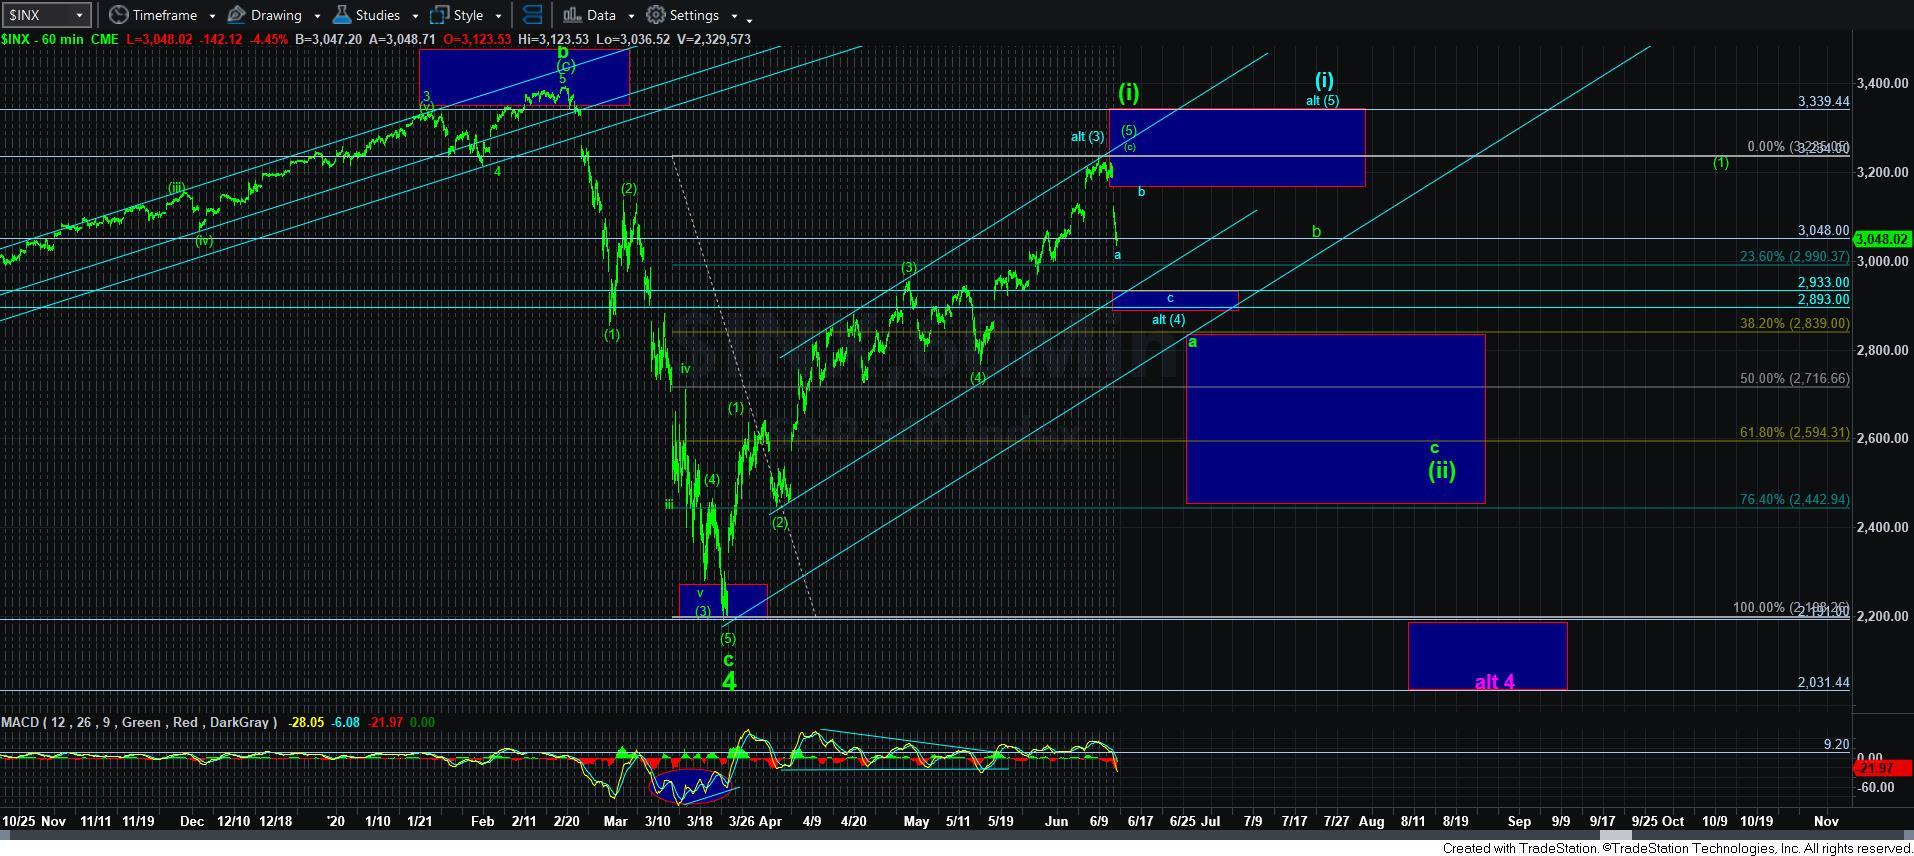
Before I begin in the higher probability analysis, I want to address the many questions I am getting about the purple 4 that is sitting well below us. I still view this as a lower probability. But, consider this. If we have indeed topped out in wave [i] as a leading diagonal, as presented in green, 2ndwave pullbacks off a leading diagonal high often tend to be quite deep. That is why the lower end of my target box is as deep as the .764 retracement of wave [i], which is in the 2450SPX region.
So, at the end of the day, we would have to break the 2450SPX level to point us to the 2030 level, which would be a more extended wave 4. But, again, at this point in time, I view that as a lower probability. Yet, I felt the need to address it since many are already getting emotional about the decline today.
To that end, I want to remind you that the character of a 2nd wave is generally to make people convinced that the “bear market” is certainly back. So, keep that in the back of your mind as this corrective progresses.
In the meantime, there are 2 main patterns I have been tracking. And, I still cannot let go of the blue count potential, as a number of the sector charts really would support that potential. But, I am not giving that a lot of room to prove itself.
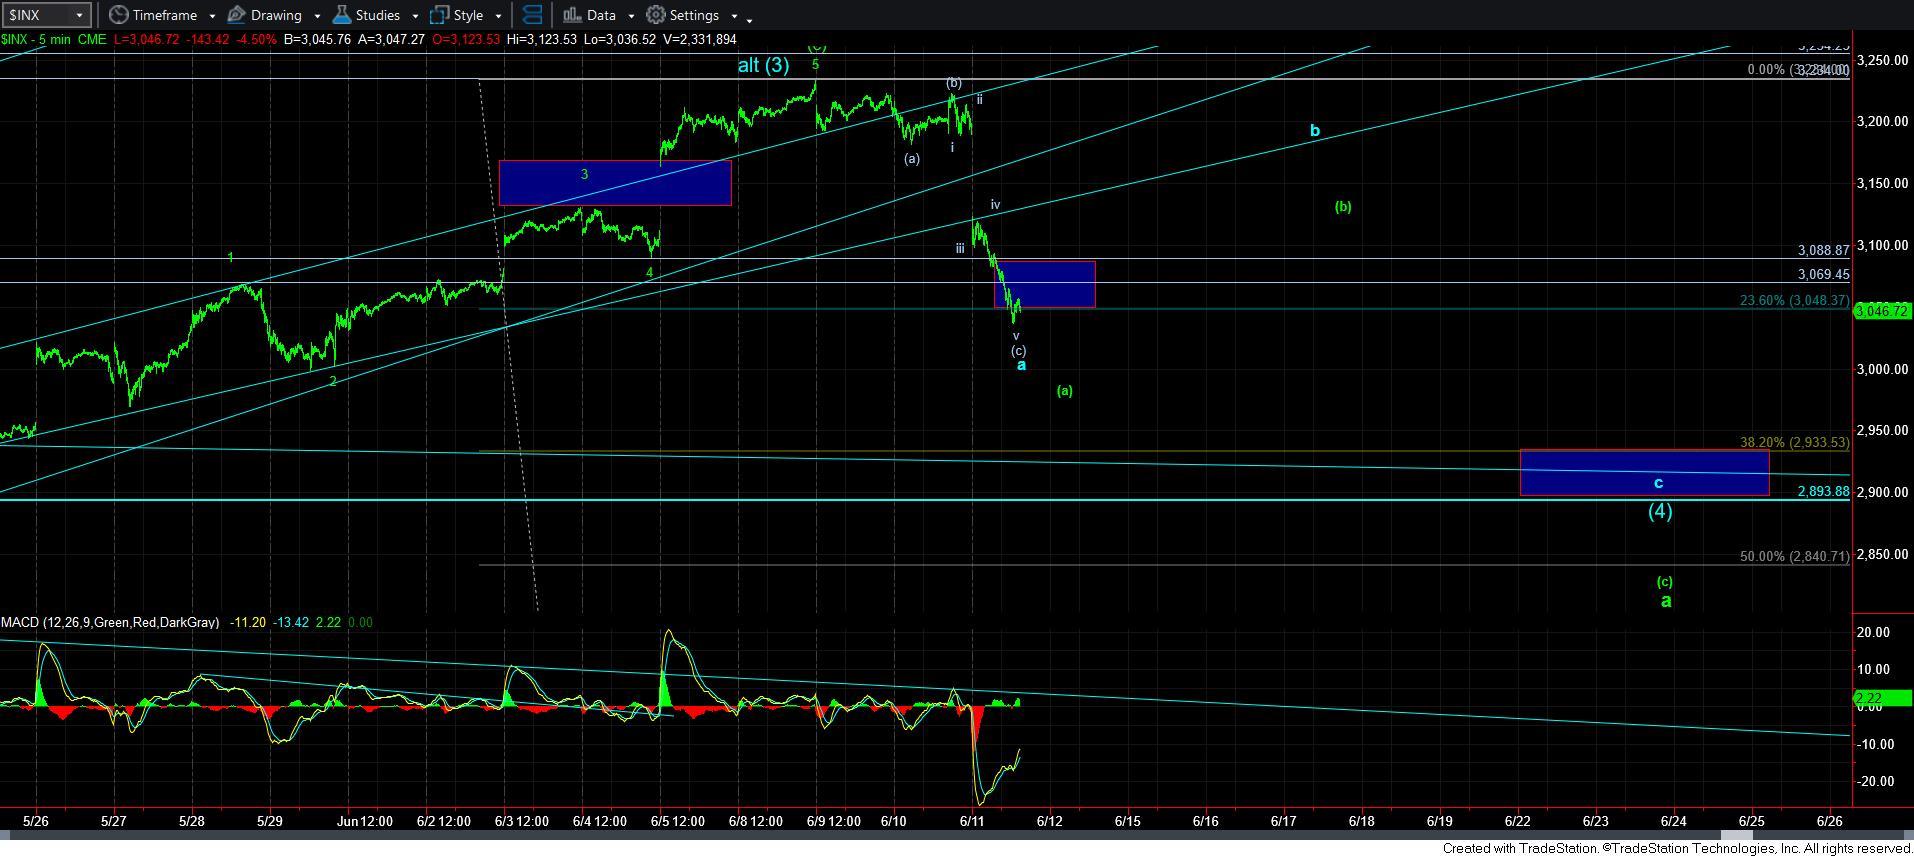
As far as the green count is concerned, we would certainly break below the 2890SPX region, and that could even count as simply the a-wave of wave [ii]. I have outlined a general path for the green count on both the 5-minute chart and the 60-minute chart.
So, in summary, I think it is LIKELY that the market has begun a decline to at least the 2890-2930SPX region. And, that would be a bullish indication if the a-b-c structure points into that support zone, and would increase the probabilities for the blue count.
However, if the market is unable to hold the 2890SPX support region, the it remains highly likely that this decline is the wave [ii] pullback in green.
With the market striking within pennies of the ideal target I outlined over the last few weeks in the 3234SPX region, I also tried to highlight over the weekend that the next few weeks will likely provide direction for us for the remaining half of 2020. We have just begun this correction, so the next week or so will likely give us significant guidance regarding the most likely path for the rest of 2020.